Back to Journals » Medical Devices: Evidence and Research » Volume 7
Pulse oximetry: fundamentals and technology update
Authors Nitzan M, Romem A, Koppel R
Received 15 March 2014
Accepted for publication 1 May 2014
Published 8 July 2014 Volume 2014:7 Pages 231—239
DOI https://doi.org/10.2147/MDER.S47319
Checked for plagiarism Yes
Review by Single anonymous peer review
Peer reviewer comments 3
Meir Nitzan,1 Ayal Romem,2 Robert Koppel3
1Department of Physics/Electro-Optics, Jerusalem College of Technology, Jerusalem, Israel; 2Pulmonary Institute, Shaare Zedek Medical Center, Jerusalem, Israel; 3Neonatal/Perinatal Medicine, Cohen Children's Medical Center of New York/North Shore-LIJ Health System, New Hyde Park, NY, United States
Abstract: Oxygen saturation in the arterial blood (SaO2) provides information on the adequacy of respiratory function. SaO2 can be assessed noninvasively by pulse oximetry, which is based on photoplethysmographic pulses in two wavelengths, generally in the red and infrared regions. The calibration of the measured photoplethysmographic signals is performed empirically for each type of commercial pulse-oximeter sensor, utilizing in vitro measurement of SaO2 in extracted arterial blood by means of co-oximetry. Due to the discrepancy between the measurement of SaO2 by pulse oximetry and the invasive technique, the former is denoted as SpO2. Manufacturers of pulse oximeters generally claim an accuracy of 2%, evaluated by the standard deviation (SD) of the differences between SpO2 and SaO2, measured simultaneously in healthy subjects. However, an SD of 2% reflects an expected error of 4% (two SDs) or more in 5% of the examinations, which is in accordance with an error of 3%–4%, reported in clinical studies. This level of accuracy is sufficient for the detection of a significant decline in respiratory function in patients, and pulse oximetry has been accepted as a reliable technique for that purpose. The accuracy of SpO2 measurement is insufficient in several situations, such as critically ill patients receiving supplemental oxygen, and can be hazardous if it leads to elevated values of oxygen partial pressure in blood. In particular, preterm newborns are vulnerable to retinopathy of prematurity induced by high oxygen concentration in the blood. The low accuracy of SpO2 measurement in critically ill patients and newborns can be attributed to the empirical calibration process, which is performed on healthy volunteers. Other limitations of pulse oximetry include the presence of dyshemoglobins, which has been addressed by multiwavelength pulse oximetry, as well as low perfusion and motion artifacts that are partially rectified by sophisticated algorithms and also by reflection pulse oximetry.
Keywords: oxygen saturation, pulse oximetry, photoplethysmography, arterial blood, venous blood
Arterial oxygen saturation
The transfer of oxygen from the lungs to the tissue cells is carried out mainly by the hemoglobin molecules in the red blood cells. The total oxygen content in blood includes the hemoglobin-bound oxygen (97%–98% of the total oxygen content) and the oxygen dissolved in plasma. The level of arterial hemoglobin oxygenation is assessed by oxygen saturation in arterial blood (SaO2), which is the ratio of oxygenated hemoglobin concentration [HbO2] to total hemoglobin concentration in the blood ([HbO2] + [Hb]):

SaO2 has the same value throughout the arterial system, since oxygen is extracted from the blood only in the capillaries. The concentration of dissolved oxygen in arterial blood is measured by arterial oxygen partial pressure (PaO2). SaO2 increases as PaO2 increases in an S-shaped curve, the dissociation curve, which depends on blood temperature, acidity level, and the concentration of several substances in the blood. Typical values of PaO2 for adults at sea level range between 80 and 100 mmHg and those of SaO2 between 96% and 98%. Because of the gradual slope of the upper part of the dissociation curve, a change of PaO2 from 100 to 70 mmHg under normal conditions only results in a decrease of SaO2 from 97% to 92%. With regard to venous blood, the normal range of oxygen saturation is 70%–80%, and oxygen partial pressure varies in the range of 40–50 mmHg.1,2
PaO2 and SaO2 have major clinical and physiological significance, since they are dependent on the adequacy of respiratory function and are directly related to the oxygen supply to the organs. Both PaO2 and SaO2 can be obtained from a sample of extracted arterial blood: PaO2 can be measured with an arterial blood gas analyzer and SaO2 by co-oximetry, which uses the different light absorption spectra for oxygenated and deoxygenated hemoglobin. PaO2 and SaO2 can also be measured noninvasively. The noninvasive transcutaneous PaO2 electrode has low accuracy and requires heating of the skin to 43°C–44°C.3,4 The noninvasive technique of pulse oximetry5–7 for the assessment of SaO2 is the subject of the current review. After describing the fundamentals of the technique, the review discusses the origins and the level of inaccuracy in oxygen-saturation measurement by pulse oximetry, as well as the clinical significance of the error in SaO2 measurement, particularly in newborns.
Pulse oximetry – the technique
The optical techniques that have been developed for the assessment of SaO2 are based on the different light-absorption spectra for HbO2 and Hb. Figure 1 shows the extinction coefficients – the specific absorption constants – of HbO2 and Hb as a function of wavelength in the visible and near-infrared regions. The extinction coefficient of each type of hemoglobin is defined as the absorption constant of the hemoglobin in a sample, divided by the hemoglobin concentration in the sample. The hemoglobin in blood includes HbO2 of extinction coefficient εO and Hb of extinction coefficient εD, and the total extinction coefficient in the arterial blood, ε, is related to its SaO2 by:

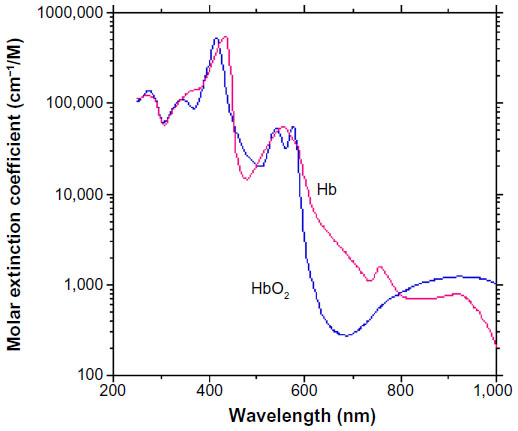 | Figure 1 Absorption spectra of the oxygenated and deoxygenated hemoglobin molecules. |
so that light-absorption measurements can provide assessment of SaO2.
Hemoglobin is the main source for light absorption in tissue in the red and near-infrared regions, but other chromophores like melanin and myoglobin can also absorb light in these regions. Venous blood, with less oxygenated hemoglobin, also absorbs light in the same spectral region as that of arterial blood. The need to isolate the contribution of hemoglobin in arterial blood to total absorption has led to the development of pulse oximetry.
Pulse oximetry for the assessment of SaO2 is based on photoplethysmography (PPG), the measurement of light-absorption increase due to the systolic increase in arterial blood volume.5,6 The PPG signal is shown in Figure 2. Transmitted light intensity decreases during systole, when blood is ejected from the left ventricle into the vascular system, thereby increasing the peripheral arterial blood volume. The maximal and minimal values of the PPG pulse reflect light irradiance transmitted through tissue when tissue blood volume is minimal or maximal, respectively. The PPG amplitude is related to the light absorption in the arterial blood volume increase during systole.
 | Figure 2 The photoplethysmography signal. |
The technique of pulse oximetry has been described in several publications.6,9–11 PPG measurement in each wavelength enables the assessment of the contribution of arterial blood to the total absorption of light, assuming that the PPG signal reflects changes in arterial blood volume. The PPG-signal amplitude (generally denoted AC) divided by its baseline (generally denoted DC) is related to the maximal blood volume change during systole.12 In order to measure SaO2, PPG curves in two wavelengths are recorded, and SaO2 is derived from the ratio of ratios, R, defined as:

Direct determination of SaO2 from PPG measurements in several wavelengths using the Beer–Lambert law is not applicable, because light scattering in tissue and blood also affects attenuation of light in tissue. Light scattering in blood is due to the difference in the refractive index between red blood cells and plasma, and light scattering in tissue is attributed to the difference in refractive index between cellular organelles and cellular fluid, as well as between intracellular and extracellular fluids.13,14 Scattering results in the escape of light from tissue in various directions, and also increases the path length of light in tissue, thereby increasing the probability for absorption in the blood. In order to determine the value of SaO2 for blood in tissue from light-transmission measurements, the contribution of light absorption to the total attenuation must be isolated.
In commercial pulse oximeters, the two wavelengths are chosen in the red and infrared regions, where the difference in light absorption between the two wavelengths is relatively large. However, the scattering constant and the optical path length differ significantly between the red and infrared wavelengths, and consequently the relationship between the physiological parameter SaO2 and the measured parameter R cannot be derived directly from physical and physiological considerations of light absorption in HbO2 and Hb, based on the Beer–Lambert law. The relationship between R and SaO2 is determined experimentally for each type of commercial pulse oximeter sensor by calibration:6,7 R is measured in several healthy volunteers simultaneously with in vitro measurement of SaO2 in extracted arterial blood by means of co-oximetry. The formula relating R to SaO2 is determined by proposing a mathematical relationship, such as:

and obtaining the values of the constant ki for the specific pulse oximeter by best-fit analysis of the measured parameters in the calibration process.
Empirical calibration is based on the assumption that the relationship between the measured parameter R and the physiological parameter SaO2 is not influenced by intersubject variability in the circulatory system. However, a change in the optical path length, if not equivalent in the red and infrared wavelengths, can change the relationship between R and SaO2.15,16 If the red–infrared path-length ratio changes between different subjects, in particular between the healthy subjects on whose fingers the empirical calibration was performed and the patients on whose fingers the clinical examination was carried out, inaccuracy in SaO2 measurement could be expected. The SaO2 value measured by pulse oximetry is denoted as SpO2, and its deviations from the SaO2 value directly measured in extracted blood are discussed.
The accuracy of pulse oximetry
The accuracy of a pulse oximeter is evaluated by the differences between SpO2, the oxygen-saturation values measured by the pulse oximeter, and SaO2, measured by co-oximetry in extracted blood, the gold standard.17 Most manufacturers of pulse oximeters claim an accuracy of 2%, which is the standard deviation (SD) of the differences between SpO2 and SaO2. A standard deviation of 2% is associated with an expected error of 4% (two SDs) or more among 5% of the examinations (assuming that the distribution curve of the differences between SpO2 and SaO2 has normal distribution, the area under the curve at a distance greater than two SDs from the mean is 5% of the total area). In clinical studies, it was found that the accuracy for a single measurement of SpO2 is 3%–4% and for monitoring SpO2 in a specific patient 2%–3%.17,18 Considering the fact that the relevant clinical range of SaO2, including most sick patients, is 80%–100%, an error of 3%–4% could be of major significance. Despite this low accuracy, pulse oximetry enables the detection of an abrupt drop of SpO2 by 3%–4% in patients during anesthesia or in an intensive care unit. It is accepted that a significant decrease in SpO2 value obtained by the available commercial pulse oximeters is a reliable parameter for the detection of significant deterioration in respiratory function.
It should be known, however, that the accuracy of SpO2 measurement is not equivalent to that of invasive SaO2 measurement. In intensive care units, where inadequate oxygen supply to vital organs may be particularly harmful, maintaining a minimum SpO2 level of 94% or 96% in mechanically ventilated patients has been proposed, in order to ensure a minimal SaO2 value of 90%.19,20 In a study on critically ill patients21 the correlation between spontaneous changes in SpO2 and in SaO2 was found to be relatively low (r=0.6, r2=0.37), leading the authors to conclude that changes in SpO2 do not reliably predict equivalent changes in SaO2 in the critically ill.
As was explained earlier, inaccuracy in SpO2 measurement in critically ill patients is to be expected, because the empirical calibration of pulse oximeters is based on examinations on healthy volunteers and is not necessarily applicable to critically ill patients. The discrepancy between healthy volunteers examined during the empirical calibration process and patients is further accentuated in neonates.22 The deviation of SpO2 from SaO2 is even greater at saturations below 70%–80%,11,23–26 because ethical restrictions prevent manufacturers from reducing SaO2 below 80% during the calibration process. The inaccuracy associated with the co-oximetry itself (upon which the calibration process is based) is an additional contributing factor to the error in SpO2 measurement.17
The accuracy of SpO2 measurement can be of great significance for critically ill patients undergoing oxygen therapy. Lately, evidence has accumulated to support the need for precise control of arterial oxygenation in order to avoid hyperoxemia and the ill effects of oxygen toxicity associated with it.27 The detection of hyperoxemia in these patients is especially problematic, because the dissociation curve is almost flat in the high SaO2 range, ie, greater than 95%, and thus relatively small changes in SaO2 are associated with large changes in PaO2. The limited ability of pulse oximetry to accurately determine the level of excess oxygenation is particularly important for preterm newborns receiving supplemental oxygen, due to their vulnerability to retinopathy of prematurity, induced by high PaO2 in arterial blood. The significance of accurate SpO2 measurement was demonstrated in three studies – SUPPORT (Surfactant, Positive Pressure, and Oxygenation Randomized Trial), BOOST (Benefits Of Oxygen Saturation Targeting) II, and COT (Canadian Oxygen Trial) – where 4,911 preterm newborns receiving oxygen supplementation were randomized to either a low (85%–89%) or high (91%–95%) SpO2 value.28 Increased risk of mortality was noted in the first group, while an increased incidence of retinopathy of prematurity was found in the second group. The authors of the meta-analysis of those studies28 recommended that SpO2 should be targeted at 90%–95% in infants with gestational age <28 weeks. Some authors29–31 suggest that pulse oximetry should not be the sole means for monitoring oxygenation in the neonatal intensive care unit.
An additional source for inaccuracy in SpO2 measurement in newborns is fetal hemoglobin, which can constitute 95% of total hemoglobin and is slightly different from that of adult hemoglobin. The maximal expected error due to fetal hemoglobin in neonates was estimated by Mendelson and Kent32 to be 3% (using theoretical simulations), and this error should be added to other sources of inaccuracy in SpO2 measurement in neonates. Experimental examinations showed a 4% effect of fetal hemoglobin on neonatal pulse oximetry.33,34
Pulse oximetry for the detection of congenital heart diseases in neonates
Pulse oximetry has also been proposed as a newborn-screening test for the detection of critical congenital heart disease (CCHD), defined as CHD requiring surgery or catheter intervention in the first year of life.35 This application of pulse oximetry is distinctive, because it provides an assessment of cardiac physiology, while the usual aim of SpO2 measurement is the evaluation of respiratory function. Early detection of neonates with ductal-dependent CCHD is important, because their survival depends on the patency of the ductus arteriosus to ensure adequate pulmonary and systemic blood flow. Since the majority of infants with CCHD have some degree of hypoxemia during the newborn period,35 pulse oximetry has been recommended as a screening test for the detection of neonatal CCHD before discharge, prior to the onset of symptoms. Though postnatal echocardiography is well established as the gold standard for diagnosing congenital heart diseases, it has significant limitations as a screening tool, mainly because of its cost and lack of availability of trained personnel to perform the examinations.36
The effectiveness of pulse-oximetry screening has been demonstrated in multiple international clinical trials. In a study in the UK,36 more than 20,000 neonates were examined in the right hand and either foot. Saturation of <95% in either limb or a difference of >2% between the limb readings was taken as abnormal. In this study, pulse oximetry had a sensitivity of 75% for critical cases and a specificity of 99.16%. Similar criteria were suggested by the American Academy of Pediatrics:37 saturation of ≥95% in either limb with a difference of ≤3% between the upper and lower limbs was taken as normal. In a systematic review and meta-analysis,38 the authors selected studies that assessed the accuracy of pulse oximetry for the detection of CCHD in asymptomatic newborns, and found high specificity (99.9%) with moderate sensitivity (76.5%).
Limitations of pulse oximetry and technological update
Dyshemoglobins and multiwavelength pulse oximetry
Apart from HbO2 and Hb, adult blood may contain dyshemoglobin: hemoglobin derivatives, which are not functional because they are not able to reversibly bind oxygen molecules at physiological levels of PaO2 in blood. The most important dyshemoglobins are methemoglobin (MetHb) and carboxyhemoglobin (COHb), which are commonly present in low concentrations in normal subjects. Increased concentration of dyshemoglobin molecules in blood (such as in CO poisoning) can reduce the effectiveness of tissue oxygenation. Functional SaO2 is defined as the percentage of HbO2 relative to the sum of HbO2 and Hb, while fractional SaO2 is defined as the percentage of HbO2 relative to the total of four variants of hemoglobin.39 At low concentrations of dyshemoglobins, the distinction between these two parameters is of negligible significance because of the small difference between them; at high-enough levels, both functional and fractional readings can be compromised.30,40 A change of COHb concentration by 1% changes the pulse-oximetry reading by about 1%.22
Conventional pulse oximeters that utilize two wavelengths of light for the assessment of oxygen saturation are based on the assumption that HbO2 and Hb are the only absorbers of light in these two wavelengths in the blood. Since MetHb and COHb absorb light in the wavelengths used in pulse oximetry,22,40 an error in SpO2 measurement is expected in the presence of these dyshemoglobins. Some manufacturers have developed pulse oximeters that use more than two light wavelengths, thereby enabling estimation of blood levels of COHb and MetHb (as well as total hemoglobin concentration). The accuracy of these measurements has been studied in healthy volunteers and among patients with suspected CO poisoning in emergency departments. Some studies showed accurate measurement of COHb and MetHb,22,40–42 while others43,44 claim that pulse co-oximetry cannot replace standard blood COHb measurement, though it could be used as a first-line screening test.
Low perfusion and reflection pulse oximetry
In transmission pulse oximetry, light is detected after being transmitted through an organ, and is therefore limited to fingertips and earlobes. The blood flow to the fingertips and earlobes is greater than what is required by tissue metabolism, due to their role in heat transfer, and under normal conditions their PPG pulses have a high signal-to-noise ratio. However, these organs are under intensive regulation by the autonomic nervous system, and in cases of low surrounding temperature or low cardiac output, their arteries are constricted in order to reduce heat dissipation or to maintain sufficient blood supply to the critical core organs: the heart, brain, and kidneys. In such cases, the PPG signal decreases, reducing pulse-oximeter accuracy. Reflection pulse oximetry, in which the light sources and the photodetector are located on the same surface of the skin, can be applied on any accessible site, and is thus of advantage in low peripheral perfusion conditions.45,46
The main site used for reflection pulse-oximetry measurement is the forehead. Studies in which a forehead sensor and a digit sensor were compared to SaO2 measurements by co-oximetry showed conflicting results. In measurements on well-perfused pediatric patients, the forehead sensor was found to be as accurate as the digit sensor.47 Comparison of forehead and digit sensors in critically ill surgical/trauma patients at risk for decreased peripheral perfusion showed lower bias between SpO2 and SaO2 for the forehead sensor,48 and similar results were found in patients with low cardiac index.49 Contradictory results showing inferior accuracy of reflective oximetry were found in a study on adults with acute respiratory distress syndrome during a high positive end-expiratory pressure recruitment maneuver.50
Some companies suggest reflection pulse oximeters for the finger. The advantage of reflection finger-pulse oximeters is their low power consumption, since the distance between the light sources and the detector can be shortened, resulting in lower light absorption. Reflection pulse oximeters were also suggested in accessible internal structures, such as the esophagus,11,51,52 pharynx, and trachea.53,54 Researchers claim that measurements at these sites are more reliable in conditions of low peripheral perfusion.
Low perfusion induced by vasoconstriction, which results in a decreased PPG signal, is also associated with an increase in SpO2 value.55–57 Local hyperthermia resulted in a significant decrease in SpO2, while during local hypothermia SpO2 increased.56 A similar effect was found following administration of propofol/nitrous oxide anesthesia, leading to alteration of peripheral vascular tone and concomitant changes in skin temperature.55 The observed increase in SpO2 probably reflects decreased transmission of arterial pulsations to venous blood in the finger,55 but it can also be speculated that the effect is related to the calibration process. Changes in scattering parameters due to changes in microcirculation can interfere with the relationship between the measured parameter R and SaO2 (Equation 4), which was obtained in healthy subjects under normal thermal conditions.
Calibration
In a former section we described the empirical calibration required for the determination of the relationship between R and SaO2, which should be determined experimentally for each specific type of pulse-oximeter sensor: R and SaO2 in extracted arterial blood are measured simultaneously in several healthy persons, each with several values of SaO2. The relationship between R and SaO2 (in the form of Equation 4) is obtained by best-fit analysis of R and SaO2 values, measured in the calibration process. We hypothesized that the calibration process, which is based on statistical grounds, is responsible, at least partly, for the discrepancy between the pulse-oximetry output, SpO2, and SaO2.
Several techniques have been proposed to obviate the need for calibration. Reddy et al58 suggested a method based on a mathematical model for the attenuation of light passing through the soft tissue, bone, and blood of a finger. Based on the model, SpO2 is derived from the amplitudes and slopes of the PPG pulses in red and infrared and the extinction coefficients for HbO2 and Hb. Examinations performed on healthy volunteers and patients showed agreement with a commercial pulse oximeter. Another calibration-free method based on frequency-modulated near-infrared spectroscopy (NIRS) was suggested.14,59 However, both techniques are based on mathematical models that match tissue circulation only in approximate terms.
As explained earlier, the relationship between R and SaO2 cannot be derived by analyzing the PPG signals in two wavelengths in red and infrared (using the Beer–Lambert law and the different absorption spectra in HbO2 and Hb), because of the difference in light scattering between wavelengths in red and infrared. If the two wavelengths are close enough to each other so that the difference between their path-lengths can be neglected, it is possible to analytically derive the relationship between the ratio R and SaO2:6,9,60

where εo and εd are the extinction coefficient values for HbO2 and Hb, respectively. The indices 1 and 2 refer to the two wavelengths. The form of Equation 5 is similar to that of Equation 4, but the coefficients of R are known: the extinction coefficient values were measured in hemolyzed extracted blood by several research groups.61–64
Equation 5 enables the derivation of SaO2 from the measured parameter R and the values of the extinction coefficients with no need for calibration. This was shown by Nitzan et al,60 using two infrared light-emitting diodes with emission spectra that peaked at wavelengths of 767 and 811 nm. The SaO2 values, using Equation 5, were in the range of 90%–100%, while SpO2 values obtained by commercial pulse oximeters (using red and infrared light and calibration) were 96%–98%. Higher accuracy was achieved in another study,65 in which the light-emitting diodes were replaced by infrared laser diodes with narrow-emission spectra, and the PPG pulses were analyzed by an improved technique. The SpO2 values measured by the two infrared wavelengths were in the range 95.3%–100.5%, and the difference between them and a commercial pulse oximeter for each examinee was 2% or less. The results of these preliminary studies provided proof of concept, but further development would be needed to make the technique clinically practical.
A similar calibration-free method based on three wavelengths in the infrared range was also suggested by the same group.16 The use of three adjacent wavelengths obviates the need for the assumption that the difference between the path lengths of the two wavelengths can be neglected, but the method has yet to be tested and validated.
Apart from being at an early stage of development, based on analysis of the Beer–Lambert Law, calibration-free techniques are not free of flaws. A common problem in calibration-free techniques is the need for accurate values of hemoglobin extinction coefficients in order to derive SaO2 from the PPG pulse parameters (such as R). The extinction coefficients values for HbO2 and Hb can be found in the literature61–64 for the wavelengths in the visible and infrared regions, but the discrepancy between the different sources is significant when aiming for accuracy of about 1%. This subject was treated by Kim and Liu64 with respect to NIRS measurements. It should be emphasized that a lack of accurate values of hemoglobin extinction coefficients does not affect the available technique of pulse oximetry, which is based on calibration.
Motion-artifact reduction and other technical achievements
Motion artifacts can reduce the reliability of SaO2 measurement, and are mainly important in pediatric patients and for monitoring during exercise and activities of daily living. Several companies have developed techniques for the elimination of motion artifacts in pulse oximeters, and since the subject has been reviewed and discussed in several articles,7,30,66,67 it is not discussed in this review. Motion rejection is generally achieved using various algorithms for differentiation between pure PPG signals and those contaminated by motion noise, but also through the introduction of improved hardware. Advances in PPG-signal analysis that are not related to pulse oximetry, such as the perfusion index and PPG variability, are also beyond the scope of the current review (see Cannesson and Talke).68
Venous blood oxygen saturation
Venous blood oxygen saturation (SvO2) has physiological and clinical diagnostic significance, because a low SvO2 value in a specific tissue combined with a normal SaO2 value indicates reduced blood flow to that tissue, and the arteriovenous oxygen–saturation difference (SaO2–SvO2) is related to the balance of oxygen supply and demand in the tissue.
Similar to the measurement of SaO2, pulse oximetry can also be used for the measurement of SvO2, utilizing the difference in light-absorption spectra for HbO2 and Hb. The isolation of light absorption in venous blood can be achieved by measuring the change in light absorption (in two wavelengths) following change in venous blood volume, induced either spontaneously or manually. However, in venous pulse oximetry, the scattering effect cannot be dealt with by in vitro calibration as in arterial pulse oximetry. While in vitro calibration can be performed in extracted arterial blood, because oxygen saturation has the same value in the whole arterial system, calibration by extracted venous blood cannot be applied to SvO2 measurement, since blood extracted from a specific large vein does not necessarily have the same oxygen-saturation value as that of small veins in the tissue site, where oximetry measurement is performed.16,60
Some researchers have utilized respiratory blood volume changes, assuming that these changes are venous in origin. SvO2 was derived from these changes based on previously derived empirical calibration for SaO2. Walton et al69 used an esophageal reflectance pulse-oximetry probe in cardiac surgery patients undergoing positive pressure ventilation, and Thiele et al70 used a reflectance pulse-oximetry probe placed directly over three veins in volunteers. Both measured the absorbance curves of red and infrared light, and extracted blood volume changes in respiratory frequency by frequency-domain or time-domain analysis. Some algorithms yielded saturations around 80%, which is within the venous oxygen-saturation physiological range.
Another technique used for isolating the absorption effect from the combined effects of absorption and scattering of light during its pass through the tissue is NIRS, a noninvasive optical technique for the determination of the concentrations of Hb and HbO2 and oxygen saturation in tissue. NIRS is based on the measurement of light transmission through the tissue at several wavelengths and derivation of the absorption constant at those wavelengths. The elimination of the scattering effects is done by means of several techniques, such as time-resolved spectroscopy and frequency-domain spectroscopy.13,14 In order to derive tissue oxygen saturation by NIRS, these techniques are supported by a mathematical model, such as the semi-infinite homogeneous model. Since the matching of the model to the examined tissue that is generally heterogeneous is not perfect, the results show significant errors when applied to measurements on living tissue.13,71–73
In order to isolate venous blood from arterial blood, NIRS was used together with venous occlusion by a pressure cuff74,75 or by hand.76,77 NIRS was also combined with measurements of oscillatory blood volume changes induced by spontaneous respiration78,79 or during mechanical ventilation,80 assuming that the oscillatory components of blood volume changes at the breathing rate are mostly of venous origin.
Venous occlusion by a pressure cuff to increase venous blood volume was also used with measurements of light transmission in two adjacent wavelengths60 for the assessment of SvO2. The technique is based on the assumption of similar path-length values for the two wavelengths, and is a modification of the calibration-free pulse oximetry for the measurement of SaO2 described in the section “Calibration”.
Conclusion
Pulse oximetry has been shown to be a useful noninvasive tool for evaluation of the respiratory system since its introduction about 30 years ago. Since that time, significant technological advances in commercially available pulse oximeters have been achieved, enabling better diagnosis and monitoring of patients. The great success of pulse oximetry masks the fact that it is still burdened by an inherent potential error of 3%–4% in measurements carried out on critically ill patients and preterm newborns. It seems that the inaccuracy problem is inherent in the current technology, and significant improvement in accuracy can be achieved only through a fundamental modification of pulse oximetry. In the current review, we hypothesized that at least partly, the low level of accuracy in pulse oximetry can be attributed to the empirical calibration that is essential for the execution of conventional pulse oximetry. It is possible that calibration-free pulse oximetry can provide SaO2 measurements of higher accuracy, but there is no evidence to support this at present.
Disclosure
The authors report no conflicts of interest in this work.
References
Guyton AC, Hall JE. Textbook of Medical Physiology. 9th ed. Philadelphia: WB Saunders; 1996. | |
Wagner PD. Ventilation, blood flow and gas exchange. In: Mason RJ, Broaddus VC, Murray JF, Nadel JA, editors. Murray and Nadel’s Textbook of Respiratory Medicine. Philadelphia: WB Saunders; 2005. | |
Farmer J. Blood oxygen measurement. In: Webster JG, editor. Design of Pulse Oximeters. Bristol: Institute of Physics; 1997:21–39. | |
Gold WM. Pulmonary function testing. In: Mason RJ, Broaddus VC, Murray JF, Nadel JA, editors. Murray and Nadel’s Textbook of Respiratory Medicine. Philadelphia: WB Saunders; 2005. | |
Yoshiya I, Shimady Y, Tanake K. Spectrophotometric monitoring of arterial oxygen saturation on the fingertip. Med Biol Eng Comput. 1980;18(1):27–32. | |
Wieben O. Light absorbance in pulse oximetry. In: Webster JG, editor. Design of Pulse Oximeters. Bristol: Institute of Physics; 1997:40–55. | |
Moyle JT. Pulse Oximetry. London: BMJ Books; 2002. | |
Prahl S. Optical absorption of hemoglobin. 1999. Available from: http://omlc.ogi.edu/spectra/hemoglobin/index.html. Accessed May 26, 2014. | |
Mannheimer PD, Casciani JR, Fein ME, Nierlich SL. Wavelength selection for low-saturation pulse oximetry. IEEE Trans Biomed Eng. 1997;44(3):148–158. | |
Zourabian A, Siegel A, Chance B, Ramanujan N, Rode M, Boas DA. Trans-abdominal monitoring of fetal arterial blood oxygenation using pulse oximetry. J. Biomed Optics. 2000;5(4):391–405. | |
Kyriacou PA. Pulse oximetry in the esophagus. Physiol Meas. 2006; 27(1):R1–R35. | |
Babchenko A, Davidson E, Ginosar Y, et al. Photoplethysmographic measurement of changes in total and pulsatile tissue blood volume, following sympathetic blockade. Physiol Meas. 2001;22(2):389–396. | |
Matcher SJ. Signal quantification and localization in tissue near-infrared spectroscopy. In: Tuchin VV, editor. Handbook of Optical Biomedical Diagnostics. Bellingham (WA): SPIE; 2002:487–584. | |
Fantini S, Francheschini MA. Frequency-domain techniques for tissue spectroscopy and imaging. In: Tuchin VV, editor. Handbook of Optical Biomedical Diagnostics. Bellingham (WA): SPIE; 2002:405–453. | |
Mannheimer PD. The light-tissue interaction of pulse oximetry. Anesth Analg. 2007;105(6):S10–S17. | |
Nitzan M, Engelberg S. Three-wavelength technique for the measurement of oxygen saturation in arterial blood and in venous blood. J Biomed Opt. 2009;14(2):024046. | |
Batchelder PB, Raley DM. Maximizing the laboratory setting for testing devices and understanding statistical output in pulse oximetry. Anesth Analg. 2007;105(Suppl 6):S85–S94. | |
Crapo RO. Pulmonary function testing. In Crapo JD, Glassroth J, Karlinsky JB, King TE, editors Baum’s Textbook of Pulmonary Diseases. 7th ed. Philadelphia: Lippincott Williams and Wilkins; 2004. | |
Seguin P, Le Rouzo A, Tanguy M, Guillou YM, Feuillu A, Mallédant Y. Evidence for the need of bedside accuracy of pulse oximetry in an intensive care unit. Crit Care Med. 2000;28(3):703–706. | |
Van de Louw A, Cracco C, Cerf C, et al. Accuracy of pulse oximetry in the intensive care unit. Intensive Care Med. 2001;27(10):1606–1613. | |
Perkins GD, McAuley DF, Giles S, Routledge H, Gao F. Do changes in pulse oximeter oxygen saturation predict equivalent changes in arterial oxygen saturation? Crit Care. 2003;7(4):R67–R71. | |
Fouzas S, Priftis KN, Anthrcopoulos MB. Pulse oximetry in pediatric practice. Pediatrics. 2011;128(4):740–752. | |
Poets CF, Southall DP. Noninvasive monitoring of oxygenation in infants and children: practical considerations and areas of concern. Pediatrics. 1994;93(5):737–746. | |
Tungjitkusolmun S. Accuracy and errors. In: Webster JG, editor. Design of Pulse Oximeters. Bristol: Institute of Physics; 1997:176–198. | |
O’Driscoll BR, Howard LS, Davison AG. BTS guideline for emergency oxygen use in adult patients. Thorax. 2008;63(Suppl 6):vi1–vi68. | |
Wilson BJ, Cowan HJ, Lord JA, Zuege DJ, Zygun DA. The accuracy of pulse oximetry in emergency department patients with severe sepsis and septic shock: a retrospective cohort study. BMC Emerg Med. 2010;10:9. | |
Martin DS, Grocott MP. Oxygen therapy in critical illness: precise control of arterial oxygenation and permissive hypoxemia. Crit Care Med. 2013;41(2):423–432. | |
Saugstad OD, Aune D. Optimal oxygenation of extremely low birth weight infants: a meta-analysis and systematic review of the oxygen saturation target studies. Neonatology. 2014;105(1):55–63. | |
Bohnhorst B, Peter CS, Poets CF. Detection of hyperoxaemia in neonates: data from three new pulse oximeters. Arch Dis Child Fetal Neonatal Ed. 2002;87(3):F217–F219. | |
Salyer JW. Neonatal and pediatric pulse oximetry. Resp Care. 2003;48(4):386–396. | |
Rosychuk RJ, Hudson-Mason A, Eklund D, Lacaze-Masmonteil T. Discrepancies between arterial oxygen saturation and functional oxygen saturation measured with pulse oximetry in very preterm infants. Neonatology. 2012;101(1):14–19. | |
Mendelson Y, Kent JC. Variations in optical absorption spectra of adult and fetal hemoglobins and its effect on pulse oximetry. IEEE Trans Biomed Eng. 1989;36(8):844–848. | |
Whyte RK, Jangaard KA, Dooley KC. From oxygen content to pulse oximetry: completing the picture in the newborn. Acta Anaesthesiol Scand Suppl. 1995;107:95–100. | |
Shiao SY, Ou CN. Validation of oxygen saturation monitoring in neonates. Am J Crit Care. 2007;16(2):168–178. | |
Mahle WT, Newburger JW, Matherne GP, et al. Role of pulse oximetry in examining newborns for congenital heart disease: a scientific statement from the AHA and AAP. Pediatrics. 2009;124(2):823–836. | |
Ewer AK, Furmston AT, Middleton LJ, et al. Pulse oximetry as a screening test for congenital heart defects in newborn infants: a test accuracy study with evaluation of acceptability and cost-effectiveness. Health Technol Assess. 2012;16(2):1–184. | |
Mahle WT, Martin GR, Beekman RH 3rd, et al. Endorsement of Health and Human Services recommendation for pulse oximetry screening for critical congenital heart disease. Pediatrics. 2012;129(1):190–192. | |
Thangaratinam S, Brown K, Zamora J, Khan KS, Ewer AK. Pulse oximetry screening for critical congenital heart defects (CCHD) in asymptomatic newborns: a systematic review and meta analysis. Lancet. 2012;379(9835):2459–2464. | |
Toffaletti J, Zijlstra WG. Misconceptions in reporting oxygen saturation. Anesth Analg. 2007;105(6):S5–S9. | |
Barker SJ, Curry J, Redford D, Morgan S. Measurement of carboxyhemoglobin and methemoglobin by pulse oximetry: a human volunteer study. Anesthesiology. 2006;105(5):892–897. | |
Annabi EH, Barker SJ. Severe methemoglobinemia detected by pulse oximetry. Anesth Analg. 2009;108(3):898–899. | |
Feiner JR, Rollins MD, Sall JW, Eilers H, Au P, Bickler PE. Accuracy of carboxyhemoglobin detection by pulse CO-oximetry during hypoxemia. Anesth Analg. 2013;117(4):847–858. | |
Touger M, Birnbaum A, Wang J, Chou K, Pearson D, Bijur P. Performance of the RAD-57 pulse CO-oximeter compared with standard laboratory carboxyhemoglobin measurement. Ann Emerg Med. 2010;56(4):382–388. | |
Sebbane M, Claret PG, Mercier G, et al. Emergency department management of suspected carbon monoxide poisoning: role of pulse CO-oximetry. Respir Care. 2013;58(10):1614–1620. | |
Mendelson Y, Ochs BD. Noninvasive pulse oximetry utilizing skin reflectance photoplethysmography. IEEE Trans Biomed Eng. 1988; 35(10):798–805. | |
Agashe GS, Coakley J, Mannheimer PD. Forehead pulse oximetry headband use helps alleviate false low readings likely related to venous pulsation artifact. Anesthesiology. 2006;105(6):1111–1116. | |
Berkenbosch JW, Tobias JD. Comparison of a new forehead reflectance pulse oximeter sensor with a conventional digit sensor in pediatric patients. Respir Care. 2006;51(7):726–731. | |
Schallom L, Sona C, McSweeney M, Mazuski J. Comparison of forehead and digit oximetry in surgical/trauma patients at risk for decreased peripheral perfusion. Heart Lung. 2007;36(3):188–194. | |
Fernandez M, Burns K, Calhoun B, Saramma G, Martin B, Weaver C. Evaluation of a new pulse oximeter sensor. Am J Crit Care. 2007;16(2):146–152. | |
Hodgson CL, Tuxen DV, Holland AE, Keating JL. Comparison of forehead Max-Fast pulse oximetry sensor with finger sensor at high positive end-expiratory pressure in adult patients with acute respiratory distress syndrome. Anaesth Intensive Care. 2009;37(6):953–960. | |
Kyriacou PA, Powell S, Langford RM, Jones DP. Esophageal pulse oximetry utilizing reflectance photoplethysmography. IEEE Trans Biomed Eng. 2002;49(11):1360–1368. | |
Chen G, Zhu Z, Liu J, Wei W. Esophageal pulse oximetry is more accurate and detects hypoxemia earlier than conventional pulse oximetry during general anesthesia. Front Med. 2012;6(4):406–410. | |
Brimacombe J, Keller C. Successful pharyngeal pulse oximetry in low perfusion states. Can J Anaesth. 2000;47(9):907–909. | |
Brimacombe J, Keller C, Margreiter J. A pilot study of left tracheal pulse oximetry. Anesth Analg. 2000;91(4):1003–1006. | |
Hynson JM, Sessler DI, Belani K, et al. Thermoregulatory vasoconstriction during propofol/nitrous oxide anesthesia in humans: threshold and oxyhemoglobin saturation. Anesth Analg. 1992;75(6):947–952. | |
Schramm WM, Bartunek A, Gilly H. Effect of local limb temperature on pulse oximetry and the plethysmographic pulse wave. Int J Clin Monit Comput. 1997;14(1):17–22. | |
Talke P, Stapelfeldt C. Effect of peripheral vasoconstriction on pulse oximetry. J Clin Monit Comput. 2006;20(5):305–309. | |
Reddy KA, George B, Mohan NN, Kumar VJ. A novel calibration-free method of measurement of oxygen saturation in arterial blood. IEEE Instrum Meas Mag. 2009;58(5):1699–1705. | |
Franceschini MA, Gratton E, Fantini S. Noninvasive optical method of measuring tissue and arterial saturation: an application to absolute pulse oximetry of the brain. Opt Lett. 1999;24(12):829–831. | |
Nitzan M, Babchenko A, Khanokh B, Taitelbaum H. The measurement of oxygen saturation in venous blood by dynamic near infrared spectroscopy. J Biomed Optics. 2000;5(2):155–162. | |
Zijlstra WG, Buursma A, Meeuwsen-van der Roest WP. Absorption spectra of human fetal and adult oxyhemoglobin, de-oxyhemoglobin, carboxyhemoglobin, and methemoglobin. Clin Chem. 1991;37(9):1633–1638. | |
Cope M. The Application of Near Infrared Spectroscopy to Non Invasive Monitoring of Cerebral Oxygenation in the Newborn Infant [doctoral thesis]. London: University College London; 1991. | |
Prahl SA. Tabulated molar extinction coefficient for hemoglobin in water. 1998. Available from: http://omlc.ogi.edu/spectra/hemoglobin/summary.html. Accessed May 26, 2014. | |
Kim JG, Liu H. Variation of haemoglobin extinction coefficients can cause errors in the determination of haemoglobin concentration measured by near-infrared spectroscopy. Phys Med Biol. 2007;52(20):6295–6322. | |
Nitzan M, Noach S, Tobal E, et al. Calibration-free pulse oximetry based on two wavelengths in the infrared – a preliminary study. Sensors. 2014;14(4):7420–7434. | |
Townshend J, Taylor BJ, Galland B, Williams S. Comparison of new generation motion-resistant pulse oximeters. J Paediatr Child Health. 2006;42(6):359–365. | |
Wijshoff RW, Mischi M, Woerlee PH, Aarts RM. Improving pulse oximetry accuracy by removing motion artifacts from photoplethysmograms using relative sensor motion: a preliminary study. Adv Exp Med Biol. 2013;789:411–417. | |
Cannesson M, Talke P. Recent advances in pulse oximetry. F1000 Med Rep. 2009;1(pii):66. | |
Walton ZD, Kyriacou PA, Silverman DG, Shelley KH. Measuring venous oxygenation using the photoplethysmograph waveform. J Clin Monit Comput. 2010;24(4):295–303. | |
Thiele RH, Tucker-Schwartz JM, Lu Y, Gillies GT, Durieux ME. Transcutaneous regional venous oximetry: a feasibility study. Anesth Analg. 2011;112(6):1353–1357. | |
Delpy DT, Cope M. Quantification in tissue near-infrared spectroscopy. Philos Trans R Soc Lond B Biol Sci. 1997;352(1354):649–659. | |
Wolf M, Ferrari M, Quaresima V. Progress of near-infrared spectroscopy and topography for brain and muscle clinical applications. J Biomed Opt. 2007;12(6):062104. | |
Sorensen LC, Greisen G. Precision of measurement of cerebral tissue oxygenation index using near-infrared spectroscopy in preterm neonates. J Biomed Opt. 2006;11(5):054005. | |
De Blasi RA, Ferrari M, Natali A, Conti G, Mega A, Gasparetto A. Noninvasive measurement of forearm blood flow and oxygen consumption by near-infrared spectroscopy. J Appl Physiol. 1994;76(3):1388–1393. | |
Wardle SP, Yoxall CW, Weindling AM. Peripheral oxygenation in hypotensive preterm babies. Pediatr Res. 1999;45(3):343–349. | |
Yoxall CW, Weindling AM, Dawani NH, Peart I. Measurement of cerebral venous oxyhemoglobin saturation in children by near-infrared spectroscopy and partial jugular venous occlusion. Pediatr Res. 1995;38(3):319–323. | |
Elwell CE, Matcher SJ, Tyszczuk L, Meek JH, Delpy DT. Measurement of cerebral venous saturation in adults using near infrared spectroscopy. Adv Exp Med Biol. 1997;411:453–460. | |
Franceschini MA, Boas DA, Zourabian A, et al. Near-infrared spiroximetry: noninvasive measurements of venous saturation in piglets and human subjects. J Appl Physiol. 2002;92(1):372–384. | |
Menssen J, Colier W, Hopman J, Liem D, de Korte C. A method to calculate arterial and venous saturation from near infrared spectroscopy (NIRS). Adv Exp Med Biol. 2009;645:135–140. | |
Wolf M, Duc G, Keel M, Niederer P. Continuous noninvasive measurement of cerebral arterial and venous oxygen saturation at the bedside in mechanically ventilated neonates. Crit Care Med. 1997;25(9):1579–1582. |
 © 2014 The Author(s). This work is published and licensed by Dove Medical Press Limited. The
full terms of this license are available at https://www.dovepress.com/terms
and incorporate the Creative Commons Attribution
- Non Commercial (unported, 3.0) License.
By accessing the work you hereby accept the Terms. Non-commercial uses of the work are permitted
without any further permission from Dove Medical Press Limited, provided the work is properly
attributed. For permission for commercial use of this work, please see paragraphs 4.2 and 5 of our Terms.
© 2014 The Author(s). This work is published and licensed by Dove Medical Press Limited. The
full terms of this license are available at https://www.dovepress.com/terms
and incorporate the Creative Commons Attribution
- Non Commercial (unported, 3.0) License.
By accessing the work you hereby accept the Terms. Non-commercial uses of the work are permitted
without any further permission from Dove Medical Press Limited, provided the work is properly
attributed. For permission for commercial use of this work, please see paragraphs 4.2 and 5 of our Terms.