Back to Journals » Journal of Pain Research » Volume 10
Psychometric properties revised reinforcement sensitivity theory (r-RST) scale in chronic pain patients
Authors Amiri S ![]() , Behnezhad S, Azad-Marzabadi E
, Behnezhad S, Azad-Marzabadi E
Received 11 January 2017
Accepted for publication 21 March 2017
Published 8 August 2017 Volume 2017:10 Pages 1879—1885
DOI https://doi.org/10.2147/JPR.S132133
Checked for plagiarism Yes
Review by Single anonymous peer review
Peer reviewer comments 2
Editor who approved publication: Professor E Alfonso Romero-Sandoval
Sohrab Amiri,1 Sepideh Behnezhad,2 Esfandiar Azad-Marzabadi3
1Faculty of Literature and Humanities, Urmia University, Urmia, Iran; 2Faculty of Psychology and Educational Sciences, Kharazmi University, Tehran, Iran; 3Baqiyatallah University of Medical Sciences, Behavioral Sciences Research Center, Tehran, Iran
Objective: The aim of present study was to evaluate the psychometric properties of the Reinforcement Sensitivity Questionnaire (RSQ) in patients with chronic pain.
Methods: For this purpose, 312 (first study) and 70 (second study) patients with chronic pain were selected, and the Reinforcement Sensitivity Theory Personality Questionnaire (RST-PQ) and Pain Beliefs and Perceptions Inventory (PBPI) were distributed among them for their response. The reliability of the questionnaire was evaluated by Cronbach’s alpha, retest, and split-half coefficient; then, the criterion validity with other questionnaires was evaluated to determine the psychometric properties of the RSQ. The factor structure was assessed via confirmatory factor analysis.
Results: The results of the factor analysis indicated that the RSQ has five factors, and checking the validity by using Cronbach’s alpha, retest, and split-half coefficient reflected the stability of the scale; the criterion validity of the RSQ with other questionnaires showed desirable discriminant and convergent validity.
Conclusion: Overall, the findings indicated that the RSQ has good psychometric properties in chronic pain samples, and the tool can be used in studies of chronic pain. It seems that the RSQ is a good predictor for pain in patients with chronic pain.
Keywords: chronic pain, factor analysis, reinforcement sensitivity
Introduction
Pain has a significant impact on psychological functioning, and chronic pain is associated with various psychological damages.1,2 Pain often hinders progress toward goals.3 Some individuals reduce their physical activities in an effort to relieve pain. On the other hand, pain reduces the quality of life.4 For effective treatment of patients who are suffering from pain, it is essential to understand the processes that underlie the impact of pain on their lives. In this regard, various models have been established in recent years that include approach and avoidance behavior systems.5 These systems affect different aspects of behavior, cognition, emotion, personality, and so on.
Various reactions that can be seen in individuals with chronic pain are associated with the behavioral activation system (BAS) and behavioral inhibition system (BIS). Pain is an unpleasant experience, and this model states that pain is associated with activation of the BIS. Thus, if an individual is suffering from pain and participates in activities that lead to increased pain, then taking part in these activities excite and activate the BIS. This BIS activation would then facilitate negative cognitive processes (eg, catastrophizing) and negative mood. Consistent with this, studies have shown the inhibitory effects of pain6 and its positive correlations with negative cognitive processes7 and anxiety.8
Another system of this model is the fight–flight system (FFS) or fight–flight–freeze system (FFFS; of Gray and McNaughton).9 This system is not included in two-factor models because emotions and behaviors that are associated with these systems are not experienced routinely by most of people. That means the fight–flight–freeze system is not involved in most people’s daily functioning. However, in individuals with chronic pain, the FFFS may play a very important role.10
The revised Reinforcement Sensitivity Theory (RST)11 was developed on the basis of the findings about the role of certain brain regions in emotional reactions, and by postulating important environmental factors as the triggers of emotional reactions. The RST postulates three systems: BAS, BIS, and FFS. In the revised model, the third system is FFFS. The BIS/BAS scales12 and Sensitivity to Punishment and Reward13 are the most frequently used scales of the original RST. “The Jackson-5” includes five systems proposed in the revised RST (r-RST).14 Although r-RST measures have indisputable merits, it is debatable whether they fully comply with the revised RST theory. Reinforcement Sensitivity Theory Personality Questionnaire (RST-PQ) has an elaborated BAS scale; however, there are no separate flight and freeze components.15 The Jackson-5 questionnaire14 more closely resembles the r-RST. However, some of its scales do not capture the content which is implied by the r-RST – the content of the BIS scale refers to the competitive tendencies rather than to perception of conflict. In addition to that, the Jackson-5 BIS scale correlates modestly with measures of similar constructs.14 The BIS/BAS scale is also being used as a measure of r-RST.16 For this purpose, BIS scale has been split into measures of BIS and Fear.16
The Reinforcement Sensitivity Questionnaire (RSQ)17 has been created recently, based on criteria for item construction. These criteria are in accordance with the hypotheses of r-RST,11 as well as the results of other studies in this area.18–21 In contrast with other r-RST scales, the RSQ does not contain facets. Therefore, the RSQ comprises all five scales, each covering a single system (BIS, BAS, Fight, Flight, and Freeze). On the other hand, accurate evaluation of the behavioral activation and the inhibition system is essential for therapeutic and research goals. Although the BIS/BAS scale12 has been used in the personality and psychopathology,22–24 the measure was not specifically developed to assess BIS/BAS in chronic pain. Accordingly, this study is seeking to investigate the psychometric properties of the reinforcement sensitivity questionnaire in individuals with chronic pain.
Methods
Ethical provisions
All procedures performed in studies involving human participants were in accordance with the ethical standards of the institutional and/or national research committee and with the 1964 Helsinki Declaration and its later amendments or comparable ethical standards. The institutional review board of Baqiyatallah University approved this study. Written informed consent was obtained from all individual participants included in the study.
Participants and procedure
The participants were 312 (first study) and 70 (second study) patients with peripheral neuropathy. Duration of pain in patients were between 12 and 18 months since the onset of pain. Thus, research data were collected from the chronic pain samples with pain in these centers during 3 months. Of the total participants, 286 had a high school diploma degree or lower (74.9%), 54 were undergraduates (14/2%), and 42 held master degrees or higher (10.9%) educational qualifications. Descriptive and demographic characteristics of the participants are presented in Table 1.
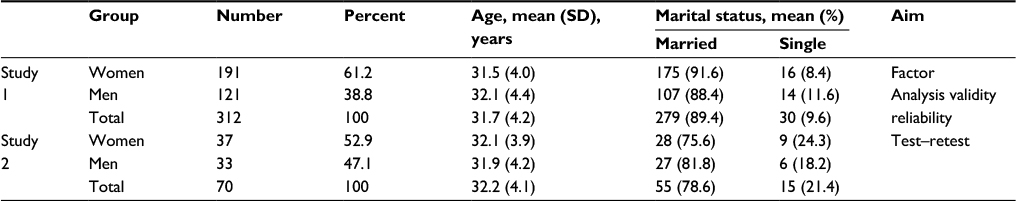 | Table 1 Descriptive and demographic characteristics of research participants |
In order to collect data, the researcher met with the participants and provided the necessary explanations before distributing the RSQ,17 RST-PQ,15 Sensitivity to Punishment and Reward Sensitivity questionnaire (SPSRQ),13 Survey of Pain Attitudes-Revised (SOPA-R),25 and Pain Beliefs and Perceptions Inventory (PBPI)26 among them.
Measures
Reinforcement Sensitivity Questionnaire
The RSQ contains 29 questions, which were formulated according to the assumptions of the r-RST. The response format was a 4-point Likert. The final 29 questions were selected from a set of 60 items according to three criteria: reduction of the intercorrelation between scales, item content (items had to be indicators of a single r-RST dimension, with the least possible overlap with other dimensions), and the number of questions in scales (scales had to contain similar numbers of questions).17
Reinforcement Sensitivity Theory Personality Questionnaire
The first version of the RST-PQ15 was used in this study. The questionnaire comprises 84 questions which assess the following dimensions: reward interest, goal–drive persistence, reward reactivity, and impulsivity, for assessment of the BAS, FFFS, BIS, and panic. The response format is a 4-point Likert scale, with the categories named “Not at all”, “Slightly”, “Moderately”, and “Highly”.
Sensitivity to Punishment and Reward
The SPSRQ is the first attempt to measure the RST.27 Studies have shown the good psychometric properties of the SPSRQ.13 Factor analysis showed that these two scales are orthogonal. They are associated with other personality variables – Sensitivity to Punishment (SP) with neuroticism and Sensitivity to Reward (SR) with extraversion. The SPSRQ has been used in RST studies, although its limitations include: 1) a lack of FFFS/fear and BIS/anxiety and 2) a lack of sub-components and scales for the BAS.28
Survey of Pain Attitudes (Revised)
The SOPA-R is a 35-item questionnaire with response ranges in a 5-point Likert scale.25 Attitudes may include the following: 1) there is a medical cure for pain; 2) one can control pain; 3) others should assist people in pain; 4) one is disabled because of the pain; 5) medication is the best treatment; and 6) pain is influenced by emotional states.
Pain Beliefs and Perceptions Inventory (PBPI)
This scale measures the pain belief items.26 A 4-point Likert scale was used in which the items were scored from −2 to +2, which indicates strong agreement. The beliefs were measured by three scales: 1) pain is an enduring part of life; 2) pain is mysterious; and 3) pain is caused by the patient.
Data analytic strategy
SPSS version 22 (SPSS IBM, New York) and LISREL software29 were used to perform statistical analyses. Bivariate correlations, Cronbach’s alpha, split-half, and test–retest coefficients and confirmatory factor analysis were assessed to examine the convergent validity, internal consistency, and factor structure of the RSQ.
Results
Factor analysis
In order to investigate the fit of the five-factor structure of the RSQ (Smederevac et al),17 in patients with chronic pain, confirmatory factor analysis by maximum likelihood method and LISREL software were used.29 The diagram of the path of the conformity factor analysis, with path’s coefficients, is shown in Figure 1 and the T index is presented in Table 2.
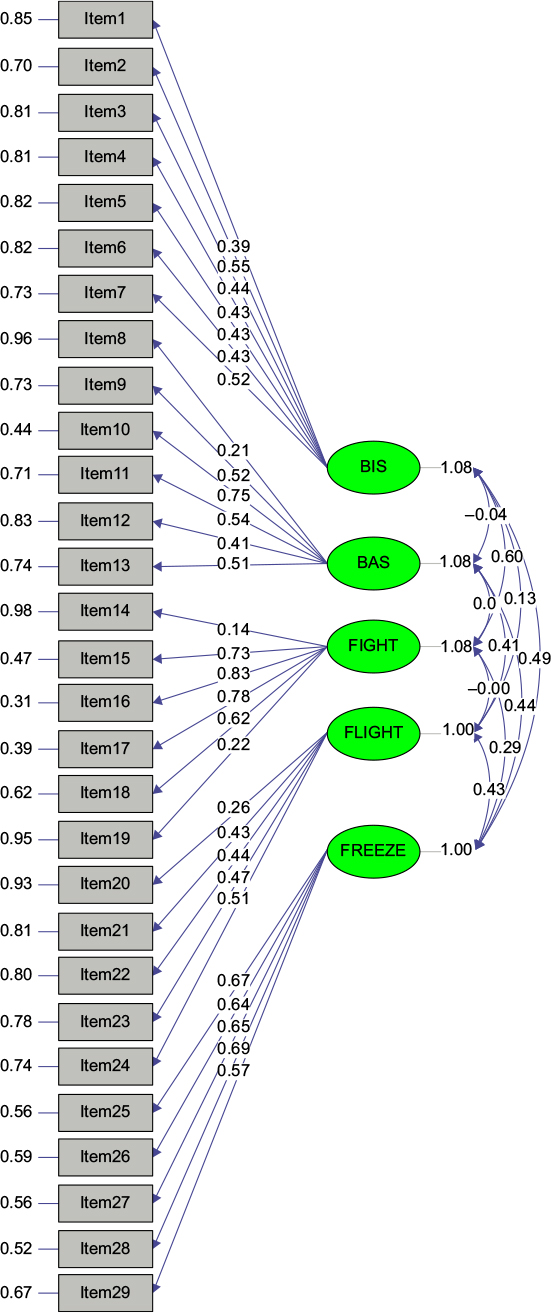 | Figure 1 Diagram of the confirmatory factor analysis and the path’s coefficients for the Reinforcement Sensitivity Questionnaire. |
 | Table 2 Subscales, material and T index of the Reinforcement Sensitivity Questionnaire model Abbreviations: BAS, behavioral activation system; BIS, behavioral inhibition system. |
The confirmatory factor analysis, using LISREL software, offered three levels of fit indices:30,31 1) absolute fit indices such as a chi-square index and Standardized Root Mean Square Residual (SRMR), 2) parsimony goodness-of-fit index such as a Root Mean Square Error of Approximation (RMSEA), and 3) the Comparative Fit Index (CFI). There is controversy over the precise cut-off scores of fit indices.30–34 Moreover, the scores of the Normed Fit Index (NFI), Relative Fit Index (RFI), and Goodness of Fit Index (GFI) are closer to 1, the more they indicate the pattern’s more desired fit. In the present study, the most valid fit scores have been used in order to assess the model’s fit. An SRMR<0.08 shows a desired fit, SRMR<0.10 indicates an acceptable fit, and the model is failed when SRMR is >0.10.33 The index with an RMSEA≤0.8 shows the model is good and, when the RMSEA is between 0.10 and 0.08, the model is acceptable. Eventually, a CFI≥0.95 states the good fit of the model.33 As the χ2 statistic is sensitive to the sample size, to assess the overall fit of the model, the χ2 is calculated along with the degree of freedom (χ2/df). Thus, χ2/df<2 represents the model’s good fit and when χ2/df is approximately 3, the model is acceptable. The value of χ2/df was 3.03, which approximates to 3; therefore, the model’s fit is acceptable. In addition to this, the SRMR of 0.09 showed that the 5-factor model’s fit is acceptable, and the fit indices of CFI 0.95, NFI 0.89, RFI 0.95, adjusted goodness of fit index (AGFI) 0.90, and RMSEA 0.10 represent the model’s acceptable fit.
Validity and reliability
To investigate the reliability of the RSQ, Cronbach’s alpha, split-half, and test–retest coefficients were calculated. The 29-question scale’s Cronbach’s coefficient was 0.78, which showed that the scale has good internal coordination. Moreover, the split-half coefficient indicated the high reliability of the scale and its subscale. A total of 70 participants answered the questionnaire again in 4-week time to calculate the retest coefficient, and the correlation coefficients of the obtained scores was calculated after both tests were conducted. The results of the Cronbach’s alpha, the split-half, and test–retest coefficients are presented in Table 3.
 | Table 3 Mean, standard deviation, and alpha and test–retest coefficients of the Reinforcement Sensitivity Questionnaire Abbreviations: BAS, behavioral activation system; BIS, behavioral inhibition system. |
Table 3 shows that Cronbach’s alpha coefficients were satisfactory and the data of all the test–retest and split-half’s coefficients were significant. Therefore, it can be concluded that the RSQ has the desirable internal consistency in patients with chronic pain.
For the RSQ,17 validity in chronic patients was examined through two ways: the criterion validity (conducted simultaneously with the RST-PQ,15 SPSRQ,13 SOPA-R,25 and PBPI),26 and the correlation between subscales. The results are shown in Table 4.
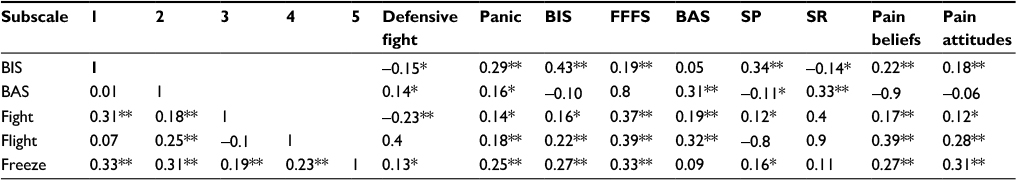 | Table 4 Correlation coefficients between the subscales of Reinforcement Sensitivity Questionnaire with other tools Note: **P<0.01, *P<0.05. Abbreviations: SR, Sensitivity to Reward; SP, Sensitivity to Punishment; BAS, behavioral activation system; FFFS, fight–flight–freeze system; BIS, behavioral inhibition system. |
The pattern of correlation coefficients between the subscales in Table 4 shows there is a suitable internal consistency between the subscales. The pattern of correlation coefficients between the subscales with RST-PQ,15 SPSRQ,13 SOPA-R,25 and PBPI26 indicates the concurrent criterion validity of RSQ17 in patients with chronic pain.
Conclusion
The r-RST of personality is widely known to personality researchers. However, less attention has been paid to the r-RST. Therefore, the present study was done to evaluate and validate r-RST scales in clinical samples and other groups, especially in patients with chronic pain.
The RSQ’s factor analysis showed that the 5-factor solution has a good fit. This finding is consistent with the studies that examine the RSQ scale’s factor structure.17 The findings also indicated that the 5-factor in BIS, BAS, and FFFS has a desirable internal reliability. Studying the RSQ’s factor structure and patterns of factor loadings by using confirmatory factor analysis generated similar results to what Smederevac et al17 obtained by the 5-factor solution. All the factor loadings were >0.4. However, the factor loadings and factor structure in this study were lower than that in the study by Smederevac et al.17
We investigated the RSQ scale’s reliability using alpha coefficients, test–retest coefficients, and split-half, which showed the scale had appropriate reliability. The alpha coefficients of BIS, BAS, Fight, Flight, and Freeze subscales were, respectively, 0.65, 0.64, 0.74, 0.70, and 0.78, and the amplitude of coefficients of test–retest and split-half suggested the RSQ’s suitable reliability to measure the BIS, BAS, Fight, Flight, and Freeze in a chronic pain sample. The findings are consistent with the study of Smederevac et al17 who designed the original RSQ. Although similar to the results of factor loadings, Cronbach’s alpha coefficients results in the chronic pain samples were weaker and lower than in the original sample. However, the results indicate acceptable internal consistency. Perhaps, with some changes in the questionnaire, as shown by the results of factor analysis, a better questionnaire can be developed for other samples.
Evaluation of the validity of the RSQ with the RST-PQ17 and SPSRQ13 showed a positive correlation between the similar subscales of the RSQ, specifically with the subscales of RST-PQ15 and SPSRQ13 which were significantly correlated with the last subscale. The RSQ showed a positive correlation with the SOPA-R25 and PBPI,26 and this correlation was significant; this shows the RSQ can be predictive for pain attitudes and pain beliefs and perception. This result demonstrated the divergent validity of the RSQ.
The RSQ’s psychometric properties in the present study were respectively consistent with the studies done in the original version.17 According to reports, the lack of a concise, yet valid and useful, tool to assess the revised reinforcement sensitivity theory is a weakness of the RST. As a result, it seems that, regardless of language and culture, and considering the pattern of factor loadings which was similar to previous studies,17 the RSQ scale is a useful tool in measuring the fundamental structures that are related to the r-RST. However, it seems that careful consideration should be given to its reliability in normal samples. Overall, the psychometric properties of the RSQ are applicable broadly and have the capacity to measure r-RST; it can be used in patients with either clinically relevant or normal levels.
In total, the reliability and validity analysis and confirmatory analysis demonstrated the desirable psychometric characteristics of the RSQ, and the present study’s findings are consistent with that of the original versions.17 The RSQ in chronic pain samples showed that it is a valid tool for assessing r-RST. The calculated indices to evaluate the fit of the RSQ’s model suggested that SRMR, RMSEA, and (χ2/df) indices, as the most valid fit indices,30–34 support the model’s fit. This result is consistent with the original version of RSQ.17 Therefore, according to earlier reports, the present study was conducted among chronic pain samples and, because it did not cover all of the pain groups, the results should be treated with caution when generalizing to other pain populations. Moreover, it is suggested that future studies examine the RSQ’s validity by using other psychological methods and clinical groups, especially in acute pain and other clinical groups. The results of the present study indicate that the RSQ has acceptable validity and reliability in chronic pain samples. In addition, the questionnaire’s factor structure was compliant with the designers’ theory and the confirmatory factor analysis’ using 5-factor evaluation was consistent with the original version of the RSQ.
Disclosure
The authors report no conflicts of interest in this work.
References
Goesling J, Clauw DJ, Hassett AL. Pain and depression: an integrative review of neurobiological and psychological factors. Curr Psychiatry Rep. 2013;15:421. | ||
Jordan KD, Okifuji A. Anxiety disorders: differential diagnosis and their relationship to chronic pain. J Pain Palliat Care Pharmacother. 2011;25(3):231–245. | ||
Dow CM, Roche PA, Ziebland S. Talk of frustration in the narratives of people with chronic pain. Chronic Illn. 2012;8(3):176–191. | ||
Institute of Medicine (US) Committee on Advancing Pain Research, Care, and Education. Relieving Pain in America: A Blueprint for Transforming Prevention, Care, Education, and Research. Washington, DC: National Academies Press (US); 2011. | ||
Harmon-Jones E. Contributions from research on anger and cognitive dissonance to understanding the motivational functions of asymmetrical frontal brain activity. Biol Psychol. 2004;67(1–2):51–76. | ||
Eccleston C, Crombez G. Pain demands attention: a cognitive-affective model of the interruptive function of pain. Psychol Bull. 1999;125(3):356–366. | ||
Sullivan MJ, Thorn B, Haythornthwaite JA, et al. Theoretical perspectives on the relation between catastrophizing and pain. Clin J Pain. 2001;17(1):52–64. | ||
Lucchetti G, Oliveira AB, Mercante JP, Peres MF. Anxiety and fear-avoidance in musculoskeletal pain. Curr Pain Headache Rep. 2012;16(5):399–406. | ||
Gray JA, McNaughton N. The Neuropsychology of Anxiety: An Enquiry into the Functions of the Septo-Hippocampal System. 2nd ed. Oxford: Oxford University Press; 2003. | ||
Boothby JL, Thorn BE, Stroud MW, Jensen, MP. Coping with pain. In: Turk DC, Gatchel RJ, editors. Psychosocial Factors in Pain. New York, NY: Gilford Press; 1999. | ||
Gray JA, McNaughton N. The Neuropsychology of Anxiety: An Enquiry into the Functions of the Septo-Hippocampal System. 2nd ed. Oxford: Oxford University Press; 2000. | ||
Carver CS, White TL. Behavioral inhibition, behavioral activation, and affective responses to impending reward and punishment: The BIS/BAS Scales. J Pers Soc Psychol. 1994;67(2):319–333. | ||
Torrubia R, Ávila C, Moltó J, Caseras X. The sensitivity to punishment and sensitivity to reward questionnaire (SPSRQ) as a measure Gray’s anxiety and impulsivity dimensions. Pers Individ Dif. 2001;31(6):837–862. | ||
Jackson CJ. Jackson-5 scales of revised Reinforcement Sensitivity Theory (r-RST) and their application to dysfunctional real world outcomes. J Res Pers. 2009;43(4):556–569. | ||
Corr PJ, Cooper A. The Reinforcement Sensitivity Theory Personality Questionnaire (RST – PQ). Available from: http://www.philipcorr.net/uploads/downloads/276.pdf. | ||
Heym N, Ferguson E, Lawrence C. An evaluation of the relationship between Gray’s revised RST and Eysenck’s PEN: distinguishing BIS and FFFS in Carver and White’s BIS/BAS scales. Pers Individ Dif. 2008;45(8):709–715. | ||
Smederevac S, Mitrović D, Čolović P, Nikolašević Ž. Validation of the measure of revised reinforcement sensitivity theory constructs. J Individ Differ. 2014;35(1):12–21. | ||
Corr PJ. Reinforcement sensitivity theory and personality. Neurosci Biobehav Rev. 2004;28(3):317–332. | ||
Quilty LC, Oakman JM. The assessment of behavioural activation – the relationship between positive emotionality and the behavioural activation system. Eur J Pers. 2004;18(7):557–571. | ||
Smillie LD, Jackson CJ, Dalgleish LI. Conceptual distinctions among Carver and White’s (1994) BAS scales: a reward-reactivity versus trait impulsivity perspective. Pers Individ Dif. 2006;40(5):1039–1050. | ||
Smillie LD, Pickering AD, Jackson CJ. The new reinforcement sensitivity theory: implications for personality measurement. Pers Soc Psychol Rev. 2006;10(4):320–335. | ||
Atkinson J, Sharp C, Schmitz J, Yaroslavsky I. Behavioral activation and inhibition, negative affect, and gambling severity in a sample of young adult college students. J Gambl Stud. 2012;28(3):437–449. | ||
Gomez R, Cooper A, Gomez A. Susceptibility to positive and negative mood states: test of Eysenck’s, Gray’s, and Newman’s theories. Pers Individ Dif. 2000;29(2):351–365. | ||
Hamilton KR, Sinha R, Potenza MN. Hazardous drinking and dimensions of impulsivity, behavioral approach, and inhibition in adult men and women. Alcohol Clin Exp Res. 2012;36(6):958–966. | ||
Jensen MP, Karoly P. Notes on the Survey of Pain Attitudes (SOPA): original (24-item) and revised (35-item) versions (unpublished manuscript). Tempe, AZ: Arizona State University; 1987. | ||
Williams DA, Thorn BE. An empirical assessment of pain beliefs. Pain. 1989;36(3):351–358. | ||
Torrubia R, Tobeña A. A scale for the assessment of ‘susceptibility to punishment’ as a measure of anxiety: preliminary results. Pers Individ Dif. 1984;5(3):371–375. | ||
Corr PJ. Reinforcement sensitivity theory (RST): Introduction. In: Corr PJ, editor. The Reinforcement Sensitivity Theory of Personality. Cambridge: Cambridge University Press; 2008:1–43. | ||
Jöreskog KG, Sörbom D. LISREL 8.80 for Windows [Computer Software]. Lincolnwood, IL: Scientific Software International, Inc; 2006. | ||
Brown TA. Confirmatory Factor Analysis for Applied Research. New York: Guilford Press; 2006. | ||
Schermelleh-Engel K, Moosbrugger H, Müller H. Evaluating the fit of structural equation models: tests of significance and descriptive goodness of fit measures. Psychol Res. 2003;8:23–74. | ||
Hair JF, Black WC, Babin BJ, Anderson RE. Multivariate Data Analysis. 7th ed. Upper Saddle River, NJ: Pearson Prentice Hall; 2009. | ||
Hu LT, Bentler PM. Cutoff criteria for fit indexes in covariance structure analysis: conventional criteria versus new alternatives. Struct Equ Modeling. 1999;6(1):1–55. | ||
Tabachnick BG, Fidell LS. Using Multivariate Statistics. 5th ed. Boston, MA: Pearson; 2007. |
 © 2017 The Author(s). This work is published and licensed by Dove Medical Press Limited. The
full terms of this license are available at https://www.dovepress.com/terms
and incorporate the Creative Commons Attribution
- Non Commercial (unported, 3.0) License.
By accessing the work you hereby accept the Terms. Non-commercial uses of the work are permitted
without any further permission from Dove Medical Press Limited, provided the work is properly
attributed. For permission for commercial use of this work, please see paragraphs 4.2 and 5 of our Terms.
© 2017 The Author(s). This work is published and licensed by Dove Medical Press Limited. The
full terms of this license are available at https://www.dovepress.com/terms
and incorporate the Creative Commons Attribution
- Non Commercial (unported, 3.0) License.
By accessing the work you hereby accept the Terms. Non-commercial uses of the work are permitted
without any further permission from Dove Medical Press Limited, provided the work is properly
attributed. For permission for commercial use of this work, please see paragraphs 4.2 and 5 of our Terms.