Back to Journals » Psychology Research and Behavior Management » Volume 12
Psychometric properties of the Brief Symptom Inventory in nomophobic subjects: insights from preliminary confirmatory factor, exploratory factor, and clustering analyses in a sample of healthy Italian volunteers
Authors Adawi M ![]() , Zerbetto R, Re TS, Bisharat B
, Zerbetto R, Re TS, Bisharat B ![]() , Mahamid M, Amital H, Del Puente G
, Mahamid M, Amital H, Del Puente G ![]() , Bragazzi NL
, Bragazzi NL
Received 7 May 2018
Accepted for publication 19 November 2018
Published 12 March 2019 Volume 2019:12 Pages 145—154
DOI https://doi.org/10.2147/PRBM.S173282
Checked for plagiarism Yes
Review by Single anonymous peer review
Peer reviewer comments 2
Editor who approved publication: Dr Igor Elman
Mohammad Adawi,1 Riccardo Zerbetto,2 Tania Simona Re,2,3 Bishara Bisharat,4,5 Mahmud Mahamid,4 Howard Amital,6,7 Giovanni Del Puente,8 Nicola Luigi Bragazzi2,3,8,9
1Bar-Ilan Faculty of Medicine, Padeh and Ziv Hospitals, Zafat, Israel; 2GESTALT Study Center (CSTG), Milan, Italy; 3UNESCO Chair “Health Anthropology, Biosphere and Healing Systems”, University of Genoa, Genoa, Italy; 4EMMS Nazareth Hospital, Nazareth, Azrieli Faculty of Medicine, Bar-Ilan University, Safed, Israel; 5The Society for Health Promotion of the Arab Community, The Max Stern Yezreel Valley College, Nazareth, Israel; 6Sackler Faculty of Medicine, Tel Aviv University, Tel Aviv, Israel; 7Zabludowicz Center for Autoimmune Diseases, Department of Medicine B, Sheba Medical Center, Tel HaShomer, Israel; 8DINOGMI, Section of Psychiatry, University of Genoa, Genoa, Italy; 9Department of Health Sciences, Postgraduate School of Public Health, University of Genoa, Genoa, Italy
Background: The Brief Symptom Inventory (BSI), developed by Derogatis in 1975, represents an important standardized screening instrument that enables one to quantitatively assess psychological distress and psychiatric disorders. The BSI is a 53-item self-report scale, measuring nine dimensions that can be summed up to reflect three global indices, including the General Severity Index (GSI). In the era of new information and communication technologies, nomophobia (“no mobile phobia”) is an emerging disorder, characterized by the fear of being out of mobile phone contact. Nothing is known, however, about the factor structure and reliability of the BSI in a population of nomophobic subjects. This study aimed at addressing this gap in knowledge.
Methods: A sample of 403 subjects aged 27.91±8.63 years (160 males, 39.7% of the entire sample, and 243 females, 60.3%), recruited via snowball sampling, volunteered to take part in the study. The Italian versions of the Nomophobia questionnaire and the BSI were administered. Exploratory factor analyses, confirmatory factor analyses, and clustering analysis were carried out together with correlation analysis, analysis of variance, and multivariate regression analysis.
Results: For each BSI subscale, scores were significantly higher than the norms. The nine subscales exhibited acceptable-to-good Cronbach’s alpha coefficients, varying from 0.733 for psychoticism to 0.875 for depression. Overall, the reliability of the entire instrument proved to be excellent (alpha coefficient=0.972). Furthermore, all BSI subscales as well as BSI synthetic indexes correlated with nomophobia in a significant way. Stratifying the population according to the severity of nomophobia (mild, 206 individuals, 51.1% of the sample; moderate, 167 subjects, 41.4%; and severe, 30 individuals, 7.4%), the GSI score could distinguish (P<0.001) between mild and moderate (0.99±0.71 vs 1.32±0.81) and between mild and severe (0.99±0.71 vs 1.54±0.79) nomophobia, although not between moderate and severe nomophobia (P>0.05). Similar patterns could be found for the other subscales of the BSI. Finally, looking at the fit indexes, the second-order 9-factor model best fit the data compared with the Derogatis 1-factor model.
Conclusion: The findings of our study show that the BSI is a reliable and valid instrument with acceptable psychometric properties, and can be administered to populations of nomophobic subjects.
Keywords: nomophobia, Brief Symptom Inventory, psychometric properties, questionnaire, confirmatory factor analysis
Introduction
For researchers in the field of psychopathology, the Brief Symptom Inventory (BSI), developed by Derogatis in 1975, represents an important, standardized screening instrument that enables one to quantitatively assess psychological distress and psychiatric disorders.1–5
The BSI has been used in a variety of settings, either with adolescents or adults, and, consequently, its psychometric properties have been widely investigated and appraised. The original factor structure has been intentionally designed and developed for adults and adolescents with a range of psychiatric disorders, even though the instrument has also been subsequently tested among cancer patients or individuals suffering from other chronic-degenerative disorders, among others.6,7
In the era of new information and communication technologies characterized by widespread and pervasive use of smart phones and mobile devices,8 nomophobia (“no mobile phobia”) is an emerging psychological concern and disorder.9–11 Nomophobia can be defined as the irrational fear, stress, or worry of being out of mobile phone contact, that is to say being without one’s own device or being unable to use it due to the absence of a signal or low network coverage, running out of minutes, battery power, or credit, or for some other reasons.
Some studies have investigated the relationship between psychopathological symptoms and technological addictions. For instance, in a sample of 126 university students, Adalier and Balkan12 found a significant correlation between Internet addiction and psychopathological symptoms like somatization, obsession–compulsion, interpersonal sensitivity, depression, anxiety, hostility, phobic anxiety, paranoid ideation, and psychoticism. In a sample of 334 subjects, Wegmann et al13 studied the effects of depression and social anxiety on addictive use of social networking sites and found that they were mediated by Internet use expectancies and self-regulation. Similar findings were reported by Stavropoulos et al,14 who documented a statistically significant association between anxiety levels and Internet addiction among adolescents.
Nothing is known, however, about the factor structure, validity, and reliability of the BSI in a population of nomophobic subjects. This study aimed at addressing this gap in knowledge. On the basis of the previously mentioned studies,12–14 we hypothesized to find a statistically significant association between nomophobic use of smart phones and psychopathological symptoms as measured by the BSI.
Materials and methods
Population
Our sample size well exceeded the minimum number of 300 subjects suggested by Tabachnick and Fidell15 as a general rule of thumb for properly performing factor analysis. For this cross-sectional study, participants (mainly, undergraduate students and younger subjects) were recruited via an online survey using a snowball approach. Further details concerning the population recruited can be found in our previous publication.11 Briefly, a sample of 403 subjects aged 27.91±8.63 years (160 males, 39.7% of the entire sample, and 243 females, 60.3%) volunteered to take part in the study. In detail, 45 subjects spent <1 hour on their mobile phone per day (11.2%), 94 spent between 1 and 2 hours (23.3%), 69 spent between 2 and 3 hours (17.1%), 58 spent between 3 and 4 hours (14.4%), 48 spent between 4 and 5 hours (11.9%), 29 spent between 5 and 7 hours (7.2%), 36 spent between 7 and 9 hours (8.9%), and, finally, 24 spent >10 hours (6.0%).
Instruments
Brief Symptom Inventory
The BSI is a 53-item self-report scale designed to evaluate psychopathological and psychological symptoms, measuring nine dimensions (namely, somatization, obsession–compulsion, interpersonal sensitivity, depression, anxiety, hostility, phobic anxiety, paranoid ideation, and psychoticism) that can be summed up to reflect three global indices. These synthetic indices are the General Severity Index (GSI), the Positive Symptom Distress Index, and the Positive Symptom Total. In more detail, the BSI uses a 5-point Likert scale, ranging from 0 (“not at all”) to 4 (“extremely”). The BSI has sound psychometric properties: in the original administration of the questionnaire, internal consistency coefficients ranged from 0.71 to 0.85.
Nomophobia questionnaire
Besides the Italian validated version of the BSI, the Italian version of the Nomophobia questionnaire (NMP-Q), translated from the instrument originally developed by Yildirim and Correia,10 was administered. Exploratory factor analysis (EFA) has previously demonstrated good psychometric properties of the instrument (Cronbach’s alpha coefficient of 0.95, 0.94, 0.89, and 0.88 for the overall questionnaire and for its three factors – factor 1, not being able to access information; factor 2, giving up convenience/losing connectedness; and factor 3, not being able to communicate – respectively). Furthermore, validity of the questionnaire was confirmed by conducting regression analysis with the number of hours spent on the mobile phone as the regressor.11 The Italian version was found to have a 3-factor structure, as opposed to the initial version of Yildirim and Correia,10 and to the translated and validated versions in Spanish16 and in Persian.17
For the purpose of administration, Google Forms, an open-source tool for developing and administering ad hoc online questionnaires/surveys, was utilized. Due to the snowball sampling procedure, we were not able to compute the responder rate. There were no missing items to deal with, and, as such, no imputation analysis was necessary.
Based on the NMP-Q score, the nomophobic level was categorized as “mild nomophobia” (scores in the range 21–59), “moderate nomophobia” (scores in the range 66–99), or “severe nomophobia” (scores ≥100).
Data analysis strategy
Once the data were collected, before commencing any data handling and processing, they were visually inspected for potential outliers. Normality of data distribution was checked by performing the D’Agostino–Pearson omnibus test. Then, some descriptive analyzes were carried out with the aim to provide information about the general characteristics of the study groups in terms of reported scores. Finally, Cronbach’s alpha coefficients were calculated as estimates of reliability/internal consistency of the instrument. The following rule of thumb was utilized: the coefficient was judged unacceptable if <0.5, poor in the range 0.5–0.6, questionable in the range 0.6–0.7, acceptable in the range 0.7–0.8, good in the range 0.8–0.9, and, finally, deemed excellent if >0.9.
Correlation analysis was performed between the NMP-Q and BSI scores. The magnitude of the Pearson’s coefficient was interpreted following the rule of thumb developed by Hinkle et al:18 the strength of the correlation was deemed negligible if the r coefficient ranged from 0.00 to 0.30, low from 0.30 to 0.50, moderate from 0.50 to 0.70, high from 0.70 to 0.90, and very high from 0.90 to 1.00. Multivariate regression analyses were performed to shed light on the predictors of the overall GSI score and each BSI subscale score. Furthermore, analysis of variance was conducted for the GSI score and each BSI subscale score based on the nomophobic levels.
For all analyses, data with P<0.05 were considered statistically significant.
The commercial software Statistical Package for Social Sciences (SPSS for Windows, version 24.0, released 2017; IBM Corp., Armonk, NY, USA) was used for carrying out these statistical analyses. Graphs were obtained using the commercial MedCalc Statistical Software version 17.9.7 (2017; MedCalc Software bvba, Ostend, Belgium; http://www.medcalc.org).
Clustering analysis
Clustering analysis, based on the nomophobic levels, was conducted with the commercial software SPSS. It was carried out in two subsequent steps, hierarchical and k-means clustering techniques, in order to find the optimal number of clusters.
Exploratory factor analysis
At first, EFA was performed in order to investigate the factor structure of the BSI questionnaire. The Kaiser–Meyer–Olkin measure was computed to assess the sampling adequacy. Ideally, the Kaiser–Meyer–Olkin should be >0.60. The likely number of factors was determined by: 1) the number of factors with eigenvalues >1; and 2) a visual inspection of Cattell’s scree plot. After checking the factor loadings, items were deleted in cases of unsatisfactory loading (ie, values <0.45) or loading conflicting with a sound theoretical explanation. Different principal component analyses with varimax rotation runs were, therefore, carried out iteratively until a satisfactory, clearly interpretable solution was finally achieved. Cases of cross-loading were interpreted according to salience and overall explained variance, with theoretical considerations also being taken into account (ie, loadings not conflicting with a sound preestablished theoretical framework).
EFA was conducted utilizing the commercial SPSS software.
Confirmatory factor analysis
Confirmatory factor analysis (CFA) was carried out using the open-source software Jamovi (version 0.0.03) and the commercial EQS software (version 6.3 for Windows; Multivariate Inc., Temple City, CA, USA). Differently from EFA, CFA enables researchers to quantitatively assess how well an a priori, theoretically specified factor model explains the observed pattern of correlations or covariances.
Goodness of fit indices
As suggested and recommended by many scholars, a wide range of fit indices was calculated and reported, namely discrepancy indices (including the chi-squared test and the Steiger–Lind root mean square error of approximation [RMSEA]), tests comparing the target model with the null model (like the Tucker–Lewis Index [TLI] and Bentler’s Comparative Fit Index [CFI]), and information theory goodness of fit measures (like the Akaike Information Criterion [AIC] and the Schwarz’s Bayesian criterion, known also as Bayesian Information Criterion [BIC]).
Furthermore, the standardized root mean square residual was computed following the recommendation of Jöreskog and Sörbom.40
Cutoff and threshold values
The P-value associated with the chi-squared test should exceed 0.05 (ie, it should not be statistically significant). Further, the value of chi-squared divided by the degrees of freedom should ideally be <2.0. As far as the RMSEA is concerned, MacCallum et al in 199619 and Steiger in 200020 have suggested using 0.01, 0.05, and 0.08 as threshold values to indicate excellent, good, and mediocre fit, respectively. In general, according to Steiger,20 values higher than 0.10 indicate poor fitting models. Hu and Bentler in 199521 recommended a value of RMSEA <0.06.
The TLI should be above 0.95 according to Hu and Bentler.21 The CFI should exceed 0.95 according to Bentler22 and to Hu and Bentler,21 or 0.90 according to other scholars. Acceptable values of the CFI are in the range 0.80–0.90, whereas values <0.80 are unacceptable.
Finally, acceptable values of the AIC and the BIC should ideally be close to 0.
Ethical clearance
All procedures described in the article and performed in the study were carried out in accordance with the ethical standards of the institutional research committee, and with the 1964 Helsinki Declaration and its subsequent amendments. The study protocol was approved by the ethical committee of the University of Genoa and the UNESCO Chair. Every participant gave written informed consent after being thoroughly advised about the study’s aims and procedures.
Results
Scores as the mean and SD for each subscale of the BSI are reported in Table 1: they ranged from 0.856±0.7986 for interpersonal sensitivity to 1.244±0.7936 for anxiety. In all cases, scores were significantly higher than the norms for adult nonpatients (P<0.001), indicating that the BSI is potentially able to distinguish between a non-nomophobic individual and one suffering from nomophobia.
 | Table 1 Scores obtained as mean and SD for each subscale of the Brief Symptom Inventory (BSI) Note: Scores have been compared with norms for adult nonpatients. |
The nine subscales exhibited acceptable-to-good Cronbach’s alpha coefficients (as can be seen in Table 2), varying from 0.733 for psychoticism to 0.875 for depression. All coefficients were good except for phobic anxiety and psychoticism (0.783 and 0.733, respectively), which were acceptable. Overall, the reliability of the entire instrument was excellent (alpha coefficient=0.972). Correlations among the BSI subscales were statistically significant (Table 3), ranging from r=0.568 (P<0.0001) for the relationship between hostility and phobic anxiety to r=0.810 (P<0.0001) between interpersonal sensitivity and paranoid ideation. Furthermore, all BSI subscales as well as the BSI synthetic indexes correlated with the NMP-Q in a statistically significant way (Table 4). Correlation coefficients ranged from r=0.115 (P=0.0208) to r=0.372 (P<0.0001) for the relationship between phobic anxiety and factor 1 (not being able to access information) and between the GSI score and factor 2 (giving up convenience/losing connectedness) of the NMP-Q, respectively.
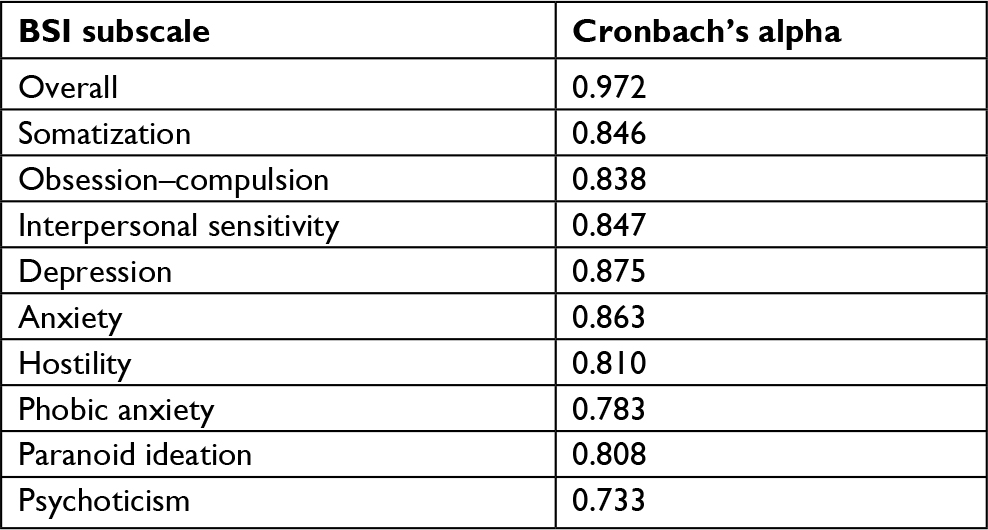 | Table 2 Reliability statistics for the Brief Symptom Inventory (BSI) among nomophobic subjects |
 | Table 3 Correlation analysis among the subscales of the Brief Symptom Inventory |
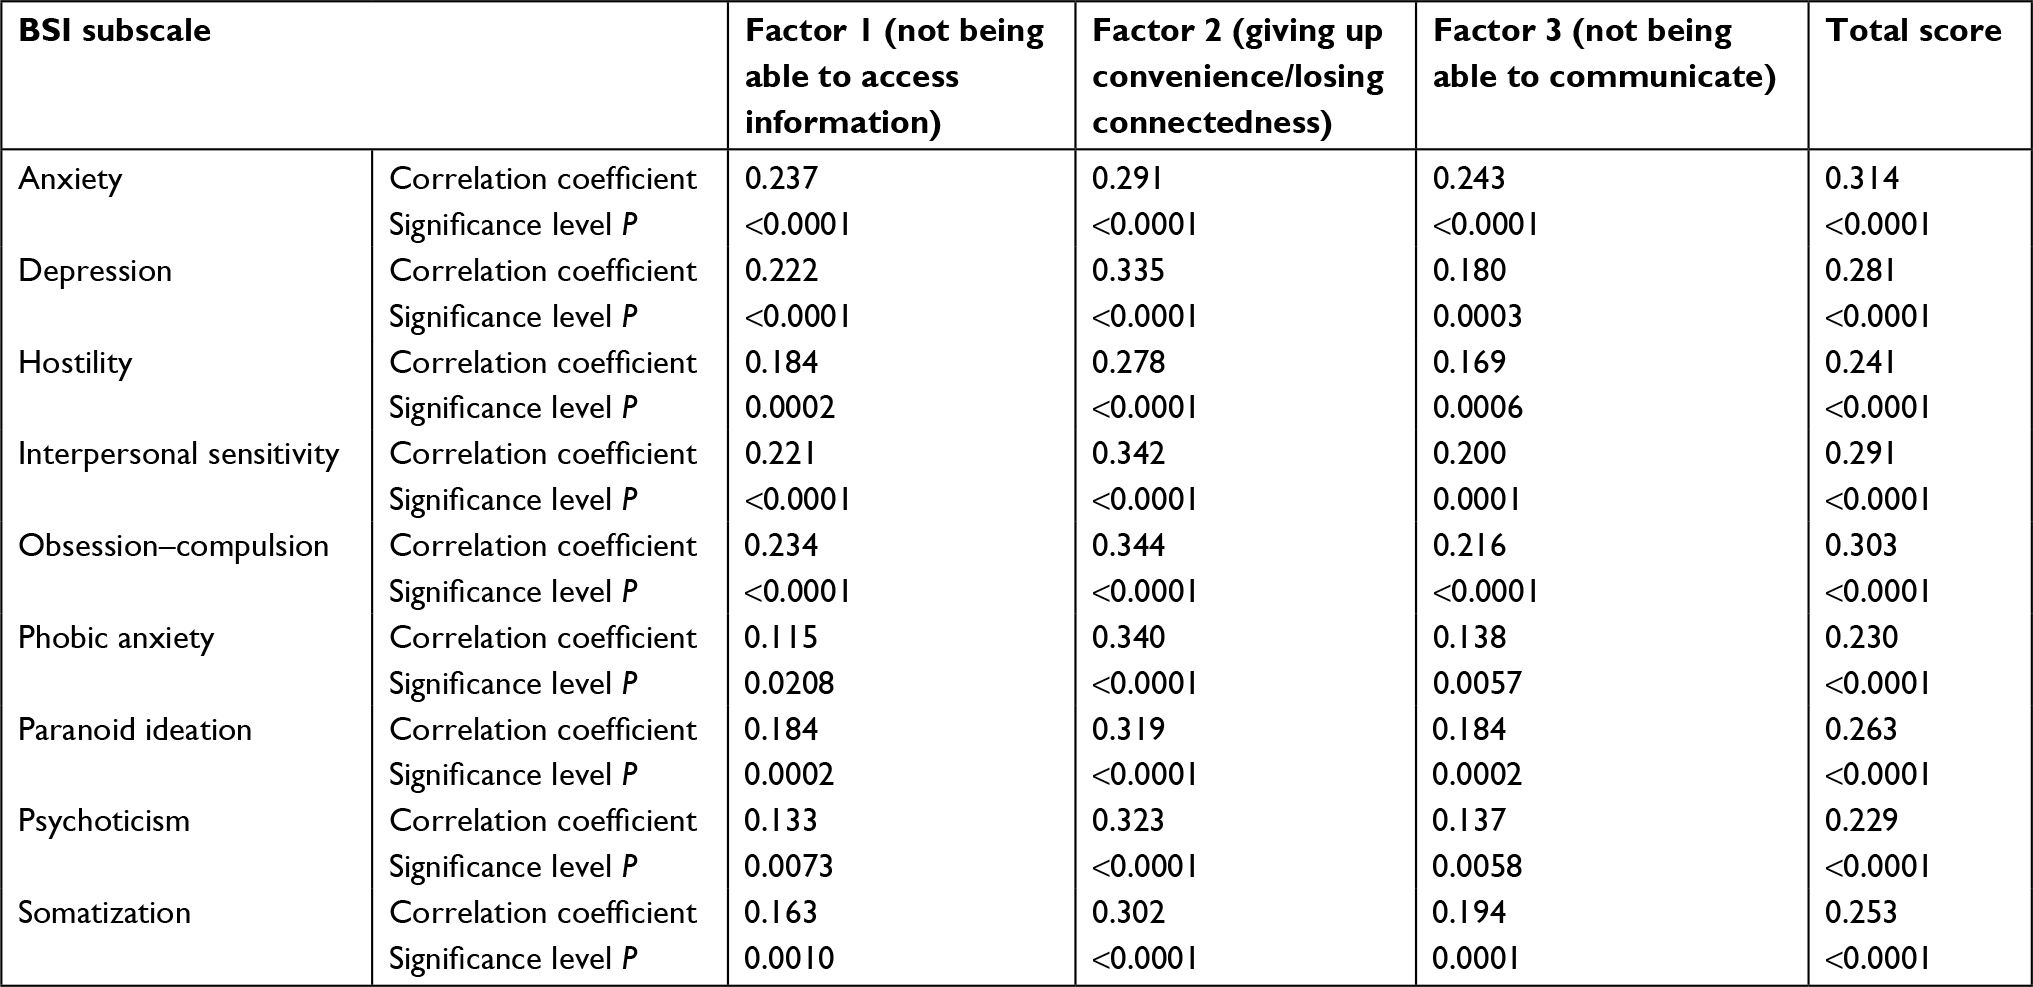 | Table 4 Correlation analysis between the Brief Symptom Inventory (BSI) and the Nomophobia questionnaire |
In multivariate regression analysis, the factor 2 score (regression coefficient=0.02877, standard error=0.005494, rpartial=0.2548, t=5.236, P<0.0001), the number of hours spent on the mobile device (regression coefficient=0.05288, standard error=0.02092, rpartial=0.1262, t=2.528, P=0.0119), and the schooling level (regression coefficient=−0.09865, standard error=0.04485, rpartial=−0.1100, t=−2.200, P=0.0284) were statistically significant predictors of the GSI score. For further details, the reader is referred to Table 5. Table 6 reports the predictors for each subscale of the BSI.
 | Table 5 Multivariate regression analysis for the Global Severity Index of the Brief Symptom Inventory |
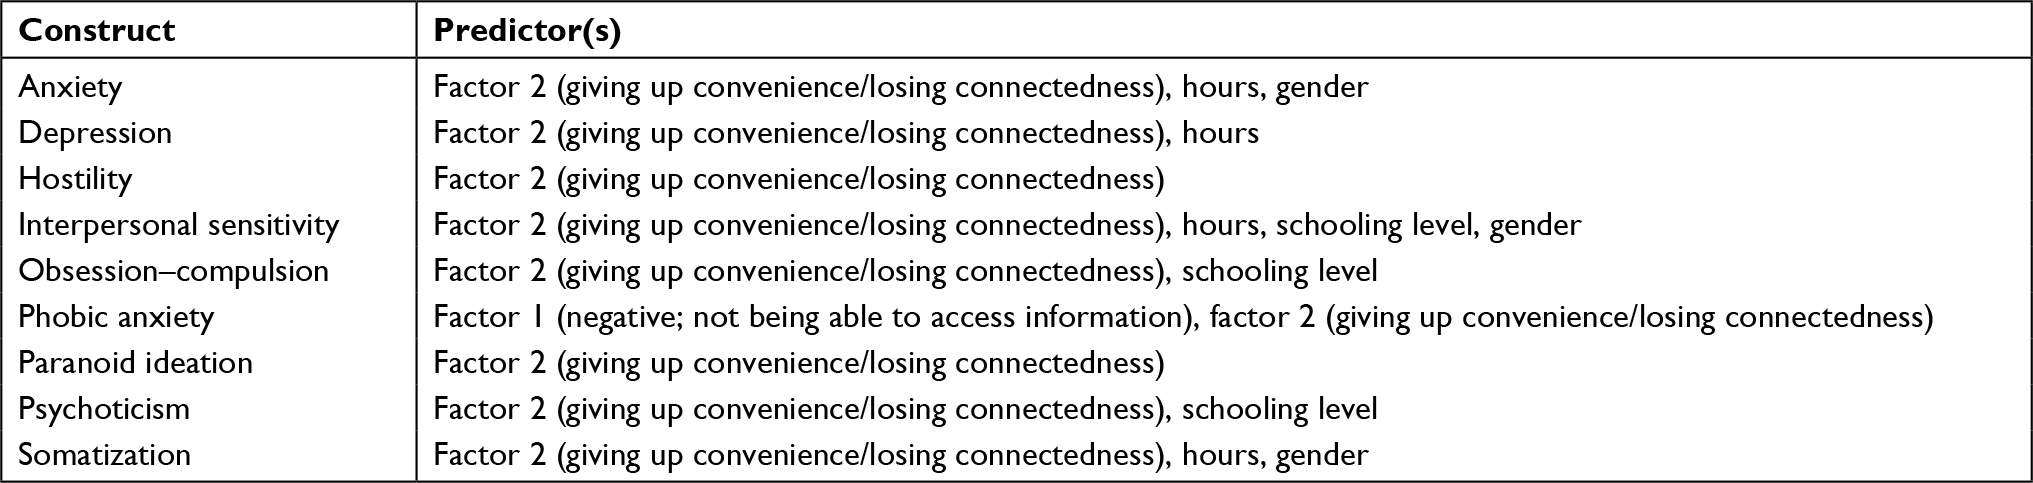 | Table 6 Predictors for each subscale of the Brief Symptom Inventory |
Stratifying the population according to the severity of nomophobia (mild, 206 individuals, 51.1% of the sample; moderate, 167 subjects, 41.4%; and severe, 30 individuals, 7.4%), the GSI score could distinguish (P<0.001) between mild and moderate (0.99±0.71 vs 1.32±0.81) and between mild and severe (0.99±0.71 vs 1.54±0.79) nomophobia levels, although it could not differentiate between moderate and severe nomophobia levels (P>0.05; Figure 1). Similar patterns could be found for the other subscales of the BSI. These findings were also confirmed by the clustering analysis (Tables 7 and 8), which found two major clusters (162 subjects belonging to the first cluster and 241 individuals to the second). These two clusters approximately coincided with the groups of severe and moderate nomophobia levels (197 subjects) and the group of mild nomophobia level (207 individuals), respectively: 22.029 was the final distance between the two cluster centers.
 | Figure 1 General Severity Index (GSI) broken down according to the severity of nomophobia. |
 | Table 7 The two clusters with their centers for each Brief Symptom Inventory (BSI) subscale |
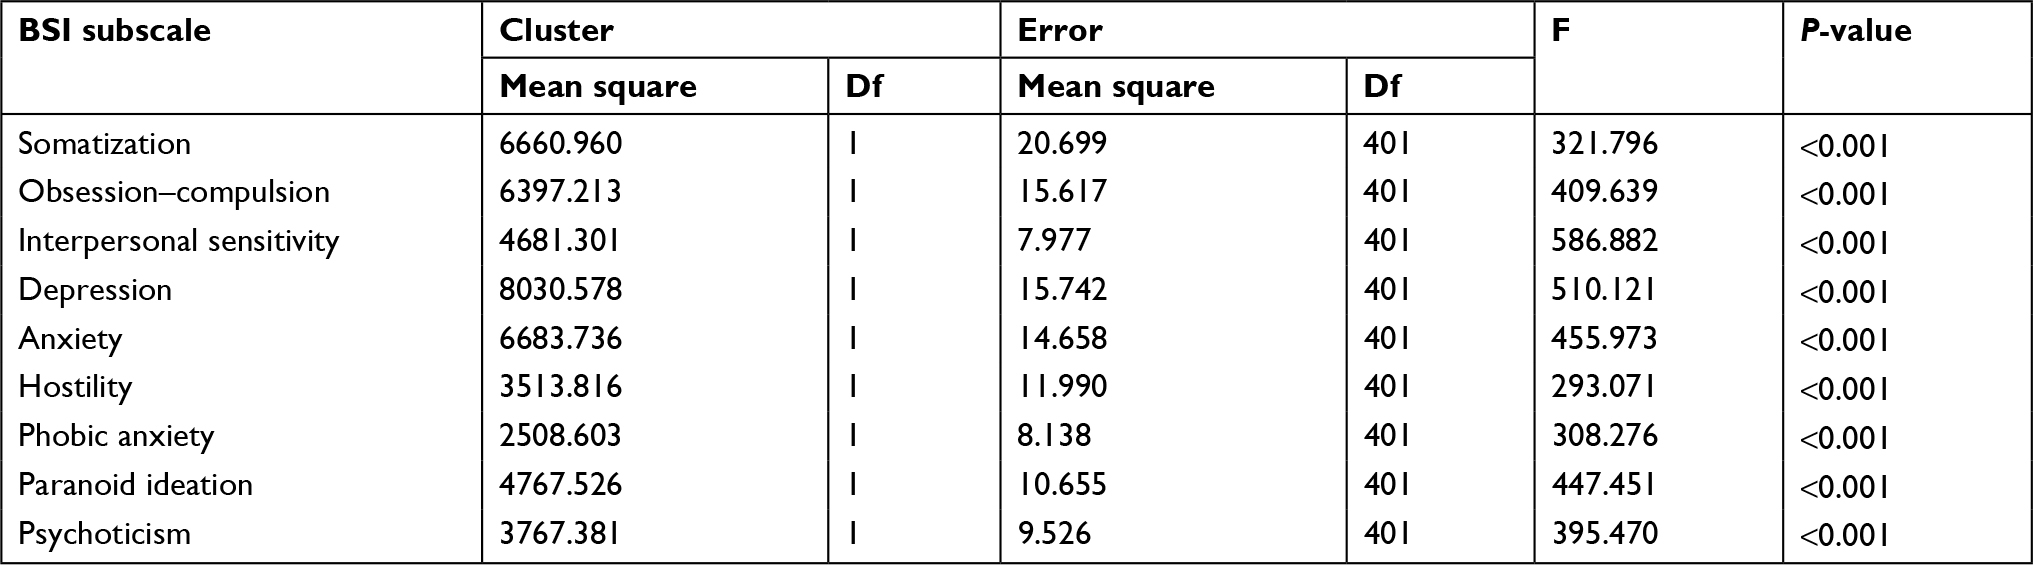 | Table 8 Analysis of variance between the two clusters for each Brief Symptom Inventory (BSI) subscale Abbreviation: Df, degrees of freedom. |
In the EFA, the 9-factor model explained up to 72.84% of the variance. Factor loadings of the different subscales for different factor models (first-order 1-factor and 9-factor models and second-order 9-factor models) are shown in Table 9.
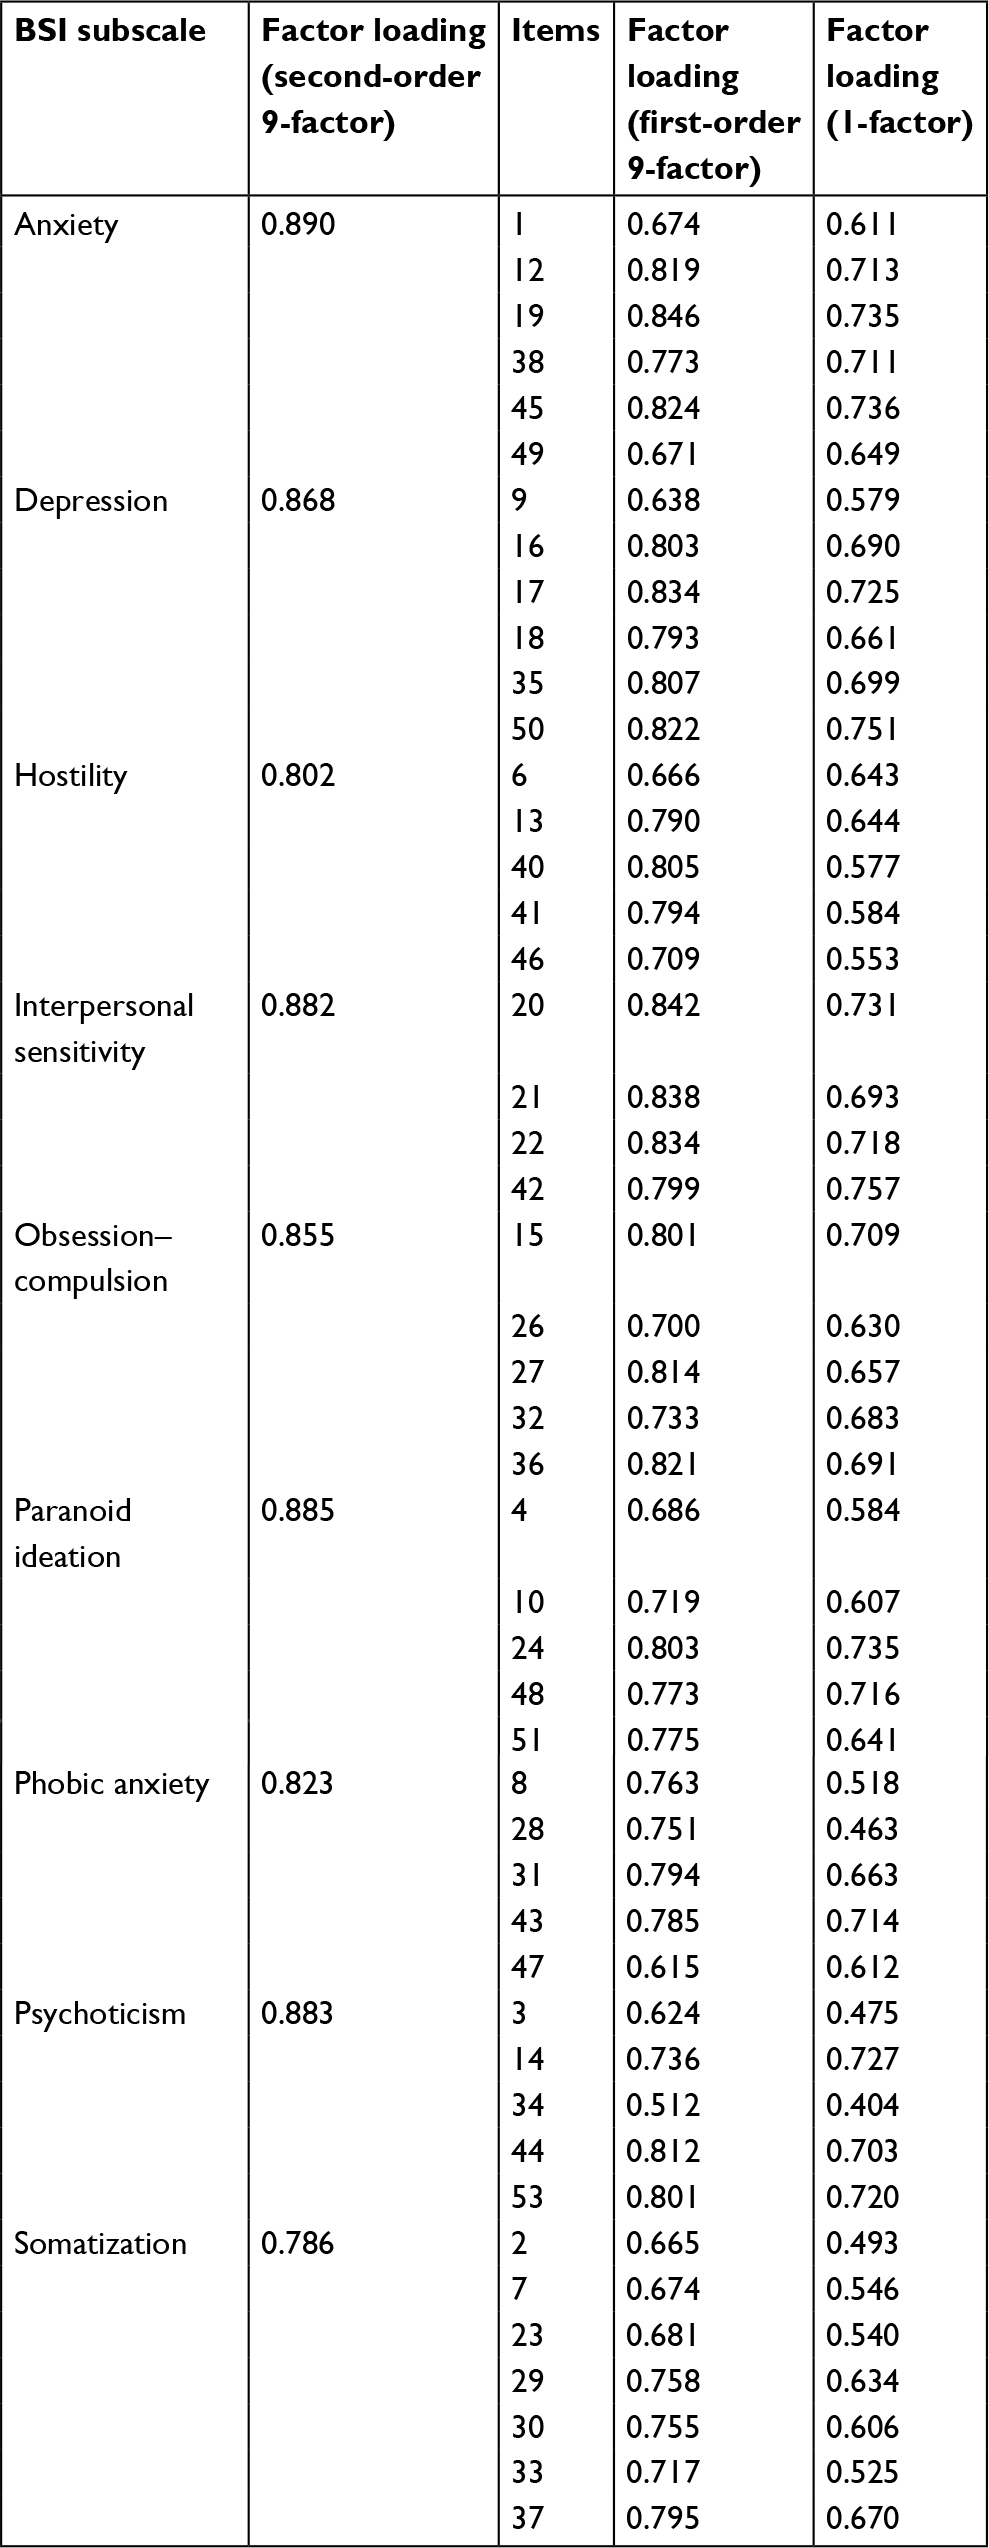 | Table 9 Loading factors of the exploratory factor analysis Abbreviation: BSI, Brief Symptom Inventory |
Finally, CFA confirmed the findings of the EFA. Looking at the fit indexes of the CFA, concerning the first-order factor models, the Derogatis 9-factor model best fit the data compared with the 1-factor model (Table 10). The second-order 9-factor model, however, proved to have a better fit to data. At the subscale level, the following subscales showed the best fit: somatization, obsessive–compulsive, and paranoid ideation.
 | Table 10 Fit indices of the confirmatory factor analysis for the overall Brief Symptom Inventory (BSI) questionnaire and for each subscale Abbreviations: AIC, Akaike Information Criterion; BIC, Bayesian Information Criterion; CFI, Comparative Fit Index; Df, degrees of freedom; RMSEA, root mean square error of approximation; SRMR, standardized root mean square residual; TLI, Tucker–Lewis Index. |
Discussion
Nomophobia is an emerging technological addiction or phobia. Personality and psychopathological traits/features could be major determinants of this disorder. The BSI could shed light on this topic, even though its reliability and factor model have not been investigated in nomophobic subjects. Moreover, among scholars it has been debated whether the factor structure of the BSI is unidimensional or multidimensional. Our results show that a second-order 9-factor model fits reasonably well with our data and that the BSI is a psychometrically sound instrument able to distinguish between nonclinical individuals and subjects with behavioral addictions/phobias, such as nomophobia, as shown both by the analysis of variance and clustering analyses. Moreover, the BSI scores correlate with the severity of such a disorder, further confirming and corroborating the discriminant validity of the instrument.
In the existing scholarly literature, different factor structure models, including structures comprised of five factors (among bereaved patients),23 six factors (among ethnic groups, either clinical or nonclinical, or among college and university counseling center clients),24,25 eight factors (for instance, in subjects with distress),26,27 and one single factor of general distress (found among patients suffering from epilepsy or adult inpatients with psychiatric disorders),28–30 have been reported.
However, in most cases, these factor structure models are the results of EFA-based instead of CFA-based investigations. Only few studies, indeed, performed CFA.31 Furthermore, some methodological differences among studies could explain the different models obtained, including the study design and the populations recruited. Our results are, instead, methodologically more robust, relying on CFA and not on only EFA. Moreover, we also performed a clustering analysis to further corroborate our findings.
The findings of the present investigation are in line with our working hypothesis and the existing scholarly literature. Being out of mobile phone contact, for example being unable to access a mobile device, can lead to an increase in irritability and anxiety. Subjects with technological addiction indeed make unsuccessful attempts to decrease Internet use and to prevent, or at least mitigate, its negative impact on social, work, and/or academic life, as shown in a sample of 255 university students.32 Somatization is one of the markers of anxiety: it can be defined as a psychological distress arising from the perception of bodily dysfunction with a strong autonomic component. It is characterized by pain and discomfort, involving different systems, including the cardiovascular, gastrointestinal, respiratory, and muscular systems, among others. A correlation between somatization and Internet use has been found by some scholars.33,34 Depressive symptoms reflect a dysphoric mood, characterized by loss of interest in daily activities and by a deep feeling of hopelessness and despair. Some studies have found a correlation between depression and Internet use: together with low self-esteem, self-efficacy, and life satisfaction, it is clinically associated with higher levels of technological addiction.35,36
Furthermore, other symptoms have been correlated with Internet use, such as obsessive–compulsive symptoms, arising when some thoughts and/or behaviors occur so intrusively as to be perceived as unremitting and irresistible; interpersonal sensitivity, which is represented by feelings of personal inadequacy and inferiority, with scarce social life and interactions; or hostility, characterized by feelings of irritability, urges to break or smash things, and uncontrollable outbursts of temper. Also phobic anxiety, which reflects phobic fears and worries, and psychoticism have been associated with technological addiction.34–37
We found that paranoid ideation, which refers to a peculiar mode of thinking dominated by projection, suspiciousness, persecutory and conspiracy beliefs, and fear of loss of control, was associated with nomophobia. Also, this finding is in line with the literature.38
Summarizing, according to Taylor et al,39 who make use of cognitive-behavioral models and social-skills theory, there is a strong relationship between depression and time spent using the Internet, whereas more mixed findings are reported for social anxiety. Loneliness and hostility were also found to correlate with Internet use. We have extended these results to an emerging disorder, nomophobia.
On the other hand, despite its novelty, the present study is not without limitations. The major shortcoming that should be properly recognized is given by the nonrandomized nature of the recruited sample (snowball sampling procedure). Another drawback is represented by the cross-sectional design of the study. High-quality longitudinal studies should be performed in order to capture the dynamic picture of the relationship between nomophobia and psychopathological symptoms.
Conclusion
The findings of our study show that the BSI is a reliable instrument with acceptable psychometric properties that can be administered to populations of nomophobic subjects and, as such, can be exploited by researchers in the field of behavioral addictions and technological phobias. However, based on the abovementioned shortcomings, further research in the field is urgently needed.
Disclosure
The authors report no conflicts of interest in this work.
References
Derogatis LR. Brief Symptom Inventory. Baltimore, MD: Clinical Psychometric Research; 1975. | ||
Derogatis LR, Spencer PM. Administration and Procedures: BSI. Manual I. Baltimore, MD: Clinical Psychometric Research; 1982. | ||
Derogatis LR. The Brief Symptom Inventory (BSI). Administration, Scoring and Procedures Manual II. Baltimore, MD: Clinical Psychometric Research; 1992. | ||
Derogatis LR. Brief Symptom Inventory: Administration, Scoring and Procedures Manual. 4th ed. Minneapolis, MN: NCS, Pearson, Inc; 1993. | ||
Derogatis LR, Melisaratos N. The Brief Symptom Inventory: an introductory report. Psychol Med. 1983;13(3):595–605. | ||
Racine NM, Khu M, Reynolds K, Guilcher GMT, Schulte FSM. Quality of life in pediatric cancer survivors: contributions of parental distress and psychosocial family risk. Curr Oncol. 2018;25(1):41–48. | ||
Barbosa F, Mota C, Patrício P, Alcântara C, Ferreira C, Barbosa A. The relationship between alexithymia and psychological factors in systemic lupus erythematosus. Compr Psychiatry. 2011;52(6):754–762. | ||
Bragazzi NL, Dini G, Toletone A, Brigo F, Durando P. Leveraging big data for exploring occupational diseases-related interest at the level of scientific community, media coverage and novel data streams: the example of silicosis as a pilot study. PLoS One. 2016;11(11):e0166051. | ||
Bragazzi N, del Puente G. A proposal for including nomophobia in the new DSM-V. PRBM. 2014;7:155–160. | ||
Yildirim C, Correia A-P. Exploring the dimensions of nomophobia: development and validation of a self-reported questionnaire. Comput Human Behav. 2015;49:130–137. | ||
Adawi M, Bragazzi NL, Argumosa-Villar L, et al. Translation and validation of the Nomophobia questionnaire in the Italian language: exploratory factor analysis. JMIR Mhealth Uhealth. 2018;6(1):e24. | ||
Adalier A, Balkan E. The relationship between Internet addiction and psychological symptoms. International Journal of Global Education. 2012;1(2):42–49. | ||
Wegmann E, Stodt B, Brand M. Addictive use of social networking sites can be explained by the interaction of Internet use expectancies, Internet literacy, and psychopathological symptoms. J Behav Addict. 2015;4(3):155–162. | ||
Stavropoulos V, Gomez R, Steen E, Beard C, Liew L, Griffiths MD. The longitudinal association between anxiety and Internet addiction in adolescence: the moderating effect of classroom extraversion. J Behav Addict. 2017;6(2):237–247. | ||
Tabachnick BG, Fidell LS. Using Multivariate Statistics. New York: Harper & Row; 1996. | ||
González-Cabrera J, León-Mejía A, Pérez-Sancho C, Calvete E. Adaptation of the Nomophobia questionnaire (NMP-Q) to Spanish in a sample of adolescents. Actas Esp Psiquiatr. 2017;45(4):137–144. | ||
Lin CY, Griffiths MD, Pakpour AH. Psychometric evaluation of Persian Nomophobia questionnaire: differential item functioning and measurement invariance across gender. J Behav Addict. 2018;7(1):100–108. | ||
Hinkle DE, Wiersma W, Jurs SG. Applied Statistics for the Behavioral Sciences. 5th ed. Boston: Houghton Mifflin; 2003. | ||
Maccallum RC, Browne MW, Sugawara HM. Power analysis and determination of sample size for covariance structure modeling. Psychol Methods. 1996;1(2):130–149. | ||
Steiger JH. Point estimation, hypothesis testing, and interval estimation using the RMSEA: some comments and a reply to Hayduk and Glaser. Struct Equ Modeling. 2000;7(2):149–162. | ||
Hu LT, Bentler PM. Evaluating model fit. In: Hoyle RH. editor. Structural Equation Modeling: Concepts, Issues, and Applications. Thousand Oaks, CA: Sage; 1995:76–99. | ||
Bentler PM. Comparative fit indexes in structural models. Psychol Bull. 1990;107(2):238–246. | ||
Johnson LC, Murphy SA, Dimond M. Reliability, construct validity, and subscale norms of the Brief Symptom Inventory when administered to bereaved parents. J Nurs Meas. 1996;4(2):117–127. | ||
Daoud FS, Abojedi AA. Equivalent factorial structure of the Brief Symptom Inventory (BSI) in clinical and nonclinical Jordanian populations. Eur J Psychol Assess. 2010;26(2):116–121. | ||
Hayes JA. What does the Brief Symptom Inventory measure in college and university counseling center clients? J Couns Psychol. 1997;44(4):360–367. | ||
Ruipérez MA, Ibáñez MI, Lorente E, Moro M, Ortet G. Psychometric properties of the Spanish version of the BSI: contributions to the relationship between personality and psychopathology. Eur J Psychol Assess. 2001;3:241–250. | ||
Kellett S, Beail N, Newman DW, Frankish P. Utility of the Brief Symptom Inventory in the assessment of psychological distress. J Appl Res Intellect Disabil. 2003;16(2):127–134. | ||
Endermann M. The Brief Symptom Inventory (BSI) as a screening tool for psychological disorders in patients with epilepsy and mild intellectual disabilities in residential care. Epilepsy Behav. 2005;7(1):85–94. | ||
Piersma HL, Reaume WM, Boes JL. The Brief Symptom Inventory (BSI) as an outcome measure for adult psychiatric inpatients. J Clin Psychol. 1994;50(4):555–563. | ||
Piersma HL, Boes JL, Reaume WM. Unidimensionality of the Brief Symptom Inventory (BSI) in adult and adolescent inpatients. J Pers Assess. 1994;63(2):338–344. | ||
Loutsiou-Ladd A, Panayiotou G, Kokkinos CM. A review of the factorial structure of the Brief Symptom Inventory (BSI): Greek evidence. Int J Test. 2008;8(1):90–110. | ||
Singh K, Brown RJ. Health-related Internet habits and health anxiety in university students. Anxiety Stress Coping. 2014;27(5):542–554. | ||
Alavi SS, Maracy MR, Jannatifard F, Eslami M. The effect of psychiatric symptoms on the Internet addiction disorder in Isfahan’s university students. J Res Med Sci. 2011;16(6):793–800. | ||
Alavi SS, Alaghemandan H, Maracy MR, Jannatifard F, Eslami M, Ferdosi M. Impact of addiction to Internet on a number of psychiatric symptoms in students of isfahan universities, Iran, 2010. Int J Prev Med. 2012;3(2):122–127. | ||
Xiuqin H, Huimin Z, Mengchen L, Jinan W, Ying Z, Ran T. Mental health, personality, and parental rearing styles of adolescents with Internet addiction disorder. Cyberpsychol Behav Soc Netw. 2010;13(4):401–406. | ||
Senormancı O, Saraçlı O, Atasoy N, Senormancı G, Koktürk F, Atik L. Relationship of Internet addiction with cognitive style, personality, and depression in university students. Compr Psychiatry. 2014;55(6):1385–1390. | ||
Lu WH, Lee KH, Ko CH, Hsiao RC, Hu HF, Yen CF. Relationship between borderline personality symptoms and Internet addiction: The mediating effects of mental health problems. J Behav Addict. 2017;6(3):434–441. | ||
Chen Q, Quan X, Lu H, Fei P, Li M. Comparison of the personality and other psychological factors of students with Internet addiction who do and do not have associated social dysfunction. Shanghai Arch Psychiatry. 2015;27(1):36–41. | ||
Taylor S, Pattara-Angkoon S, Sirirat S, Woods D. The theoretical underpinnings of Internet addiction and its association with psychopathology in adolescence. Int J Adolesc Med Health. Epub 2017 Jul 6. | ||
Maiti SS, Mukherjee BN. A note on distributional properties of the Jöreskog–Sörbom fit indices. Psychometrika. 1990;55(4):721–726. |
 © 2019 The Author(s). This work is published and licensed by Dove Medical Press Limited. The
full terms of this license are available at https://www.dovepress.com/terms
and incorporate the Creative Commons Attribution
- Non Commercial (unported, 3.0) License.
By accessing the work you hereby accept the Terms. Non-commercial uses of the work are permitted
without any further permission from Dove Medical Press Limited, provided the work is properly
attributed. For permission for commercial use of this work, please see paragraphs 4.2 and 5 of our Terms.
© 2019 The Author(s). This work is published and licensed by Dove Medical Press Limited. The
full terms of this license are available at https://www.dovepress.com/terms
and incorporate the Creative Commons Attribution
- Non Commercial (unported, 3.0) License.
By accessing the work you hereby accept the Terms. Non-commercial uses of the work are permitted
without any further permission from Dove Medical Press Limited, provided the work is properly
attributed. For permission for commercial use of this work, please see paragraphs 4.2 and 5 of our Terms.