Back to Journals » Hepatic Medicine: Evidence and Research » Volume 12
Prospective Comparison of Transient Elastography Using Two Different Devices: Performance of FibroScan and FibroTouch
Authors Serra JT ![]() , Mueller J
, Mueller J ![]() , Teng H, Elshaarawy O
, Teng H, Elshaarawy O ![]() , Mueller S
, Mueller S ![]()
Received 9 January 2020
Accepted for publication 16 March 2020
Published 27 March 2020 Volume 2020:12 Pages 41—48
DOI https://doi.org/10.2147/HMER.S245455
Checked for plagiarism Yes
Review by Single anonymous peer review
Peer reviewer comments 2
Editor who approved publication: Dr Gerry Lake-Bakaar
Joao Tiago Serra, Johannes Mueller, Haidong Teng, Omar Elshaarawy, Sebastian Mueller
Center for Alcohol Research, University of Heidelberg and Salem Medical Center, Heidelberg, Baden-Württemberg, Germany
Correspondence: Sebastian Mueller
Center for Alcohol Research, Salem Medical Center, University of Heidelberg, Zeppelinstraße 11 – 33, Heidelberg 69121, Germany
Tel +49 6221 483 210
Fax +49 6221 483 494
Email [email protected]
Purpose: Transient elastography (TE) using FibroScan (FS) has been established to non-invasively assess liver fibrosis and steatosis. The aim of this study was to compare the recently introduced FibroTouch (FT) device with the established FS with respect to liver stiffness and CAP.
Patients and Methods: Thirty-nine patients with and without liver disease were included. All patients were measured three times with FS (FibroScan 530 compact, Echosens, France) and FT (FibroTouch-FT100, Wuxi Hisky Med, China). For FS, M and XL probe were used according to the manufacturer’s specifications. For steatosis, CAP and the comparable FT equivalent UAP (ultrasound attenuation parameter) was determined. Finally, FT and FS were explored in liver tissue-mimicking phantoms.
Results: LS between FS and FT correlated well with r=0.91. Root-mean-square (RMS) of the coefficient of variation for LS was better in FS (11.1% vs 27.4%). Bland-Altman analysis showed a 3.1 kPa mean overestimation of LS by FT. In addition, UAP strongly and linearly depended on the BMI following UAP=3.02 × BMI+186. In phantoms, a similar relation was found with UAP (phantom)= 3.78 × BMI + 146 suggesting that UAP is directly calculated from entered BMI instead of assessing shear-wave attenuation. Consequently, RMS-CV was lower for FT (6.0% vs 9.7%). However, if using different BMI, CV-RMS for FT increased to 12.7%. LS of a patient with manifest liver cirrhosis and ascites was 38.8 kPa using the FS-XL probe but almost normal with FT (7.2 kPa).
Conclusion: Although LS by FT shows good correlation with LS-FS, it has larger variation, continuously overestimates LS and completely fails in ascites. Moreover, FT-UAP seems to be a misleading parameter for steatosis assessment because it is at least in part calculated from mandatory entered patient data. In conclusion, novel LS cut-off values need to be defined for LS-FT and usage of UAP is not recommended.
Keywords: fibrosis, cirrhosis, steatosis, transient elastography, liver stiffness, controlled attenuation parameter
Introduction
Since the introduction of transient elastography (TE) in 2003, measurement of liver stiffness (LS) has become the best non-invasive parameter to screen for liver cirrhosis.1–3 This success has been largely due to the fact that a) no extensive training is required, b) TE is non-invasive and rapid and, c) reproducible with a lower sampling error than liver biopsy.4 These promising findings stimulated the search for other competing technologies to assess LS. Such techniques are now available on the market such as acoustic radiation force impulse imaging (ARFI), shear-wave elastography (SWE) and magnetic resonance elastography (MRE) the later holding great promises for three-dimensional assessment of stiffness in various organs not restricted to the liver.5–7 So far, most published biopsy-proven LS studies have been performed with TE (FibroScan®) which was the first technique to be introduced. FibroScan relies on a specific implementation of TE that is referred as Vibration-Controlled Transient Elastography (VCTE™).
In general, LS is an excellent surrogate marker of advanced fibrosis (F3) and cirrhosis (F4) and superior to all serum markers.8 LS highly correlates with histological fibrosis stage independent of the underlying liver disease (r>0.8).4 During fibrosis progression, LS increases continuously from 2 kPa up to 75 kPa (upper detection limit of the FibroScan device). A threshold of 12.5 kPa is widely considered as cut-off value of histological F4 cirrhosis stage although cut-off values are etiology dependent.9 A normal LS (<6 kPa) is considered to exclude liver pathology and liver fibrosis.4 Finally, LS value highly correlates with portal pressure and complications such as esophageal varices and HCC and are likely at LS values >20 kPa.4,10 In addition, LS has been shown to be an excellent short and long-term predictor of survival in various settings ranging from the emergency room up to treatment response in viral hepatitis.11–14 Interestingly, a decrease of LS either during a pharmacological or TIPS intervention seems to predict a favorable outcome.12,15 Longitudinal studies in patients undergoing treatment for chronic hepatitis B and C infection showed that patients were less likely to experience liver-related events if LS had decreased over time.16,17
Apart from the fibrosis-associated elevation of LS, it is now clear that other conditions can also increase and strongly modulate LS irrespective of fibrosis.4 First major confounders of LS elevation encompassed hepatic necroinflammation, congestion and mechanic cholestasis.18–21 Later, more complex clinical conditions such as alcohol and food intake were identified to increase LS.4,22 Although not all subcellular factors associated with LS have been clarified yet, it has been clearly demonstrated that histological features such as fibrosis, ballooning and inflammation are causing LS elevation.23,24 Controversies still continue about the role of fat that has been shown to lower LS in the absence of co-presence of inflammation.23 Although ascites has been initially considered a contraindication for LS measurements, a recent study could show that the XL probe can be used to accurately assess LS despite an ascites lamella of up to 35 mm and, moreover, it facilitates the discrimination between hepatic vs non-hepatic ascites.25
A non-invasive parameter named CAP™ for Controlled Attenuation Parameter has been developed to assess liver steatosis using the FibroScan device.26 CAP is an estimate of the ultrasound attenuation at 3.5 MHz of the liver to overcome most limitations of the steatosis assessment by conventional ultrasound.27,28 In particular, CAP may be suitable for point-of-care diagnostic assessment.27 CAP is recommended by the Asia-Pacific 2017 NAFLD guidelines as accurate alternative to abdominal ultrasonography for the detection of steatosis and by the American association for the study of the liver (AASLD) 2018 guidelines on the diagnosis and management of NAFLD to quantify hepatic fat in an ambulatory setting.29,30 In its latest guidelines on liver ultrasound elastography, the world federation for ultrasound and medicine and biology (WFUMB) has recommended CAP as a point-of-care, standardized and reproducible technique, promising for the detection of liver steatosis.31
Recently, FibroTouch (FT, Wuxi Hisky, China) has been introduced and a first published large study on 435 patients suggests a similar diagnostic performance for both FT and FS.32 FT claims to be based on the same technical principle as TE and also introduces a CAP-pendant steatosis parameter called UAP (Ultrasound Attenuation Parameter). We here directly compare LS and CAP from the established FS platform with the new FT platform both in phantoms and patients to provide first unbiased data on performance, potential differences and point to consider when applying FT in daily clinical practice.
Methods
Transient Elastography
TE was performed by a physician with an experience of more than 100 FibroScan measurements using the FibroScan 530 Compact (Echosens, France) with M and XL probe and the FibroTouch-FT100 (Wuxi Hisky Med, China). Both devices are CE marked (see Figure 1). LS measurements on patients were performed on the right lobe of the liver in intercostal position. All patients received three independent examinations with FS and FT, in the following called measurement series one, two and three. LS measurements with FS were first performed using the M probe. XL probe was used in case of M probe measuring failure according to the established protocols. The probes of both devices consist of an ultrasound transducer mounted on the axis of a vibrator. In contrast to FS, FT measurements are triggered using a footswitch. For every examination, the median and IQR of 10 valid measurements were used. Controlled attenuation parameter (CAP) from FS and the corresponding parameter, Ultrasound attenuation parameter (UAP) of FT, were also measured. Notably, for UAP of FT, height and weight of the patient needs to be entered before the measurement can be started. The first examination was performed using the real BMI of the patient, the second examination was done using BMI of 20 kg/m2 and the third using 40 kg/m2. One patient with ascites was enrolled in the study and successfully measured with M and XL-probe of the FS as reported earlier.25
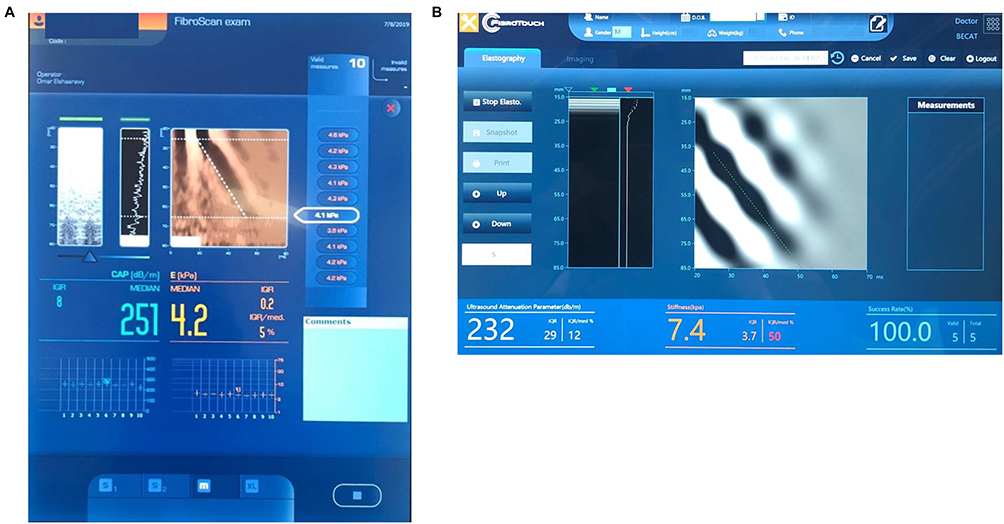 |
Figure 1 Photograph of the user interface with shear-wave propagation maps from the (A) FibroScan and (B) FibroTouch device. |
Liver Phantom Experiments
We first compared FibroScan (FS) and FibroTouch (FT) using liver phantoms (CIRS Inc., USA) mimicking mechanical and ultrasound characteristics of human liver. The probes were fixed using a probe holder and a tripod. Five examinations per phantom and device were performed with each measurement resembling the median of 10 valid measurements. Probes were placed at the same spot on the phantom to avoid variations through inhomogeneities within the phantoms. Since a relationship between UAP and entered BMI was discovered, additional experiments were performed with varying entered BMI by changing the entered weight from 38 to 102 kg using a height of 1.6 m.
Patients and Study Design
The study was conducted at Salem Medical Center and Center for Alcohol Research in Heidelberg, Germany. All patients gave written informed consent prior to inclusion and the study protocol was conformed to the 1975 Declaration of Helsinki and approved by the Ethics Committee of the University of Heidelberg.
39 patients with and without liver disease were included. Further inclusion criteria were age ≥18 and informed consent. The patient with manifest pronounced ascites was not included in the general analysis since assessment by FT had failed. Thus, general analysis was done in the remaining 38 patients. Patient data are summarized in Table 1. Patients received a clinical ultrasound and were then asked to receive liver stiffness measurement (LSM) with FS and FT. Twenty participants (51.2%) were healthy volunteers without diagnosed liver disease, six patients (15.4%) had alcoholic liver disease, two patients (5.2%) had mechanic cholestasis, five patients (12.6%) had known liver cirrhosis, one patient (2.6%) had hepatomegaly of unknown cause, four patients (10.2%) had simple steatosis and one patient (2.6%) had cirrhosis with ascites.
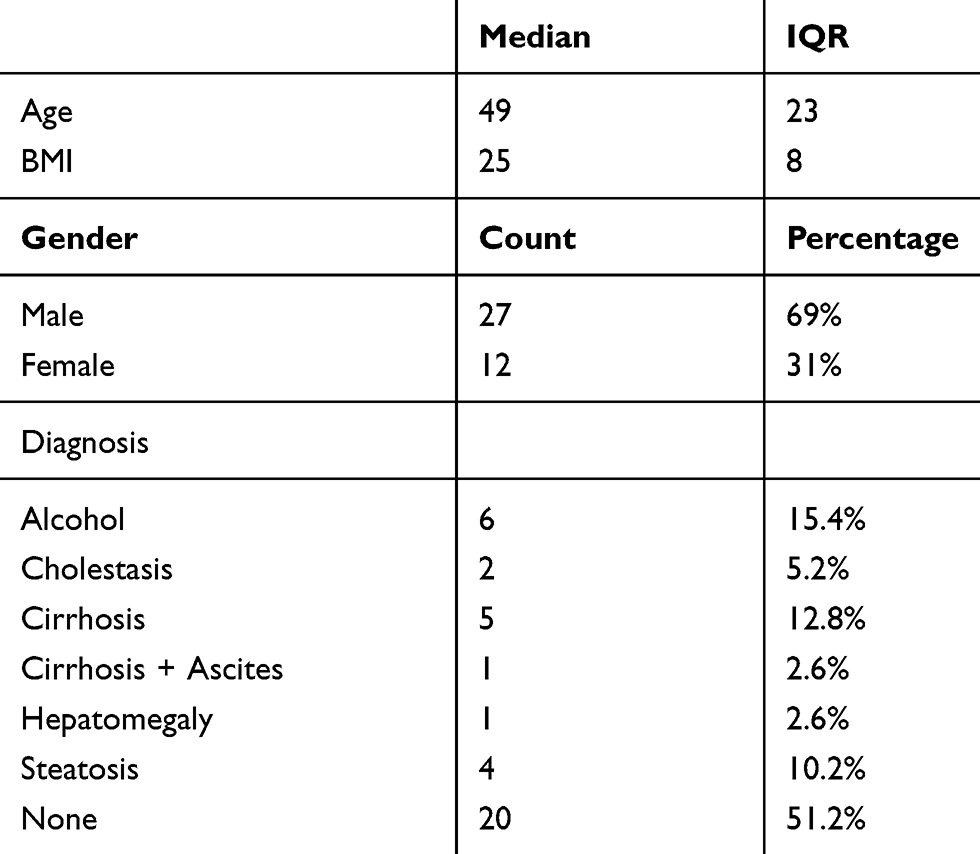 |
Table 1 Cohort Characteristics |
Statistics
All statistics was performed using Excel 2016 (Microsoft, USA) or SPSS 25 (IBM, USA). Figures were done using MATLAB (MathWorks, USA). Correlations were investigated using Pearson correlation coefficient. Reproducibility was analyzed by calculating intramachine and intermachine intraclass correlations (ICC) and coefficient of variation (CV) and its root-mean-square (RMS-CV). For the intraclass correlations of the different measurement series, we calculated all correlations between the three-measurement series for FS and FT, yielding three correlation coefficients per series. We give the middle correlation coefficient with lowest and highest in parenthesis. For UAP, since different BMIs were used, the UAP with the actual BMI for measurements 2 and 3 was estimated using the found relationship of UAP with BMI from phantom experiments. Furthermore, linear regression and Bland-Altman plots were used to analyze performance of FT with respect to FS. One patient with ascites was analyzed separately. FibroScan was considered as reference method. Besides for reproducibility, the first of the examinations was used for analysis. The statistical methods of this study were reviewed by Thomas Bruckner from Institute of Medical Biometry and Informatics, University of Heidelberg.
Results
Measurements of Liver Phantoms
Mean LS for FS was 2.6 ± 0.0 kPa and 2.8 ± 0.0 kPa for the low stiffness phantom for M and XL probe, respectively. Mean LS by FT was 1.0 kPa with zero variance. For the high stiffness phantom, FS measured 17.4 ± 0.2 and 16.3 ± 0.5 kPa with M and XL probe, respectively, while FT measured 20.4 ± 0.7 kPa. CAP was 245 ± 14 dB/m and 280 ± 45 dB/m for the low stiffness phantom for M and XL-probe, respectively. UAP was 239 ± 13 and 297 ± 8 dB/m for BMI 20 and 30 kg/m2, respectively. To investigate the dependence of UAP and BMI further, we performed an additional experiment with FT on the low stiffness phantom. BMI was altered by changing the weight from 58 kg to 102 kg using always 1.6 m as height. As shown in Figure 2, UAP clearly depended on the entered BMI. Below a BMI of 35 kg/m2, UAP followed the following function: UAP = 3.78 × BMI + 146, R2=0.99. Above a BMI of 35 kg/m2, no further change of UAP was observed. In contrast, CAP as assessed by FS does not depend on entered variables such as height and weight.
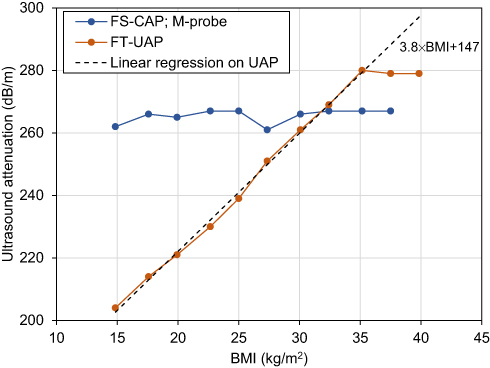 |
Figure 2 Dependence of UAP of FT and CAP of FS on entered BMI in phantom experiments. |
LS Measurements in Patients
Age of the 38 patients ranged from 19 and 69 years (median 49 years, IQR 23 years), 69% were male. Median BMI was 25 kg/m2, IQR 8 kg/m2. 20 patients had FS-LS<6 kPa, 7 patients had FS-LS between 6 and 8 kPa, 6 had FS-LS between 8 and 12.5 kPa and 4 had LS >12.5 kPa. 17 patients had a CAP<250 dB/m, 8 had a CAP between 250 and 300 dB/m and 12 had a CAP>300 dB/m. Average success rate was 93% and 98% for FS and FT, respectively.
Mean FS-LS was 10.0 ± 13.2 kPa with mean IQR of 1.6 ± 1.5 kPa while FT-LS was 13.0 ± 16.5 kPa with IQR of 3.2 ± 5.1 kPa (P=0.37). Intramachine reproducibility was investigated using the three independent measurements series for each device. Intraclass correlations for FS were 0.99 (0.98–0.99, P<10−28) and for FT were 0.96 (0.94–0.98, P<10−17). RMS-CV was 11.1% and 27.4% for FS and FT, respectively. Intermachine correlations for each measurement series were 0.91 (0.84–0.96, P<10−18), 0.91 (0.84–0.95, P<10−17) and 0.93 (0.87–0.96, P<10−19) for measurement series 1, 2 and 3, respectively. Figure 3A shows the scatter plot of LSM for FT vs FS from measurement series 1 in double log-scale. Linear regression of FT vs FS yielded the function FT-LSM= 1.17 × FS-LSM + 1.34 with R2=0.88.
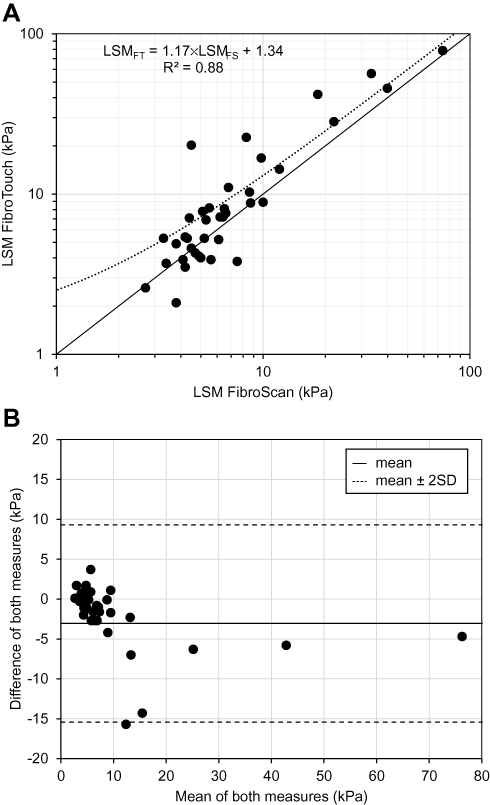 |
Figure 3 Comparison of LSM from FibroTouch and FibroScan. (A) Scatter plot of liver stiffness measurement of FibroTouch vs FibroScan with linear fit. (B) Bland-Altman plot of liver stiffness measurement of FibroTouch vs FibroScan. The difference of both methods was calculated by LSMFS minus LSMFT. |
Figure 3B shows the Bland-Altman analysis. The mean difference of both measures was −3.1 kPa with limits of agreement of −15,4 kPa and +9.1 kPa. It can be also seen that FT tends to overestimate LS with respect to FS. In Supplemental Fig. S1, an additional scatter plot is shown, where patients are ordered according to their FS-LS measurement from lowest to highest. On the y-axis, LS for FS and FT is shown. FT tended to overestimate LS and at FS-LS > 10 kPa, all FT-LS values were higher.
Case with Ascites
One patient (age 69 years, male, BMI 18.6 kg/m2) with cirrhosis and ascites was investigated separately. While the M-probe of FibroScan failed, valid LSM were obtained using the XL-probe. Mean FS-LS was 38.0 ± 8.9 kPa (success rate (SR) 100%), 48.8 ± 11.9 kPa (SR 66.7%) and 68.4 ± 30.7 kPa (SR 58.8%) for examination 1, 2 and 3, respectively. CAP was between 100 and 177 dB/m in all 3 examinations. Using FT, FT-LS was 7.2 ± 3.6 kPa (SR of 35%), 8.3 ± 3.6 kPa (SR 76.9%) and 6.4 ± 3.2 kPa (SR of 35%) for examination 1, 2 and 3, respectively. UAP was between 163 and 248 dB/m.
CAP and UAP
For measurement series one, mean CAP was 258 ± 65 dB/m with a mean IQR of 42 ±28 dB/m while mean UAP was 265 ±53 dB/m with a mean IQR of 11 ±8 dB/m. UAP was highly correlated with CAP (r=0.83, P<0.001). Both, CAP and UAP were also highly correlated with BMI with Pearson correlation coefficients of 0.73 and 0.79 (p<0.001) for CAP and UAP, respectively. Intramachine intraclass correlations were 0.84 (0.75–0.91, P<10−9) for FS. For FT, when using the real BMI of the patient, intraclass correlations were 0.95 (0.91–0.97, P<10−18). If using three different BMI (real, 20 and 40 kg/m2), intraclass correlations were 0.81 (0.70–0.89, P<10−10). CV-RMS were 9.7%, 12.9% and 6% for FS, FT with different BMI and FT with real BMI, respectively. Intermachine correlations were 0.81 (0.67–0.90, P<10−7), 0.73 (0.54–0.85, P<10−5) and 0.83 (0.69–0.91, P<10−7) for measurement series one, two and three, respectively, using real BMI for FT. In Figure 4A, the scatter plot of UAP vs CAP from measurement series one is shown. Linear regression yielded UAP = 0.68 × CAP + 90, R2=0.68. Figure 4B shows the Bland-Altman plot for UAP vs CAP from series one. Mean of the difference was −7 dB/m and limits of agreement were rather high with −77 and +62 dB/m for the lower and upper limit. In Supplemental Fig. S2, CAP and UAP are shown for patients ordered according to CAP from lowest to highest. Figure 5 shows UAP for all patients with three different BMI values. The linear function received from linear regression is 3.02 × BMI + 186 and is comparable to the function retrieved from phantom experiments.
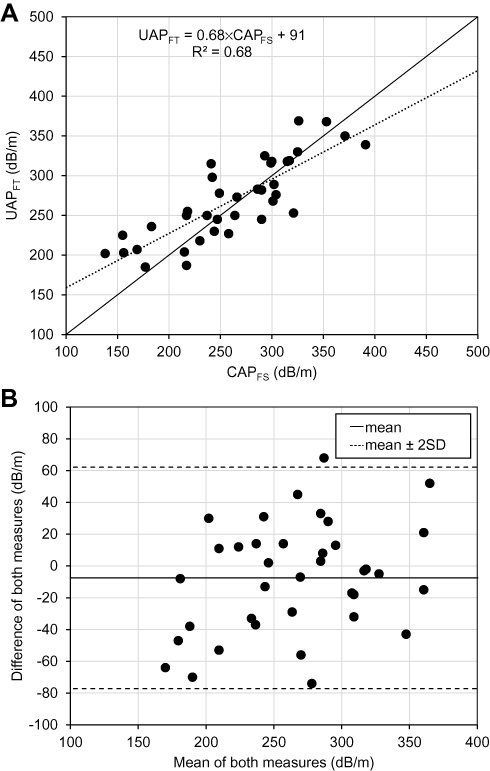 |
Figure 4 Comparison of ultrasound attenuation parameters from FibroTouch and FibroScan. (A) Scatter plot of UAP vs CAP with linear fit. (B) Bland-Altman plot of UAP vs CAP. The difference between both methods was calculated by CAP minus UAP. |
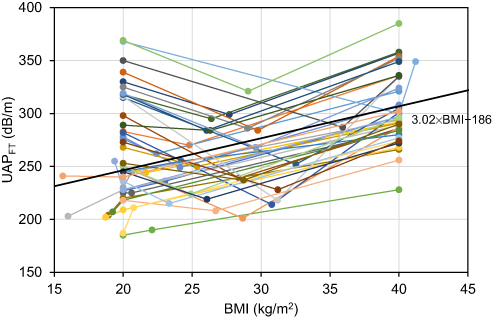 |
Figure 5 Ultrasound attenuation parameter (UAP) from FibroTouch results of each patient and each measurement series dependent on BMI. First measurement on the patient used the real BMI of the patient, the second measurement a BMI of 20 kg/m2 and the third measurement a BMI of 40 kg/m2. The association of UAP =3.02 × BMI+186 is similar to the association found in phantom experiments. |
Discussion
We here compared a newly commercially available FibroTouch from Wuxi Hisky Med, China with the established FibroScan from Echosens, France.1 Both devices are based on the technical principle of transient elastography and provide liver stiffness measurements and ultrasound attenuation measurements for the non-invasive assessment of liver fibrosis and steatosis. While LSM showed a moderate to good correlation between the two devices, the liver steatosis parameter seems to be misleading in the FibroTouch device.
Due to the many biopsy-proven studies based on FibroScan, it is now well accepted to compare novel elastographic techniques against FibroScan and not liver histology. Besides ethical aspects, this is also due to the better sample error of FS-TE as compared to histology.4 Although FT yielded comparable LSM as compared to the established FibroScan device, FT showed higher variations in LSM results and reduced intramachine reproducibility and intraclass correlations. In some patients, the difference of the methods was more than 10 kPa. As such high variations can lead to a significant of fibrosis stage, FT-LS should be interpreted with caution. In confirmation to a previous study, FS-LS could be obtained using the XL probe in a patient with significant ascites, while false data were measured by the FT device.
The most striking difference between both devices was observed with regard to liver steatosis. The UAP value of the FT device which is supposed to be a measurement of ultrasound attenuation used as a surrogate marker of hepatic steatosis such as the CAP from the FS device, could be identified to be a calculation involving mandatory entered data, in this case the height and weight of the patient. This could be shown both for the assessment in patients and phantoms. Thus, UAP on the FT device is misleading on not directly measuring ultrasound attenuation. Users are explicitly given the impression that UAP mirrors the CAP as a real and purely physical measurement of ultrasound attenuation while it actually is to a large extend calculated from entered data.
On a more subjective user experience, other important differences were observed between FS and FT. FT, like FS, uses a transient vibration to create the shear wave, the shear-wave propagation image, however, shows multiple waves and is of lower quality. Interestingly, the LSM in the FT device are triggered by a footswitch instead. In addition, the FT only comes with a single probe and no dedicated probes for obese people or children are available. Finally, FT does not store shear-wave propagation images which is a limitation for later analysis.
In a recently published large biopsy-based study within the so-called Riu Jin-Touch project comparable performance and cut-off values were found for FS and FT.32 Patients (N=435) were mostly lean (median BMI of 22.6 kg/m2) with mixed etiologies but mostly HBV. In contrast to this study, we found a larger variability and a tendency to overestimate LS by FT. Intraclass correlations were 0.96 for FT while they were 0.99 for FS. As also mentioned by this study, failure rates of FT were 0% which suggests insufficient rejection methods for unreliable measurements. This also explains why e.g. in our patient with ascites and a valid LS as obtained with FS using the XL probe, a completely different LS was obtained by FT.
In conclusion, this first independent comparative study between FS and FT in phantoms and humans shows important differences between both devices. Although we performed the back-to-back comparison in a rather small sample size, obvious differences could be noted especially with regard to UAP. Caution should be taken to simply apply FS-established cutoff values and reliability criteria for the new device. While good to moderate LSM could be obtained on the FT, the CAP-pendant UAP is misleadingly described as a pure measurement of ultrasound attenuation. Instead, UAP seems to be calculated directly from the entered height and weight of the patient. In summary, FT could be used for LS estimations but elevated LS should be validated on other more established elastography modalities.
Conclusion
FT-LS can be used to assess LS but more established elastography modalities should be used for validation. No steatosis can be measured on the FT platform since UAP clearly seems to include a calculation from entered data instead of a real physical measurement of ultrasound attenuation.
Abbreviations
TE, transient elastography; VCTE, vibration controlled transient elastography; FS, FibroScan; FT, FibroTouch; LS, liver stiffness; LSM, liver stiffness measurement; SWE, shear-wave elastography; CAP, controlled attenuation parameter; UAP, ultrasound attenuation parameter; ICC, intermachine intraclass correlations; CV, coefficient of variation.
Funding
This work was supported by the Dietmar Hopp Foundation.
Disclosure
The authors report no conflicts of interest in this work.
References
1. Sandrin L, Fourquet B, Hasquenoph JM, et al. Transient elastography: a new noninvasive method for assessment of hepatic fibrosis. Ultrasound Med Biol. 2003;29(12):1705–1713. doi:10.1016/j.ultrasmedbio.2003.07.001
2. Mueller S, Seitz HK, Rausch V. Non-invasive diagnosis of alcoholic liver disease. World J Gastroenterol. 2014;20(40):14626–14641. doi:10.3748/wjg.v20.i40.14626
3. Reiberger T, Ferlitsch A, Payer BA, et al. Noninvasive screening for liver fibrosis and portal hypertension by transient elastography–a large single center experience. Wien Klin Wochenschr. 2012;124(11–12):395–402. doi:10.1007/s00508-012-0190-5
4. Mueller S, Millonig G, Sarovska L, et al. Increased liver stiffness in alcoholic liver disease: differentiating fibrosis from steatohepatitis. World J Gastroenterol. 2010;16(8):966–972. doi:10.3748/wjg.v16.i8.966
5. Palmeri ML, Wang MH, Rouze NC, et al. Noninvasive evaluation of hepatic fibrosis using acoustic radiation force-based shear stiffness in patients with nonalcoholic fatty liver disease. J Hepatol. 2011;55(3):666–672. doi:10.1016/j.jhep.2010.12.019
6. Poynard T, Munteanu M, Luckina E, et al. Liver fibrosis evaluation using real-time shear wave elastography: applicability and diagnostic performance using methods without a gold standard. J Hepatol. 2013;58(5):928–935. doi:10.1016/j.jhep.2012.12.021
7. Mannelli L, Godfrey E, Graves MJ, et al. Magnetic resonance elastography: feasibility of liver stiffness measurements in healthy volunteers at 3T. Clin Radiol. 2011;67:258–262.
8. Nguyen-Khac E, Chatelain D, Tramier B, et al. Assessment of asymptomatic liver fibrosis in alcoholic patients using FibroScan: prospective comparison with seven non-invasive laboratory tests. Aliment Pharmacol Ther. 2008;28(10):1188–1198. doi:10.1111/apt.2008.28.issue-10
9. Friedrich-Rust M, Ong MF, Martens S, et al. Performance of transient elastography for the staging of liver fibrosis: a meta-analysis. Gastroenterology. 2008;134(4):960–974. doi:10.1053/j.gastro.2008.01.034
10. Castera LPM, Pinzani M. Biopsy and non-invasive methods for the diagnosis of liver fibrosis: does it take two to tango? GUT. 2010;59(7):861–866. doi:10.1136/gut.2010.214650
11. de Ledinghen V, Vergniol J, Barthe C, et al. Non-invasive tests for fibrosis and liver stiffness predict 5-year survival of patients chronically infected with hepatitis B virus. Aliment Pharmacol Ther. 2013;37(10):979–988. doi:10.1111/apt.2013.37.issue-10
12. Lindvig K, Mossner BK, Pedersen C, Lillevang ST, Christensen PB. Liver stiffness and 30-day mortality in a cohort of patients admitted to hospital. Eur J Clin Invest. 2012;42(2):146–152. doi:10.1111/eci.2012.42.issue-2
13. Potthoff A, Schettler A, Attia D, et al. Liver stiffness measurements and short-term survival after left ventricular assist device implantation: a pilot study. J Heart Lung Transplant. 2015;34(12):1586–1594. doi:10.1016/j.healun.2015.05.022
14. Jansen C, Moller P, Meyer C, et al. Increase in liver stiffness after transjugular intrahepatic portosystemic shunt is associated with inflammation and predicts mortality. Hepatology. 2018;67(4):1472–1484. doi:10.1002/hep.v67.4
15. Piecha F, Mandorfer M, Peccerella T, et al. Pharmacological decrease of liver stiffness is pressure-related and predicts long term clinical outcome. Am J Physiol Gastrointest Liver Physiol. 2018;315:G484–G494. doi:10.1152/ajpgi.00392.2017
16. Kim BK, Fung J, Yuen MF, Kim SU. Clinical application of liver stiffness measurement using transient elastography in chronic liver disease from longitudinal perspectives. World J Gastroenterol. 2013;19(12):1890–1900. doi:10.3748/wjg.v19.i12.1890
17. Vergniol J, Boursier J, Coutzac C, et al. Evolution of noninvasive tests of liver fibrosis is associated with prognosis in patients with chronic hepatitis C. Hepatology. 2014;60(1):65–76. doi:10.1002/hep.v60.1
18. Sagir A, Erhardt A, Schmitt M, Haussinger D. Transient elastography is unreliable for detection of cirrhosis in patients with acute liver damage. Hepatology. 2008;47(2):592–595. doi:10.1002/hep.22056
19. Dechene A, Sowa JP, Gieseler RK, et al. Acute liver failure is associated with elevated liver stiffness and hepatic stellate cell activation. Hepatology. 2010;52(3):1008–1016. doi:10.1002/hep.23754
20. Millonig G, Friedrich S, Adolf S, et al. Liver stiffness is directly influenced by central venous pressure. J Hepatol. 2010;52(2):206–210. doi:10.1016/j.jhep.2009.11.018
21. Millonig G, Reimann FM, Friedrich S, et al. Extrahepatic cholestasis increases liver stiffness (FibroScan) irrespective of fibrosis. Hepatology. 2008;48(5):1718–1723. doi:10.1002/hep.22577
22. Mederacke I, Wursthorn K, Kirschner J, et al. Food intake increases liver stiffness in patients with chronic or resolved hepatitis C virus infection. Liver Int. 2009;29(10):1500–1506. doi:10.1111/liv.2009.29.issue-10
23. Rausch V, Peccerella T, Lackner C, et al. Primary liver injury and delayed resolution of liver stiffness after alcohol detoxification in heavy drinkers with the PNPLA3 variant I148M. World J Hepatol. 2016;8(35):1547–1556. doi:10.4254/wjh.v8.i35.1547
24. Mueller S, Nahon P, Rausch V, et al. Caspase-cleaved keratin-18 fragments increase during alcohol withdrawal and predict liver-related death in patients with alcoholic liver disease. Hepatology. 2017;66(1):96–107. doi:10.1002/hep.v66.1
25. Kohlhaas A, Durango E, Millonig G, et al. Transient elastography with the XL probe rapidly identifies patients with non-hepatic ascites. Hepatic Medicine: Evidence and Research. 2012;4:11–18. doi:10.2147/HMER.S30256
26. Sasso M, Beaugrand M, de Ledinghen V, et al. Controlled attenuation parameter (CAP): a novel VCTE guided ultrasonic attenuation measurement for the evaluation of hepatic steatosis: preliminary study and validation in a cohort of patients with chronic liver disease from various causes. Ultrasound Med Biol. 2010;36(11):1825–1835. doi:10.1016/j.ultrasmedbio.2010.07.005
27. Berzigotti A. Getting closer to a point-of-care diagnostic assessment in patients with chronic liver disease: controlled attenuation parameter for steatosis. J Hepatol. 2014;60(5):910–912. doi:10.1016/j.jhep.2014.01.017
28. Karlas T, Petroff D, Sasso M, et al. Individual patient data meta-analysis of controlled attenuation parameter (CAP) technology for assessing steatosis. J Hepatol. 2017;66(5):1022–1030. doi:10.1016/j.jhep.2016.12.022
29. Wong VW, Chan WK, Chitturi S, et al. Asia-Pacific working party on non-alcoholic fatty liver disease guidelines 2017-part 1: definition, risk factors and assessment. J Gastroenterol Hepatol. 2018;33(1):70–85. doi:10.1111/jgh.13857
30. Chalasani N, Younossi Z, Lavine JE, et al. The diagnosis and management of nonalcoholic fatty liver disease: practice guidance from the American association for the study of liver diseases. Hepatology. 2018;67(1):328–357. doi:10.1002/hep.29367
31. Ferraioli G, Wong VW, Castera L, et al. Liver ultrasound elastography: an update to the world federation for ultrasound in medicine and biology guidelines and recommendations. Ultrasound Med Biol. 2018;44(12):2419–2440. doi:10.1016/j.ultrasmedbio.2018.07.008
32. Xu Y, Liu Y, Cao Z, et al. Comparison of FibroTouch and FibroScan for staging fibrosis in chronic liver disease: single-center prospective study. Dig Liver Dis. 2019;51(9):1323–1329. doi:10.1016/j.dld.2019.02.009
 © 2020 The Author(s). This work is published and licensed by Dove Medical Press Limited. The
full terms of this license are available at https://www.dovepress.com/terms
and incorporate the Creative Commons Attribution
- Non Commercial (unported, 3.0) License.
By accessing the work you hereby accept the Terms. Non-commercial uses of the work are permitted
without any further permission from Dove Medical Press Limited, provided the work is properly
attributed. For permission for commercial use of this work, please see paragraphs 4.2 and 5 of our Terms.
© 2020 The Author(s). This work is published and licensed by Dove Medical Press Limited. The
full terms of this license are available at https://www.dovepress.com/terms
and incorporate the Creative Commons Attribution
- Non Commercial (unported, 3.0) License.
By accessing the work you hereby accept the Terms. Non-commercial uses of the work are permitted
without any further permission from Dove Medical Press Limited, provided the work is properly
attributed. For permission for commercial use of this work, please see paragraphs 4.2 and 5 of our Terms.