Back to Journals » Hepatic Medicine: Evidence and Research » Volume 11
Project ECHO Revisited: Propensity Score Analysis And HCV Treatment Outcomes
Authors Page K ![]() , Qeadan F, Qualls C, Thornton K, Arora S
, Qeadan F, Qualls C, Thornton K, Arora S
Received 19 April 2019
Accepted for publication 12 September 2019
Published 7 October 2019 Volume 2019:11 Pages 149—152
DOI https://doi.org/10.2147/HMER.S212855
Checked for plagiarism Yes
Review by Single anonymous peer review
Peer reviewer comments 3
Editor who approved publication: Dr Gerry Lake-Bakaar
Kimberly Page,1,2 Fares Qeadan,1,2 Clifford Qualls,2 Karla Thornton,1 Sanjeev Arora1
1Department of Internal Medicine, University of New Mexico Health Sciences Center, Albuquerque, NM, USA; 2Clinical and Translational Science Center, University of New Mexico Health Sciences Center, Albuquerque, NM, USA
Correspondence: Kimberly Page
Department of Internal Medicine, University of New Mexico Health Sciences Center, MSC10 5550, 1 University of New Mexico, Albuquerque, NM 98131, USA
Tel +1505-272-2520
Email [email protected]
Abstract: Propensity score analysis is a statistical approach to reduce bias often present in non-randomized observational studies. In this paper we use this method to re-analyze data from a study that assessed whether patients receiving HCV treatment from providers in Project ECHO had different clinical outcomes than patients treated by specialists from an academic medical center (UNM HCV clinic) but in which treatment assignment was not randomized. We modeled the best estimated probability of treatment assignment, and then assess differences overall SVR and SVR in patients with genotype 1 infection by treatment arm using Stabilized Inverse Probability of Treatment Weights (SIPTW). Results show that after adjustment for SIPTW, HCV treatment outcomes were significantly better for the ECHO patients compared to the UNM HCV clinic patients. Higher proportions of patients treated by primary care providers achieved SVR and SVR with genotype 1 compared to those treated at UNM HCV clinic with 15.1% and 16.3% absolute differences, respectively. These results indicate that previously published results (showing no differences) were biased, and resulted in an underestimation of the treatment effect of ECHO on HCV treatment.
Keywords: propensity scoring, ECHO, hepatitis C virus, treatment
Introduction
A prospective cohort study from 2004 through 2008, conducted by Arora et al,1 comparing HCV treatment outcomes in patients treated for hepatitis C virus (HCV) infection at specialty clinics in an academic medical center (University of New Mexico (UNM)) and patients treated by primary care providers in Project ECHO showed no differences in sustained viral response (SVR) between the groups. A total of 57.5% (84 of 146) of patients treated at UNM HCV clinic achieved SVR and 58.2% (152 of 261) patients treated at ECHO sites achieved SVR. The difference in the proportion achieving SVR was 0.7 percentage points (95% confidence interval (CI); −9.2 to 10.7; P=0.89). Among patients with HCV genotype 1 infection, SVR was 45.8% (38 of 83 patients) at the UNM HCV clinic and 49.7% (73 of 147 patients) at ECHO sites (P=0.57). The impact of these results was significant as they showed that complex interferon-based HCV treatment could be effectively delivered outside of specialty care using a telehealth knowledge dissemination model. The ECHO (Extension for Community Healthcare Outcomes) model, developed as a platform to deliver complex specialty medical care and improve access of minorities and underserved populations to best practice care through an educational model of team-based interdisciplinary development - worked.1
This study’s limitations, however, were evident and discussed. As with many observational studies of clinical care, this was not a randomized trial; in a randomized trial patients and or providers would be randomly assigned to treatment or control arms. With no control over treatment assignment, treated – ECHO group, and non-treated- UNM HCV clinic group, may have had large differences on their observed covariates - imbalances, which could result in biased estimates of the treatment effects. While the study used a multivariable analysis approach to control for differences that were measured, such as race/ethnicity, age, and other factors, this type of covariance analysis may still not adequately eliminate bias. Thus, propensity score analysis is a statistical approach to balancing covariates and reducing bias in analyses of non-randomized observational studies.
We revisited the Project ECHO HCV study and utilized the propensity score method to model the best estimated probability of treatment assignment, and then assess differences in primary study outcomes including overall SVR and SVR in patients with genotype 1 infection2 by treatment arm (ECHO vs. UNM HCV clinic).
Methods
We note that if the treatment effect were related to a covariate, then an imbalance in the mean of this covariate between the two arms of the study will tend to cause a biased estimate of the treatment effect. Propensity score analysis attempts to eliminate the bias in the covariate and thereby give an unbiased estimate of the treatment effect. Propensity scoring computes weights (to be used later in weighted analyses) to modify the multivariate distribution of covariates in the treatment and control arms in an attempt to balance all covariates in mean simultaneously. These weights are computed by considering treatment versus control arms as a binary outcome and using logistic regression to compute, as predicted values, the probabilities that the outcome = treatment arm given the covariate values. With this conceptual/explanatory discussion given, a technical description follows.
First, we conducted multiple logistic regression to build a non-parsimonious model with the treatment versus control arms as the outcome using all data on factors and covariates that could potentially influence the treatment and possibly the outcome3,4 as the independent variables. A total of 27 variables were included: age; sex; minority group (race/ethnicity); marital status; employment status; housing status; HCV viral load, body mass index (BMI); HCV genotype; creatinine, hematocrit, aspartate aminotransferase, alanine aminotransferase, alkaline phosphatase, total bilirubin, total protein, albumin, white blood cell counts, platelet, absolute neutrophil counts; red-cell distribution width; mean corpuscular volume; treatment completed status, treatment duration, follow up time after treatment, and total follow up time. From this model, we calculated the propensity score as the reciprocal of the probability of receiving the treatment that was actually received, Inverse Probability of Treatment Weight (IPTW), and the Stabilized Inverse Probability of Treatment Weight (SIPTW).5 For our study we use SIPTW, which is an improvement over IPTW to reduce potential weights of subjects with either low or high propensity scores.6 Parameter estimates for this model were obtained by using the penalized likelihood to avoid and minimize the chance of overfitting.7
The second step in the reanalysis was to apply the weights to modeling the treatment outcomes (SVR and SVR in genotype 1 infection): adjusting by the SIPTWs to account for any treatment selection bias. We use the area under the receiver operating characteristic (ROC) curve to assess the discrimination power of the non-parsimonious model and Hosmer-Lemeshow test to evaluate its calibration.8 To examine the assumptions of common support and balance we explore both the distribution of the propensity scores9,10 and SIPTWs for the treatment (ECHO) and control (UNM HCV clinic) respectively.
Results
The non-parsimonious model exhibited a high discrimination power between the two treatment groups (ECHO vs. UNM HCV clinic) with an area under the ROC curve of 0.880 (Figure 1). It also showed good calibration according to the Hosmer-Lemeshow statistics (χ2 = 9.948, df = 8, P = 0.269). The common support and balance assumptions were satisfactory for this problem. Specifically, the SIPTWs exhibited similar distributions and the distributions of propensity scores between the two treatments completely overlapped between the two treatments with means close to one (ECHO: M=1.0, SD=0.8; UNM HCV clinic: M=1.2, SD=4.7), suggesting no misspecification of the used model.11
Our results show that after adjustment for SIPTW, HCV treatment outcomes were significantly better for the ECHO patients compared to the UNM HCV clinic patients (Table 1). Higher proportions of patients treated by primary care providers achieved SVR and SVR with genotype 1 compared to those treated at UNM HCV clinic with 15.1% and 16.3% absolute differences, respectively.
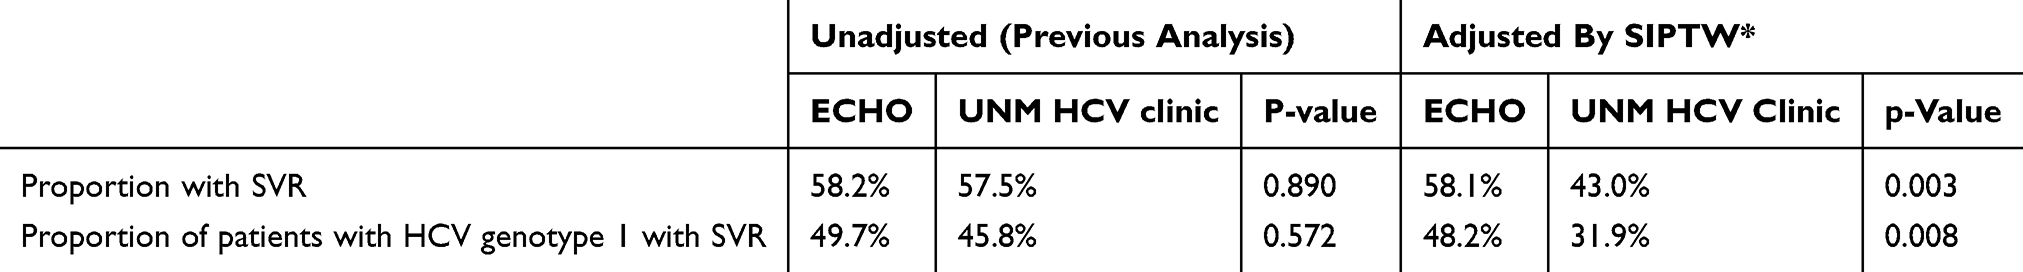 |
Table 1 HCV Treatment Outcomes By ECHO Vs. UNM HCV Clinic: Original Analyses Vs. Analyses Adjusted For SIPTW |
Discussion
Our results indicate that by using propensity scoring with measured covariates in this observational study, we reduced bias and achieved improved precision of the difference in HCV treatment results for HCV infection in ECHO compared to UNM HCV clinic patients. And importantly, the results show that patients treated by ECHO providers had significantly better outcomes than those treated by specialty providers at the academic medical center. These results indicate that previously published results (showing no differences) were biased, and resulted in an underestimation of the treatment effect of ECHO on HCV treatment. Analyses to further explore the sources of this bias showed three factors that primarily contributed to the direction of the adjusted findings: male sex, creatinine levels and white blood cell count. For example, there were many more males in ECHO (72%) than in UNM (45%) and males had a somewhat lower SVR rate; this is a selection bias that artificially caused ECHO to have a lower SVR rate than would have been observed in a randomized clinical trial.
This analysis benefitted from a large enough sample size (406 patients: 261 were treated at ECHO sites and 146 were treated at UNM HCV clinic) to implement inverse probability weighting. While there are several strategies to building the multiple logistic regression models to calculate the propensity scores, we used strategy which utilizes a non-parsimonious model as recommended by most authors.2,12–18 We had similar findings with better outcomes in ECHO patients when we used a parsimonious model using methods described by Shadish et al,14 wherein 19 covariates and factors were used instead of 27.
This previously published study is an important example of how propensity scoring can (and should) be used in statistical analysis in applied medicine, where treatment assignment is not randomized. Further these results confirm previous findings showing that the ECHO model is an effective way to deliver HCV treatment to in underserved communities. This research in this study was conducted when interferon-based treatment was standard of care and treatment success rates were much lower than with current direct-acting antiviral (DAA) treatments, which are effective in over 95% of patients.19 As the ECHO model has now been expanded into new clinical areas and populations and with the new highly effective DAA treatment, ongoing evidence will still be needed to measure effectiveness and impact. Using propensity scoring for further observational analyses has important potential provide unbiased and better estimates of these outcomes.
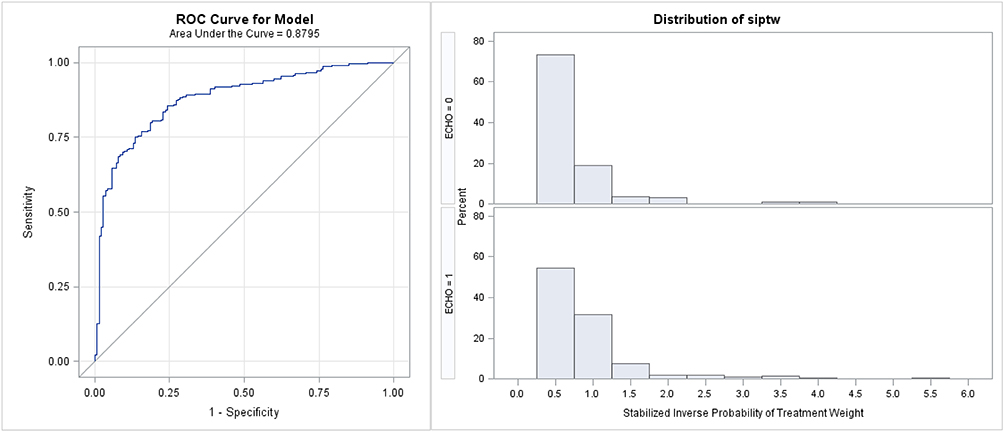 |
Figure 1 Left panel: ROC curve for classifying ECHO vs. UNM HCV clinic. Right panel: distribution of SIPTWs by treatment arm. |
Acknowledgments
Authors (KP, JQ, CQ) received support from the UNM CTSC (UL1TR001449).
Disclosure
Dr Kimberly Page reports grants from NIH, Gilead Sciences, and PCORI, during the conduct of the study. The authors report no other conflicts of interest in this work.
References
1. Arora S, Thornton K, Murata G, et al. Outcomes of treatment for hepatitis C virus infection by primary care providers. NEJM. 2011;364:2199–2207. doi:10.1056/NEJMoa1009370
2. D’Agostino RB
3. Austin PC, Grootendorst P, Anderson GM. A comparison of the ability of different propensity score models to balance measured variables between treated and untreated subjects: a monte carlo study. Stat Med. 2007;26:734–753. doi:10.1002/sim.2580
4. Patrick AR, Schneeweiss S, Brookhart MA, et al. The implications of propensity score variable selection strategies in pharmacoepidemiology: an empirical illustration. Pharmacoepidemiol Drug Saf. 2011;20:551–559. doi:10.1002/pds.2098
5. Austin PC, Stuart EA. Moving towards best practice when using inverse probability of treatment weighting (IPTW) using the propensity score to estimate causal treatment effects in observational studies. Stat Med. 2015;34:3661–3679. doi:10.1002/sim.6607
6. Xu S, Ross C, Raebel MA, Shetterly S, Blanchette C, Smith D. Use of stabilized inverse propensity scores as weights to directly estimate relative risk and its confidence intervals. Value Health. 2010;13:273–277. doi:10.1111/j.1524-4733.2009.00671.x
7. Moons KG, Donders AR, Steyerberg EW, Harrell FE. Penalized maximum likelihood estimation to directly adjust diagnostic and prognostic prediction models for overoptimism: a clinical example. J Clin Epidemiol. 2004;57:1262–1270. doi:10.1016/j.jclinepi.2004.01.020
8. Steyerberg EW, Vickers AJ, Cook NR, et al. Assessing the performance of prediction models: a framework for traditional and novel measures. Epidemiology. 2010;21:128–138. doi:10.1097/EDE.0b013e3181c30fb2
9. Rubin DB. Using propensity scores to help design observational studies: application to the tobacco litigation. Health Serv Outcomes Res Method. 2001;2:169–188. doi:10.1023/A:1020363010465
10. Stuart EA. Matching methods for causal inference: a review and a look forward. Stat Sci. 2010;25:1–21. doi:10.1214/09-STS313
11. Cole SR, Hernan MA. Constructing inverse probability weights for marginal structural models. Am J Epidemiol. 2008;168:656–664. doi:10.1093/aje/kwn164
12. Rubin DB. The design versus the analysis of observational studies for causal effects: parallels with the design of randomized trials. Stat Med. 2007;26:20–36. doi:10.1002/sim.2739
13. Rosenbaum PR, Rubin DB. The central role of the propensity score in observational studies for causal effects. Biometrika. 1983;70:41–55. doi:10.1093/biomet/70.1.41
14. Shadish W, Luellen J, Clark M. Propensity scores and quasi-experiments: a testimony to the practical side of Lee Sechrest. In: Bootzin RR, McKnight PE, editors. Strengthening Research Methodology: Psychological Measurement and Evaluation. Washington, DC: American Psychological Association; 2006:143–157.
15. Weitzen S, Lapane KL, Toledano AY, Hume AL, Mor V. Principles for modeling propensity scores in medical research: a systematic literature review. Pharmacoepidemiol Drug Saf. 2004;13:841–853. doi:10.1002/pds.969
16. Biondi-Zoccai G, Romagnoli E, Agostoni P, et al. Are propensity scores really superior to standard multivariable analysis? Contemp Clin Trials. 2011;32:731–740. doi:10.1016/j.cct.2011.05.006
17. Cavuto S, Bravi F, Grassi MC, Apolone G. Propensity score for the abnalysis of observational data: an introduction and an illustrative example. Drug Dev Res. 2006;67:208–216. doi:10.1002/ddr.20079
18. Thoemmes FJ, Kim ES. A systematic review of propensity score methods in the social sciences. Multivariate Behav Res. 2011;46:90–118. doi:10.1080/00273171.2011.540475
19. Bourliere M, Pietri O. Hepatitis C virus therapy: no one will be left behind. Int J Antimicrob Agents. 2019;53:755–760. doi:10.1016/j.ijantimicag.2018.12.010
 © 2019 The Author(s). This work is published and licensed by Dove Medical Press Limited. The
full terms of this license are available at https://www.dovepress.com/terms
and incorporate the Creative Commons Attribution
- Non Commercial (unported, 3.0) License.
By accessing the work you hereby accept the Terms. Non-commercial uses of the work are permitted
without any further permission from Dove Medical Press Limited, provided the work is properly
attributed. For permission for commercial use of this work, please see paragraphs 4.2 and 5 of our Terms.
© 2019 The Author(s). This work is published and licensed by Dove Medical Press Limited. The
full terms of this license are available at https://www.dovepress.com/terms
and incorporate the Creative Commons Attribution
- Non Commercial (unported, 3.0) License.
By accessing the work you hereby accept the Terms. Non-commercial uses of the work are permitted
without any further permission from Dove Medical Press Limited, provided the work is properly
attributed. For permission for commercial use of this work, please see paragraphs 4.2 and 5 of our Terms.