Back to Journals » Substance Abuse and Rehabilitation » Volume 5
Program- and service-level costs of seven screening, brief intervention, and referral to treatment programs
Authors Bray J, Mallonee E, Dowd W, Aldridge A, Cowell A, Vendetti J
Received 8 February 2014
Accepted for publication 6 May 2014
Published 1 July 2014 Volume 2014:5 Pages 63—73
DOI https://doi.org/10.2147/SAR.S62127
Checked for plagiarism Yes
Review by Single anonymous peer review
Peer reviewer comments 2
Jeremy W Bray,1 Erin Mallonee,2 William Dowd,2 Arnie Aldridge,2 Alexander J Cowell,2 Janice Vendetti3
1Department of Economics, Bryan School of Business and Economics, University of North Carolina at Greensboro, Greensboro, NC, USA; 2RTI International, Research Triangle Park, NC, USA; 3Department of Community Medicine and Health Care, School of Medicine, UCONN Health, Farmington, CT, USA
Abstract: This paper examines the costs of delivering screening, brief intervention, and referral to treatment (SBIRT) services within the first seven demonstration programs funded by the US Substance Abuse and Mental Health Services Administration. Service-level costs were estimated and compared across implementation model (contracted specialist, inhouse specialist, inhouse generalist) and service delivery setting (emergency department, hospital inpatient, outpatient). Program-level costs were estimated and compared across grantee recipient programs. Service-level data were collected through timed observations of SBIRT service delivery. Program-level data were collected during key informant interviews using structured cost interview guides. At the service level, support activities that occur before or after engaging the patient comprise a considerable portion of the cost of delivering SBIRT services, especially short duration services. At the program level, average costs decreased as more patients were screened. Comparing across program and service levels, the average annual operating costs calculated at the program level often exceeded the cost of actual service delivery. Provider time spent in support of service provision may comprise a large share of the costs in some cases because of potentially substantial fixed and quasifixed costs associated with program operation. The cost structure of screening, brief intervention, and referral to treatment is complex and discontinuous of patient flow, causing annual operating costs to exceed the costs of actual service provision for some settings and implementation models.
Keywords: screening, brief intervention, brief treatment, SBIRT, cost
Introduction
Recognizing that the treatment needs of the entire population could be better met through a comprehensive approach to identifying and treating substance use problems across a continuum of severity, the US Substance Abuse and Mental Health Services Administration (SAMHSA) established the screening, brief intervention, and referral to treatment (SBIRT) grant program in 2003. SBIRT systematically screens individuals presenting for care in medical settings to determine their degree of substance use risk and whether brief intervention (BI), brief treatment (BT), or referral to treatment (RT) is appropriate.
Expanding the identification and treatment of substance use problems is a significant priority, but controlling health care costs is also necessary. In the face of rising expenditures, health care payers require more cost accountability from providers, who are expected to deliver effective treatment at low costs. Understanding the costs of SBIRT is therefore important for treatment providers and policy makers as they allocate scarce resources among various treatment services. Beyond policy pressures, previous literature shows cost to be a major consideration in providers’ decisions to adopt SBIRT.1–3
Little is known, however, about the costs of SBIRT programs. Existing literature focuses on screening and brief intervention (SBI) for unhealthy alcohol use.4 To our knowledge, no published study documents the costs of programs that explicitly and deliberately incorporate SBIRT into the continuum of care for illicit drug users. Estimates of the cost of SBI vary widely, based on the diverse set of screening and intervention methods employed and on the costing methodology used.
Conceptually, there are two basic approaches to cost estimation. Service-level approaches attempt to estimate directly the cost of specific services; whereas, program-level approaches estimate the total cost of operating a service delivery program for a given amount of time (usually 1 year). Service-level cost estimates can be multiplied by the number of services delivered to obtain an annual operating cost, and program-level cost estimates can be divided by the number of services delivered to estimate the average cost of service delivery.
To illustrate the variation in estimates from the existing cost literature, Zarkin et al3 used a service-level costing methodology and estimated screening costs at $0.42 per patient in primary care settings. Gentilello et al5 also used a service-level costing methodology and estimated screening costs at $16 per patient in an emergency department (ED) setting, suggesting possible differences across settings. Kunz et al,6 however, used a program-level methodology and estimated screening costs at $497 per patient in an ED setting, suggesting that costing methodology may affect cost estimates. There is also broad variability in the units in which SBI costs are expressed. For example, BI costs have been reported at $2.59 per patient,3 $135 per BI session,6 and $0.59 median per member per month (insurance premium cost).7 The variability of SBI programs is a primary cause for variation in cost estimates across studies, but the lack of a consistent costing methodology also limits the usefulness of cross-study comparisons.
This paper examines the costs of the SBIRT programs as delivered by the first cohort of seven SAMHSA SBIRT grantees, using both service-level and program-level costing methods. To facilitate comparisons across grantees, we examine three implementation models: contracted specialist (CS); inhouse specialist (IHS); and inhouse generalist (IHG). In the CS model, SBIRT services are delivered by staff members who are employed and supervised by an outside agency or umbrella organization. Service delivery personnel in the IHS model are employees of the host medical setting whose primary responsibility is the delivery of SBIRT services; they are typically behavioral health or substance abuse specialists. In the IHG model, medical staff (eg, physicians, nurses, or medical assistants) who have responsibilities beyond SBIRT service delivery are trained to conduct SBIRT activities. By applying multiple costing methodologies across a variety of SBIRT programs, this paper is the first to allow direct comparison of cost estimates across implementation models, service delivery settings, and costing methodology.
First cohort of SAMHSA SBIRT grantees
Over a 5-year period, SAMHSA funded SBIRT operations within an initial cohort of seven grantees: California; Cook Inlet Tribal Council in partnership with the Southcentral Foundation in Alaska; Illinois; New Mexico; Pennsylvania; Texas; and Washington. Grantee names are not used in the remainder of this paper in accordance with data security assurances made to the grantees.
The SBIRT programs varied both within and across grantees in terms of service setting and staff training and qualifications, but all delivered screening, BI, BT, and RT to address alcohol and illicit drug misuse among the target population of adults between the ages of 18 and 65. In addition, prescreening was conducted in some locations to more efficiently screen out individuals with little to no risk. Grantees implemented SBIRT in a wide range of health care settings, including hospitals, emergency and trauma centers, and ambulatory clinics. Many ambulatory care centers were federally qualified health centers. Others were hospital outpatient clinics, and some offered specialized services (eg, Planned Parenthood clinics). Across grantee programs, approximately 50% of the individuals providing screening and BI services and more than 75% of those providing BT services were currently or previously certified in addiction treatment. Most individuals providing BT services had graduate-level degrees (67%). More than 70% of the SBIRT providers were female; approximately one-third was Hispanic.
Table 1 provides details on the populations and clinical settings served by each grantee, using data collected by each grantee between October 1, 2004–January 31, 2008, as required by the US federal Government Performance and Results Act (GPRA) and provided by SAMHSA’s GPRA data coordinating center.
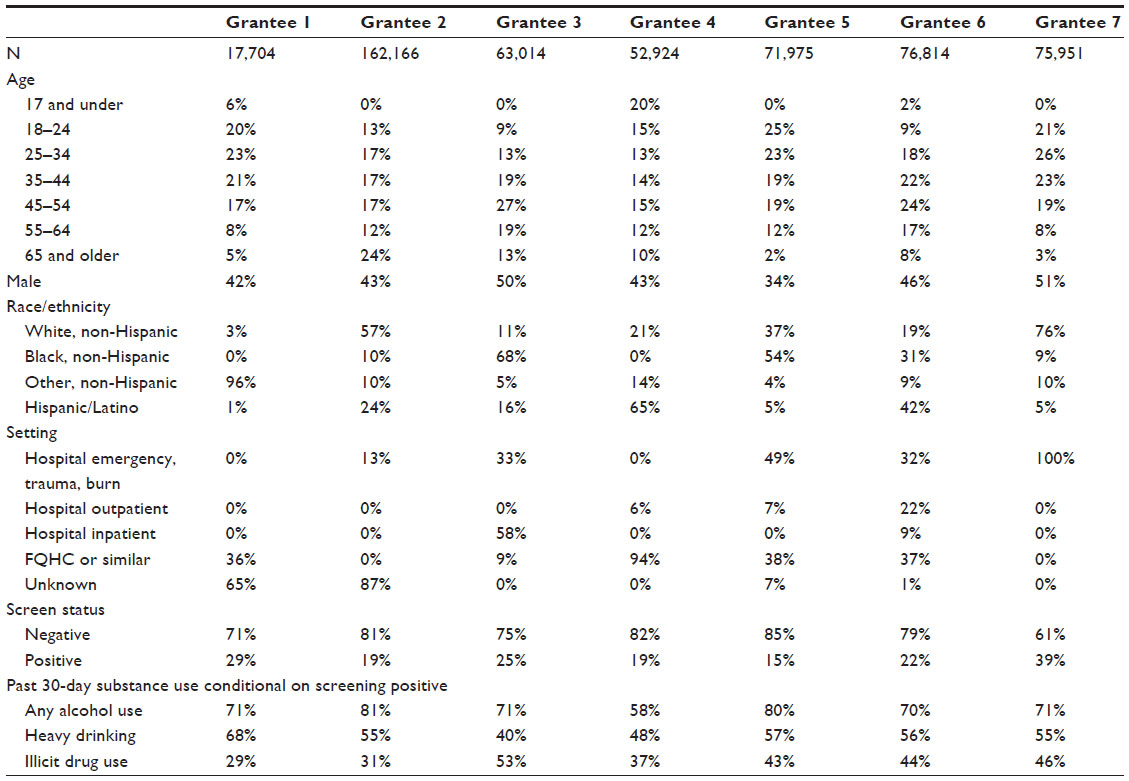 | Table 1 Populations and clinical settings served by grantee |
Grantee 1 implemented SBIRT in two clinical settings within a single metropolitan area. Certified medical assistants or licensed practical nurses in the primary clinical setting administered the screening assessment in conjunction with additional health screening instruments. The results, if positive, were forwarded to an onsite behavioral health consultant (BHC) who conducted the BI. Counselors in the secondary clinical setting provided additional assessment, BI, BT, and referral to more intensive treatment. Grantee 1 served nearly 18,000 patients between October 1, 2004–January 31, 2008. Although Grantee 1 had only two clinical settings, data on the clinical location were unavailable for nearly 65% of all patients served. These patients were almost certainly served in an outpatient setting, but we report the setting as “unknown” since we were unable to confirm the setting.
Grantee 2 implemented SBIRT services in one community health center and five hospital EDs that included burn and trauma units in a large, urban metropolitan area. Patient intake employees administered a prescreen assessment to patients. The full screen and subsequent BIs were completed by nine health educators who were trained and monitored by a local academic research center. Health educators had a minimum of a bachelor’s degree, and several were unlicensed medical doctors. The BT services located at the academic research center used master’s- or PhD-level certified treatment counselors. Referral to specialty care was based on collaborative relationships with local treatment agencies. Grantee 2 served approximately 162,000 patients. As with Grantee 1, the clinical setting information was unavailable for the majority of patients.
Grantee 3 implemented SBIRT in three hospitals and nine federally qualified health centers in the inner city of a large, urban metropolitan area. Contracted health counselors, who were mostly certified alcohol and drug counselors, were trained and monitored by a local addiction treatment center to provide screening and BI services. The local treatment center was also responsible for the training, technical assistance, and monitoring of certified alcohol and drug counselors in the substance abuse treatment community who provided the BT services. BT was offered onsite in health center, hospital, and ED settings. A local community agency provided case management services for SBIRT patients referred to formal treatment. Grantee 3 provided services to approximately 63,000 patients.
Grantee 4 implemented SBIRT in 33 rural primary care clinics, public health offices, and school-based health centers across the state and established relationships with six specialized treatment agencies. In house clinicians (typically a nurse or medical assistant) screened patients. A private community health organization managed and employed 24 BHCs who performed the BI, BT, and RT services. All BHCs held master’s degrees with the exception of two who held bachelor’s degrees and alcohol and drug abuse counselor licensure. Patients referred to specialized substance abuse treatment received care coordinated by a statewide entity responsible for managing the state’s publicly funded behavioral health services. Grantee 4 served nearly 53,000 patients.
Grantee 5 implemented SBIRT in four counties (both rural and urban) throughout the state. Settings included five community clinics, two hospital outpatient clinics, and one large ED that housed a Level 1 trauma center. Ten paraprofessional health care specialists were employed by the counties to perform all SBIRT services onsite at most medical settings. In the emergency setting, unlicensed staff physicians provided support for the screening and BI services, and master’s-level therapists provided BT services for all SBIRT patients in that county. One clinic employed inhouse staff to complete a prescreen. Patients who were positive on this prescreen were then administered the full screen by a health care specialist who also delivered BI services. Grantee 5 served almost 72,000 patients from October 1, 2004–January 31, 2008.
Grantee 6 implemented SBIRT in three community health clinics and two hospital settings within a large urban county hospital district, using the same implementation model in all settings. A nurse, medical assistant, patient care technician, or physician conducted a short prescreen. Positive cases were referred to SBIRT specialists (vocational nurses, registered nurses, counselors) for the full screening. These individuals were employed by the hospital district and were trained and supervised by collaborators in clinical departments at a state university medical school. SBIRT specialists provided all screening and BI services. BT and referral services were provided by a local substance abuse treatment agency. However, after licensing issues were resolved, master’s-level specialists provided BT services onsite at the hospitals. Grantee 6 served nearly 77,000 patients.
Grantee 7 implemented SBIRT in nine hospital emergency centers throughout the state. Screening and BI services were provided by chemical dependency professionals employed by the hospitals with SBIRT-specific funds and supervised by both hospital and grant program staff. The BT services were provided by chemical dependency professionals at local treatment agencies. In some cases, the individuals providing screening and BI services also provided the BT services at those outside agencies. Grantee 7 served almost 76,000 patients from October 1, 2004–January 31, 2008.
Methods
Service-level data
Observational site visits were conducted at a sample of the SBIRT sites within each grantee. Sites were chosen in coordination with the grantee staff to be qualitatively representative of the grantees’ implementation models, service settings, and target populations. All implementation model/setting combinations implemented by grantees were observed for at least one service. However, not all model/setting combinations were implemented by grantees, so some combinations could not be observed. Furthermore, the evaluation team’s time onsite to conduct observations was very limited, due to the need to have minimal impact on the services being delivered and funding constraints, thus model/setting combinations with low service flow had fewer observations.
During observation visits, trained evaluators observed practitioner–patient interactions and recorded the time required to provide each SBIRT component (eg, screening, BI) and the setting in which it was delivered. Observed activities were categorized as: direct SBIRT service; SBIRT support activity (eg, record keeping, reading the patient’s chart, or locating the patient); or SAMHSA grant-related activity (eg, collecting federally mandated performance monitoring data). Grant-related activities are not included in the cost estimates presented here because they are not a cost of SBIRT per se.
Observers followed SBIRT practitioners as unobtrusively as possible to collect data in real time. All activities were timed using a stopwatch. Support services varied greatly from site to site, but they were closely associated with clinical services and were largely performed on a per-patient basis. In some cases, no service support activities were observed. It may be that no support activities took place, or such activities could have occurred outside the purview of the observers. Some support services naturally took part at the start or end of the practitioner’s shift (which was often not observed). If we observed some, but not all, support activities for a given patient, then our study underestimates the true service support cost. If we observed no support activities for patients that actually required them, however, then we may be overstating or understating service support costs. In this latter case, if the observed activities were more expensive than those not observed, then our study overstates the cost of support activities.
During the course of the workday, observers timed activities and demarcated any breaks. Start and stop times were noted to delineate transitions from SBIRT-related activities to grant-related or extraneous activities. Observers also recorded the specific setting (eg, ED observation room, inpatient hospital ward) and, to estimate full resource utilization, the size of the area (eg, a 10×10 ft exam room) where the services were provided. Observers timed: 110 screenings (71 with support activities); 45 BIs (30 with support activities); eleven BTs (four with support activities); and 12 RTs (none with support activities). In addition, observers timed 12 prescreens (typically one-to-three questions intended to screen out individuals with little to no risk), all performed by generalists in outpatient settings. Because comparison across implementation model and service delivery setting is not possible, we do not report prescreen cost estimates here.
Although the BT protocol varies within and between grantee organizations, it often consists of multiple sessions with a SBIRT practitioner. Varying levels of effort are required to administer the first BT session compared with subsequent sessions, especially relating to service support time. Furthermore, BTs often occur in a different location than the initial screen; approximately one-half of the BTs observed were conducted in a different setting than where the screening was conducted. Nonetheless, we classify the setting of the BT based upon the setting in which the screen occurred because this more accurately conveys the patient population being served.
Program-level data
The Substance Abuse Services Cost Analysis Program (SASCAP)8 was adapted to collect program-level resource use data from each grant program and selected provider organizations. The modified SASCAP included four modules that collected data in four different cost topic areas. The clinical supervisor’s labor module collected labor information about clinical activity time expectations, clinical supervision time, program personnel data, and data on the number of actual program services provided. The administrative director’s cost module collected labor data including: job types; credentials; and full-time equivalencies (FTEs) on paid employees and volunteers, as well as a dollar amount of contracted services provided. Building space used and square footage used by each job type (eg, behavioral health counselor) were also collected in this module. The labor module used an accompanying interactive spreadsheet to collect labor information. The spreadsheet used: topic-level tabs to collect information on the program-level staff background; the types of program activities staff members perform; and the time allocated to each activity as an average over a typical month. A fourth guide collected training cost information and also served as a technical assistance log for SBIRT trainers; this guide provided the cost study with travel expenses associated with training, time spent training, and the reason for the training. Collectively, these modules were used to collect data on the following program-level cost variables: service delivery labor; quality assurance labor; program administration labor; space; materials and equipment; and contracted services.
A key informant at each grantee, typically the grantee project director, was selected to assist with data collection and provided with the modified SASCAP. An initial teleconference was held to provide detailed instructions on completing the survey and to answer any questions before data collection began. The key informant then worked with other grantee administrative personnel to review project budgets and expenditures before completing an initial draft of the SASCAP. This draft was then discussed in a subsequent teleconference, and a revised SASCAP was completed by the key informant. This process was repeated until the grantee and evaluators reached consensus on the data provided. Two grantees completed local cost studies prior to the administration of the SASCAP. These cost study reports and supporting data were used to prepopulate the SASCAP prior to the initial teleconference.
The SASCAP provided grantee staff with a structured approach to recall activities they conducted throughout startup and program implementation and to determine which financial, personnel, and physical resources were devoted to tasks throughout each phase of the project for a typical period. To separate service delivery costs from grant administration costs, respondents were asked to complete the guide, thinking back over a typical period in their program, but with an eye toward the future of how their program would operate after grant funding had ended. During teleconferences, respondents were instructed in all cases to use actual project budgets and expenditures as the basis for their information. At the time the SASCAP was administered, all grantees were preparing sustainability plans to submit to SAMHSA, and these plans were used to guide grantees in separating grant-related costs (eg, conducting federally mandated follow-up interviews with 10% of patients served) from SBIRT service delivery costs (eg, screening patients for at-risk substance use and providing the appropriate care). The completeness of these sustainability plans varied across grantees, so information from the timing observations, historical data on patient flow within a grantee, and information from grantee budgets and expenditures were also used to guide the grantees in separating the costs of SAMHSA grant activities from the costs of activities related to the SBIRT service delivery.
Unit costs
To facilitate cross-grantee cost comparisons, national-level unit costs were applied to both the service-level and program-level resource use data. To estimate hourly wage rates, the job titles and qualifications of practitioners were collected from each grantee to determine the level of education and training needed for a typical SBIRT practitioner. These credentials were then matched with positions in the US Bureau of Labor Statistics database,9 and the national average wage for each position was applied for a given setting (eg, hospital versus clinic). These wages were then multiplied by an estimated overhead and benefits multiplier of 1.2733 (27.33% of wages). For service-level cost analyses, the median wage across grantees within the setting and implementation model was used as a standardized unit cost for labor, thus averaging across labor types. The hourly rate for a square foot of space was calculated from the national average class A rental space rate from a national real estate analysis firm.10 Although appropriate for a cross-site cost analysis, using national cost estimates potentially obscures differences between regions in resource prices and differences in the quality of the resources used. For example, although the wage rates used in this analysis distinguish between doctors and health educators, they do not distinguish between highly paid (and presumably better performing) health educators and low-paid health educators.
Analysis
To estimate the service-level cost of SBIRT, the time used for each activity was estimated using the mean of the observational timing data. The mean, rather than the median, was used because it is the more commonly used measure of central tendency and, in most cases, was qualitatively similar to the median. Multiplying the time required for SBIRT service and support activities for a given SBIRT activity by the associated standardized wage yields the labor cost for performing each of the services. The mean space required within each setting (ED, inpatient, outpatient) was paired with the rental rate per square foot per minute to determine the space cost per minute. This estimate was then multiplied by the time required for each service, which resulted in the total space cost incurred for delivering each service. Summing labor and space costs over all activities yields a cost per activity.
Service-level results are presented separately by the implementation model and within the model by setting. IHG and IHS models were only observed in an outpatient setting. IHGs were only observed delivering screens; whereas, IHSs were observed delivering screens and BIs, but no BTs or RTs. CSs were observed in all settings and delivering all services.
Given the small sample sizes and qualitative sampling design of the observation data, we do not calculate inferential statistics or standard errors. Consistent with the qualitative sampling approach and underlying process evaluation that generated the timing data, we view these cost estimates as qualitative estimates rather than precise quantitative or statistical estimates. To reflect the variation in the timing data, we present the range, the median, and the mean of the timing observations.
For program-level costs, the resource use data collected from the SASCAP guides were multiplied by the relevant unit cost data and summed across all activities to yield an annual operating cost estimate. This estimate was then divided by the estimated number of patients served per year (obtained from the GPRA data)11 to derive an average cost estimate. Although this measure of patient flow does not directly align with a specific fiscal year, we felt that it best represented the typical patient flow each grantee experienced. Program-level costs are presented by grantee and not by service setting or implementation model for two reasons. First, grantees did not establish separate administrative programs for each setting served, but rather served multiple settings within a single administrative program. Thus, the modified SASCAP did not collect information that allowed costs to be separated by setting. Second, despite having a centralized administrative structure, several grantees used different implementation models for different service components in different settings making reliable allocation of centralized costs across setting and model impossible.
Results
Service-level costs
Service-level costs are presented in Table 2. The estimates suggest that service and support times vary among implementation models and settings. Mean times for screening ranged from 2.4 minutes in the CS outpatient model to 6.8 minutes in the IHS outpatient model. For screening support activities that were recorded, mean times ranged from 1.5 minutes in the CS outpatient model to 8.7 minutes in the CS inpatient model. For BI support activities, mean times were between 6.5–7 minutes, with the exception of the CS inpatient model that had a mean time of 10.3 minutes. BI service delivery time appeared to be lower in the CS ED model (mean time, 5.6 minutes), although this time estimate may be influenced by outliers on both the high end and the low end.
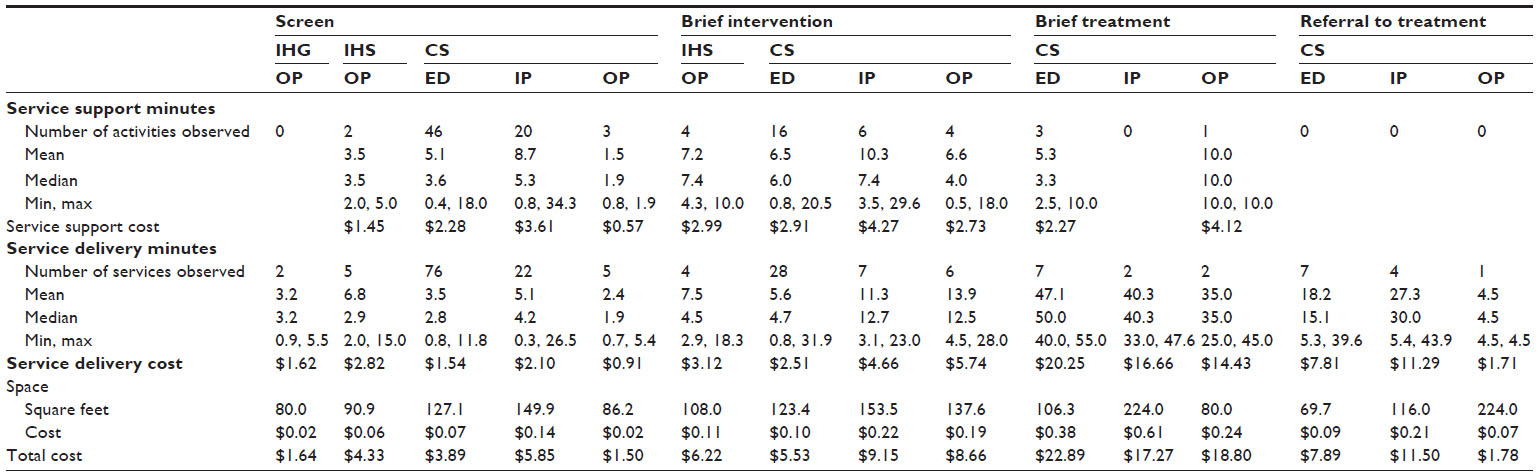 | Table 2 Service delivery costs |
We observed no BT-related support activities in the inpatient setting. In addition, all grantees implemented a CS model for BT services. Despite the possibility that the BT happened in a setting different than the screen, practitioner time and thus costs devoted to BT appear to vary across settings. Given the extremely small sample sizes, however, quantitative conclusions cannot be made.
The time and cost of RT also appear to vary across settings; although, small sample sizes prevent definitive conclusions. RT is conducted separately from other SBIRT activities and may be conducted by a different practitioner. RT often includes making detailed notes in the patient’s chart or a management information system, obtaining the patient’s permission to release private information, providing the patient information for the treatment provider, and making the initial contact or a first appointment for the patient. RT may, however, be combined with an assessment. Given the activities involved and that all patients receiving RT should be at elevated risk for dependence, it is unclear what would generate the differences across settings shown in Table 2.
Program-level average annual costs
Table 3 shows the estimated total annual program costs and cost per person screened for each grantee. Across all grantees, service delivery labor was the largest single contributor to annual operating costs, with FTEs ranging from 0.5 FTEs to nearly 3.5 FTEs per 1,000 screens. Service delivery labor costs accounted for more than one-half of all labor costs across all grantees and as much as 89% of costs in Grantee 7. For most grantees, quality assurance also accounted for a large portion of labor costs, with Grantee 5 being a notable exception. Grantee 5 relied on the local cost evaluation, which did not separate quality assurance from program administration, to complete the SASCAP. Thus, $0 is an underestimate of their quality assurance expenditures, and $231,248 is a commensurate overestimate of their program administration costs, so that the total cost estimate for Grantee 5 is comparable to those of the other grantees.
 | Table 3 Average annual program costs |
The average annual costs of SBIRT ranged from a low of $46.12 per person screened to a high of $293.15. Grantee 1 is clearly an outlier on the upper end of this range, with the next highest annual average cost being $86.81 in Grantee 7. Given the extent of this outlier, it is tempting to exclude Grantee 1 when drawing conclusions about program-level costs. A recent review of the costs of alcohol SBI,4 however, shows that similar costs have been reported in other studies, and so we have retained Grantee 1 in Table 3 despite its outlier status. Although there are too few grantees to allow strong conclusions, the cost estimates are consistent with potential economies of scale in that the cost per screen tends to decrease with the number of screens per year.
Discussion
Our findings highlight an important resource utilization finding; SBIRT practitioners may spend relatively large amounts of time on support activities relative to the time spent on service delivery. Although this may be true of many short-duration medical procedures, this is the first study to document the presence of such support activities for SBIRT. Support activities were observed in approximately 65% of screens and BIs, and so it is possible that support activities are not always necessary. However, some support activities may have been performed outside the purview of the observer. Thus, simply because support activities were not observed does not necessarily imply that no such activities occurred. As a result, our estimates most likely represent upper-bound estimates but, under certain circumstances, may underestimate support costs. Limitations of our data prevent definitive statements about the true extent to which support activities influence the cost of SBIRT, especially for BT and RT, but our findings suggest that they may be an important factor.
Results also suggest that setting may interact with workflow in complex ways to influence cost. For example, screen support and service delivery times for the CS model appear to vary with setting in that both activities took longer in ED and inpatient settings than in outpatient settings. Similarly, setting appears to play an integral role in CS time devoted to BI. Although support time is comparable across outpatient and ED settings, the time devoted to the BI is lower in EDs than in outpatient and inpatient settings. Patient flow may partially explain these differences. For example, the availability of patients in inpatient settings may facilitate longer service times, while heavy patient loads in high-volume settings, such as the ED, may dictate shorter service times.
When considering SBIRT program patient flow and goals more generally, the time allocated to BT – in relation to other SBIRT services – is an important consideration. Practitioners who provide a 1-hour BT session may forgo as many as 15 screens or five BIs. Patients who were unable to speak to a SBIRT practitioner immediately following a screen or BI may be discharged, transferred to another department, or otherwise not progress through the SBIRT process as needed.
Comparing average annual costs (Table 3) to the service delivery costs (Table 2) suggests the possibility of substantial fixed and quasifixed costs because the average annual costs are considerably higher than the service-level costs. Fixed costs are incurred once (or possibly annually) and do not vary with the number of staff or the number of individuals screened. Quasifixed costs vary with the number of staff employed rather than with the number of individuals screened. One possible quasifixed cost is the need to hire service delivery staff to cover predetermined periods of time (eg, 9 am–5 pm). In low-flow settings, this may cause substantial downtime for SBIRT practitioners in the CS or IHS models, which will cause the average cost of services to be higher than the service cost. As the number of patients per day increases, average cost will approach service cost until the patient flow is great enough to warrant hiring an additional practitioner.
Two important features of the data limit this analysis. First, and most obvious, the number of observations supporting the time estimates is very low for some services. Compounding the small sample sizes, the sampling procedure used to select locations in which to observe settings was not designed to support statistical inference. Rather, it was a purposive sample intended to be qualitatively representative of the services being provided by the grantees. The extent to which the sample of sites is statistically representative of all sites cannot be formally assessed, nor can the extent to which the limited number of observations represents all services provided within the sites.
To provide some information on the quality of the observation timing data, we compared our timing data to a variety of other available and relevant data sources. Two grantees conducted local time studies in which the time required to perform the services was recorded electronically. The distribution of timing data from our observations (ie, minimums, maximums, and quartiles) was well within the distribution of the timing data collected by the grantees. Means and medians were qualitatively similar, but the small sample sizes within grantees prohibit formal statistical assessments of validity or reliability. Practitioner interviews conducted by the evaluation team provided another source of service time estimates. Practitioners providing direct SBIRT services were asked to estimate the typical, minimum, and maximum time for each SBIRT service as well as any support activities required. These data were used to develop a qualitative assessment of the relative burden of various services (eg, screen relative to BI). Based on comparisons of our observation timing data to other data sources, we concluded that the observation data were of sufficient quality to inform the broader field. Nonetheless, our results should be viewed as suggestive of possible trends rather than as definitive estimates of specific costs.
A second key limitation applies to the program-level cost data. Consistent with cost studies conducted within research studies (eg, Zarkin et al;3 Kunz et al6), our program-level cost approach collected data at the administrative program level and attempted to separate the costs of being a SAMHSA discretionary grantee from the true costs of delivering SBIRT services. Collecting data at the administrative program-level prevented the separation of program-level costs by setting or implementation model.
Separating grant-specific costs from true service delivery costs requires an element of judgment and, thus, may result in some misclassification. Although some of these costs are obvious and easy to distinguish (eg, attendance at annual grantee meetings), others involve subtle differences in the level of effort and require respondents to allocate, sometimes imprecisely, documented costs to different activities. To provide some concreteness to these allocations, we anchored respondents to the context of their ongoing sustainability planning. For example, in helping a respondent to determine if the costs of taping all BI sessions were a valid cost of service delivery or a grant cost, we asked the respondent to consider if such taping was planned to continue past the end of grant funding. Some respondents had nearly complete sustainability plans. Others were only beginning their sustainability plans and were unsure of the extent to which those plans would actually be implemented when complete. Thus, the extent to which these sustainability plans provided a useful framework for distinguishing SBIRT costs from grant administration costs is variable across grantees. Nonetheless, we feel that the rubric of sustainability plans made resource use allocation decisions more concrete and, therefore, more accurate.
This paper presents estimated service delivery and annual average program costs of SBIRT. The costing methodology emphasized removing grant administration cost from the cost estimates so that the estimated costs would more closely approximate the costs of a sustained SBIRT program. In addition, the costing methodology used national estimates for unit costs, such as wages and space costs, so that differences across grantees and delivery models would be driven by differences in resource use rather than by differences in local prices. Results suggest that service support activities may be an important component of SBIRT service costs and that fixed and quasifixed costs of service delivery are potentially important considerations when contemplating SBIRT financing structures. Importantly, this complex cost structure suggests that the service delivery cost of SBIRT may be discontinuous in patient flow, causing the annual operating costs of a SBIRT program to exceed its narrowly defined service delivery costs.
Our results suggest several directions for future work. First, future SBIRT cost studies should be designed to account for the complex cost structures found here. Such designs would allow for replication or refutation of our conclusion regarding the extent of service support costs and the potential for substantial fixed and quasifixed costs. Such studies should also extend our work by conducting a true time-and-motion study and by better linking the resulting cost data to service provider characteristics. Such linkage would allow an assessment of the extent to which provider characteristics, such as professional training, experience with SBIRT services, or tenure in the host setting might influence service delivery costs. Second, studies should explore the implications of complex cost structures for the financing of SBIRT services. The service reimbursement financing provided by health insurance may not fully support the annual operating costs of a program if the reimbursement amount is based on the narrowly defined service delivery costs.12 Finally, future work should explore the implications of complex cost structures for the cost-effectiveness and cost-benefit of SBIRT services. By combing cost data with information on the effectiveness and benefits of SBIRT, future work can more fully explore the value to society of SBIRT programs.
Acknowledgments
Funding for the cross-site evaluation of the first cohort of SAMHSA SBIRT grantees was provided by SAMHSA/Center for Substance Abuse Treatment (CSAT) via a contract to JBS International, contract 270-03-1000/270-03-1007, with subcontracts to RTI International, the University of Connecticut Health Center (UCHC), and The Avisa Group. Dr Jeremy W Bray at RTI International was the principal investigator and project director of the cross-site evaluation and had final responsibility for all scientific, design, and methodological decisions. Dr Thomas Babor at UCHC was senior scientific advisor and advised Dr Jeremy W Bray on scientific, design, and methodological decisions. Dr Susan Hayashi was officer in charge and had final authority for all contractual issues. She also contributed to the development of the evaluation design and the execution of data collection and analysis. Dr Bonnie McRee was director of the UCHC subcontract and contributed to the development of the evaluation design and the execution of data collection and analysis. Dr Suzanne Gelber was director of The Avisa Group subcontract and contributed to the development of the evaluation design and the execution of data collection and analysis. Project officers at SAMHSA/CSAT were Dr Kevin Mulvey, Dr Andrea Kopstein, Dr Laura House, and Mr Willie Tompkins.
Other RTI International contributors are Georgia Karuntzos, Jamie Stiller, Zachary Wilcox, Amy Hernandez, Johannes Norling, Brendan Wedehase, John Shadle, Robyn Linford, Erin Mallonee, and Carolina Barbosa.
Other JBS International contributors are Manu Singh, Jennifer Kasten, Amanda Gmyrek, Erika Olson Tait, Hayley Pines, Homa Nusraty, Kazi Ahmed, Gail Bassin, and Debbie Churgai.
Other UCHC contributors are Frances Del Boca and Donna Damon.
Other CSAT/SAMHSA contributors are H Westley Clark, Robert Atanda, Deepa Avula, Mady Chalk, Herman Diesenhaus, Joan Dilonardo, Karl Maxwell, Jack Stein, Reed Forman, Erich Kleinschmidt, and Tom Stegbauer.
Disclosure
The authors report no conflicts of interest in this work.
References
Aalto M, Pekuri P, Seppä K. Primary health care professionals’ activity in intervening in patients’ alcohol drinking during a 3-year brief intervention implementation project. Drug Alcohol Depend. 2003;69(1):9–14. | |
Moyer A, Finney JW. Brief interventions for alcohol problems: factors that facilitate implementation. Alcohol Res Health. 2004; 28(1):44–50. | |
Zarkin GA, Bray JW, Davis KL, Babor TF, Higgins-Biddle JC. The costs of screening and brief intervention for risky alcohol use. J Stud Alcohol. 2003;64(6):849–857. | |
Bray JW, Zarkin GA, Hinde JM, Mills MJ. Costs of alcohol screening and brief intervention in medical settings: a review of the literature. J Stud Alcohol Drugs. 2012;73(6):911–919. | |
Gentilello LM, Ebel BE, Wickizer TM, Salkever DS, Rivara FP. Alcohol interventions for trauma patients treated in emergency departments and hospitals: a cost benefit analysis. Ann Surg. 2005;241(4): 541–550. | |
Kunz FM, French MT, Bazargan-Hejazi S. Cost-effectiveness analysis of a brief intervention delivered to problem drinkers presenting at an inner-city hospital emergency department. J Stud Alcohol. 2004;65(3):363–370. | |
Broskowski A, Smith S. Estimating the Cost of Preventive Services in Mental Health and Substance Abuse Under Managed Care. Rockville, MD: Center for Mental Health Services, Substance Abuse and Mental Health Services Administration; 2001. Available from: http://store.samhsa.gov/shin/content/SMA02-3617R/SMA02-3617R.pdf. Accessed June 20, 2014. | |
Zarkin G, Dunlap L, Homsi G. The substance abuse services cost analysis program (SASCAP): a new method for estimating drug treatment services costs. Eval Program Plann. 2004;27(1):35–43. | |
US Department of Labor [homepage on the Internet]. Washington, DC: Occupational Employment Statistics; 2009. Available from: http://www.bls.gov/oes/current/oes_stru.htm#31-0000. Accessed May 14, 2009. | |
Grubb and Ellis Realty Advisors, Inc. Metro office trends. 2007. Available at: http://www.grubb-ellis.com/Research/. Accessed February 12, 2009. | |
Service Accountability Improvement System. Government Performance and Results Act Data. 2009. Available at: https://www.samhsa-gpra.samhsa.gov/ Accessed October 23, 2009. | |
Cowell AJ, Dowd WN, Mills MJ, Hinde JM, Bray JW. SBIRT in the wild: simulating revenues and costs for programs whose SAMHSA grant funding has ended. Addiction. In press 2014. |
 © 2014 The Author(s). This work is published and licensed by Dove Medical Press Limited. The
full terms of this license are available at https://www.dovepress.com/terms
and incorporate the Creative Commons Attribution
- Non Commercial (unported, 3.0) License.
By accessing the work you hereby accept the Terms. Non-commercial uses of the work are permitted
without any further permission from Dove Medical Press Limited, provided the work is properly
attributed. For permission for commercial use of this work, please see paragraphs 4.2 and 5 of our Terms.
© 2014 The Author(s). This work is published and licensed by Dove Medical Press Limited. The
full terms of this license are available at https://www.dovepress.com/terms
and incorporate the Creative Commons Attribution
- Non Commercial (unported, 3.0) License.
By accessing the work you hereby accept the Terms. Non-commercial uses of the work are permitted
without any further permission from Dove Medical Press Limited, provided the work is properly
attributed. For permission for commercial use of this work, please see paragraphs 4.2 and 5 of our Terms.