Back to Journals » Pharmacogenomics and Personalized Medicine » Volume 13
Prognostic Values of Radiosensitivity Genes and CD19 Status in Gastric Cancer: A Retrospective Study Using TCGA Database
Authors Liang LB ![]() , Huang XY
, Huang XY ![]() , He H
, He H ![]() , Liu JY
, Liu JY ![]()
Received 10 June 2020
Accepted for publication 11 August 2020
Published 8 September 2020 Volume 2020:13 Pages 365—373
DOI https://doi.org/10.2147/PGPM.S265121
Checked for plagiarism Yes
Review by Single anonymous peer review
Peer reviewer comments 3
Editor who approved publication: Dr Martin H Bluth
Libo Liang,1,* Xinyan Huang,2,* He He,3 Ji-Yan Liu4
1Department of International Medical Centre, West China Hospital, Sichuan University, Chengdu 610041, Sichuan Province, People’s Republic of China; 2West China School of Stomatology, Sichuan University, Chengdu 610041, Sichuan Province, People’s Republic of China; 3Department of Laboratory Medicine, West China Hospital, Sichuan University, Chengdu 610041, Sichuan Province, People’s Republic of China; 4Department of Biotherapy, West China Hospital, Sichuan University, Chengdu 610041, Sichuan Province, People’s Republic of China
*These authors contributed equally to this work
Correspondence: Ji-Yan Liu Email [email protected]
Background: The correlation between the radiosensitivity genes combined with CD19 status and clinical outcome was investigated to identify gastric cancer (GC) patients who would benefit from radiotherapy combined with CAR-T cell therapy.
Methods: The gene expression and clinical features were downloaded from The Cancer Genome Atlas (TCGA) Stomach Cancer (STAD). To identify the hub radiosensitivity genes and CD19 status, 407 patients were categorized into two groups: radiosensitivity (RS) and radioresistance (RR) based on the prognosis. The chi-square test, Mann–Whitney test, and Kaplan–Meier survival analysis were applied to compare the differential expression in these groups and analyze the correlation between the gene expression and clinical outcome and features. Finally, the influencing factors for the prognosis of GC were investigated by multiple Cox regression, especially in RS patients.
Results: A total of 15 differential expression genes, containing two communities with 8 hub radiosensitivity genes, were identified. We also identified a 2-gene signature model with a negative coefficient and calculated the risk score for the prognosis of GC. Also, Helicobacter pylori infection was validated, and the high-risk score of radiosensitivity genes was the risk factor, and high CD19 expression was the protective factor for the prognosis.
Conclusion: The radiosensitivity gene signature and CD19 expression predicted the clinical outcome of GC patients.
Keywords: gastric cancer, radiosensitivity genes, CAR-T cell therapy, TCGA database
Introduction
Gastric cancer (GC) is associated with high morbidity and mortality rates worldwide, ranking as the fourth most common cancer worldwide and the second leading cause of cancer-related deaths.1 The dismal prognosis results from rare individualized precision diagnosis and treatment.2 In recent years, an increasing number of studies have demonstrated that the genetic background was associated with the occurrence and prognosis of GC.3 For unresectable GC, radiotherapy is the primary locoregional treatment. Nonetheless, several patients failed radiotherapy due to intrinsic or acquired resistance of tumor cells to radiotherapy and nonspecific toxicity to the mucosa and surrounding normal gastric tissues.4 Several studies have shown that the effect of radiotherapy on the survival rate of patients with GC is controversial. Therefore, it is essential to find the potential innovative therapeutic strategies, such as specific immunotherapy combined with traditional therapy for beneficial progress.5,6
Although there are no immunotherapies, including the immune checkpoint inhibitors (PDL-1), chimeric antigen rector (CAR)-T cells, and tumor vaccines, for GC that has been put into clinical use, cancer immunotherapies have received considerable attention as a viable treatment option for GC.7 CD19 is the primary target for CAR-T,8 an innovative treatment protocol to improve the overall survival (OS), and the quality of life of patients.9 In this study, we focused on the prediction of the prognosis of GC with respect to the genes of radiosensitivity and CD19 status and aimed to evaluate the influencing factors for the prognosis of GC.
Materials and Methods
Data Resources
We downloaded GC-related gene expression array profiles, phenotype, and survival time from the Cancer Genome Atlas (TCGA) Stomach Cancer (STAD) of the UCSC Xena website (https://xenabrowser.net/datapages/) to assess the survival analysis and construct the prognosis model. We enrolled 407 samples, and after deleting invalid data, we analyzed 351 samples. The flowchart of this study is shown in (Supplementary material Fig. S1). Furthermore, we performed the external validation based on Gene Expression Omnibus (GEO) database (https://www.ncbi.nlm.nih.gov/geo/). GSE84437 datasets consisted of GC and paracancerous non-tumor tissues, and 433 samples were included for further analysis. All the data analyses were conducted in the R software (version 3.6.0).
Radiosensitivity Gene Signatures
We selected the gene signatures implicated in clinical, cellular, and tumor cell radiosensitivity.10 The “ConsensusClusterPlus” package of R was applied to Partitioning Around Medoid (PAM) to cluster the patients into two groups with k=2 based on the gene expression profile.11 The two clusters were generated without any labels because of PAM, an unsupervised machine learning algorithm. Next, the clinical outcomes were compared between clusters to define the RS as better DFI than RR.12 The “survfit” package and “survdiff” package in R created the Kaplan–Meier survival curves and assessed the difference between the curves of the two groups, respectively; the significant difference was set at P-value <0.05.
The screening cutoff for differential expression gene (DEGs) of TCGA was |Log fold change| > 1.5 and adjusted P-value < 0.05 (corresponding to -log10 (adjusted P-value)>1.30), and analyzed by the “limma” package of R.13 The Volcano plot and heatmap showed the DEGs of the tumor tissues and adjacent tumor tissues. The Venn diagrams showed the intersection of DEGs and gene signatures of radiosensitivity (http://bioinfogp.cnb.csic.es/tools/venny/index.html).
We used the R package “clusterProfiler”14 to explore the biological functions, and “Goplot”15 facilitated the visualization of the results in Gene Ontology (GO), including biological processes (BP), cellular components (CC), and molecular features (MF). Also, the top 10 enrichment pathways were displayed.
CD19 Status
The chi-square test and Mann–Whitney test evaluated the differences in the clinicopathological characteristics and the expression levels of CD19 between the RR and RS groups, respectively. The heatmap with annotations verified the radiosensitivity and CD19 status.
Prognosis Risk Model Establishment
To further explore the association between prognosis and radiosensitivity genes expressions and clinicopathological features. We construct the risk score models through univariate and multivariate stepwise Cox analysis. According to the median score of the risk score model, samples divided into a high-risk group and low-risk group. The “survfit” package created the Kaplan–Meier survival curves for the disease-free interval (DFI), meaning for patients having new tumor events, whether it is a local recurrence, distant metastasis, new primary tumor of the cancer.16 The difference between curves of the two groups compared by “survdiff” package in R, and the statistical difference was P-value <0.05.
External Validation
According to the median score of the risk score model, samples were divided into high-risk and low-risk groups. The “survfit” package created the Kaplan–Meier survival curves for OS and compared the survival probability of the two groups.
Results
Validation of Hub Genes for Radiosensitivity
We clustered the datasets into two groups, including radioresistant (RR, n=201) and radiosensitive (RS, n=150) (Figure 1A). The tracking plot (Supplementary material Fig. S2a) showed that the clustering analysis based on k=2 was stable, and the cluster-consensus plot (Supplementary material Fig. S2b) showed that the clustering effect based on the mean of pairwise consensus values is balanced in the two clusters. The survival rate of patients with radiotherapy was significantly higher than of those without radiotherapy (P=0.006, Figure 1B). In the patients with radiotherapy, compared to RR, the survival rate of DFI in RS was significantly higher (P=0.0255, Figure 1C), but no significant difference was detected in non-RT (P=0.8468, Figure 1D). These results showed that radiosensitivity and the therapeutic effect of radiotherapy might be affected by the related genes, and hence, we explored the hub genes for radiotherapy.
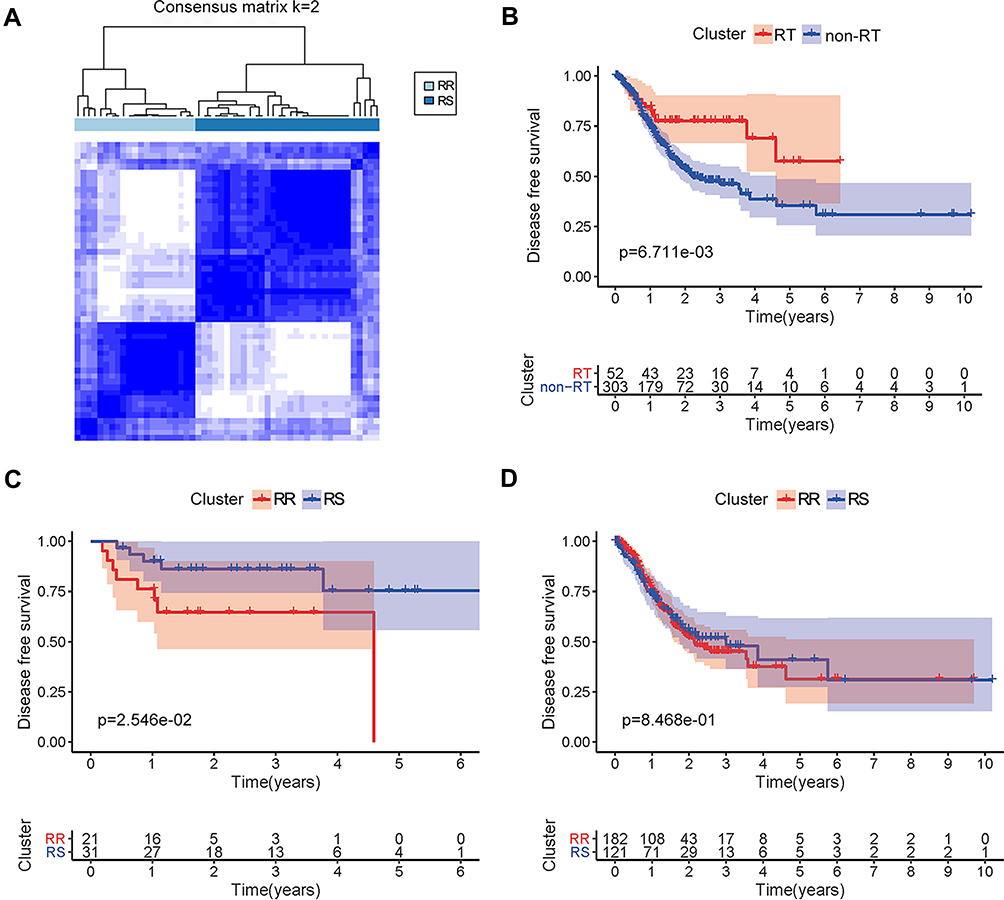 |
Figure 1 The survival analysis of DFI based on radiotherapy and radiosensitivity. (A) The datasets were clustered into two groups via consensus clustering. Moreover, cluster 1 presents the RR, and cluster 2 presents the RS via comparison of the DFI. (B) The survival rate of DFI was compared between the patients undergoing or not radiotherapy. The red line represents the survival rate of patients undergoing radiotherapy, and the blue line represents the survival time of patients without radiotherapy. (C) The survival rate of DFI in patients with radiotherapy and cluster RR are represented by red line as compared to RS represented by the blue line. (D) The survival rate of DFI in the patients without radiotherapy, also cluster RR, is represented by red line as compared to RS represented by the blue line. Abbreviations: DFI, disease-free interval; RT, radiotherapy; RR, radioresistant; RS, radiosensitivity. |
Compared to the adjacent tumor tissues, there were 135 upregulated and 264 downregulated genes in gastric tumor tissues (Figure 2A). Also, 15 radiosensitivity genes included CDK1 (cyclin-dependent kinases 1), MMRN1 (recombinant multimerin 1), GDF15 (growth differentiation factor 15), CLDN1 (recombinant claudin 1), PLK1 (polo-like kinase 1), AURKA (aurora kinase A), KLF4 (Krüppel-like factor 4), SPARC (secreted protein acidic and rich in cysteine), SPP1 (secreted phosphoprotein 1), SERPINE1 (serpin family E member 1), CXCL8 (CXC motif chemokine ligand 8), FBLN1 (Fibulin 1), CLU (clusterin gene), GSTA1 (glutathione S-transferase alpha 1), and LTF (lactotransferrin) with differential expression in GC (Figure 2B). The heatmap also verified the status of these DEGs with respect to radiosensitivity in adjacent tumor tissues and gastric tumor tissues (Figure 2C).
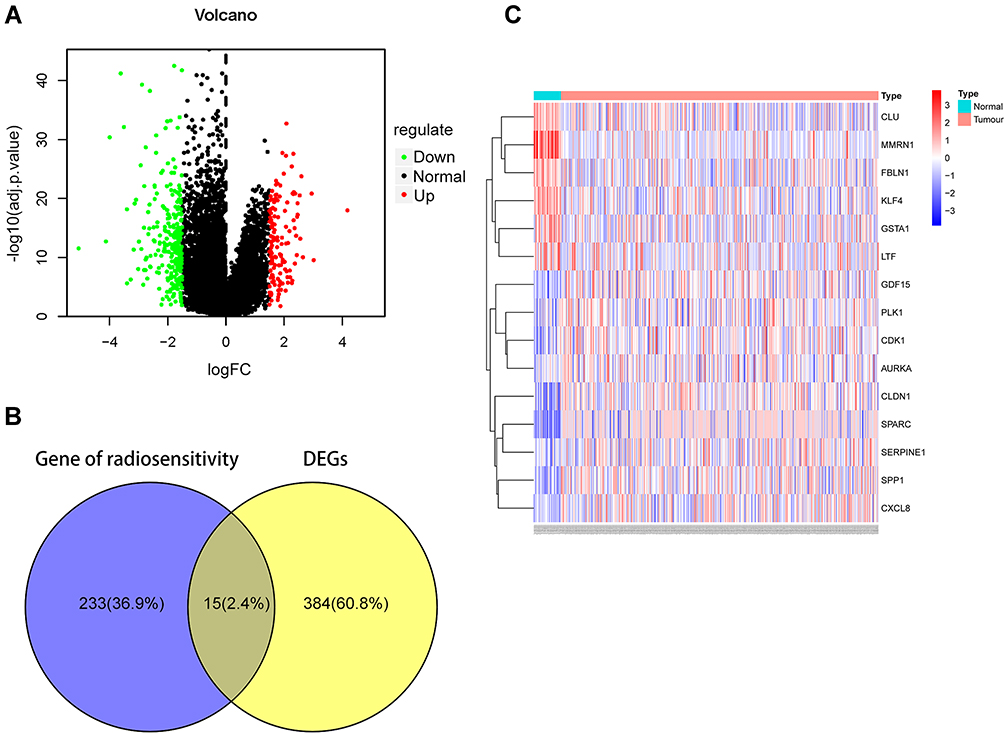 |
Figure 2 The DEGs of radiosensitivity in gastric cancer. (A) Volcano diagram for differential expression genes in GC. 135 upregulated genes shown as red plots and 264 downregulated genes displayed as green plots. (B) Venn diagram of DEGs in GC and radiosensitivity showed the differential expressed genes of radiosensitivity accounted for 2.3% in GC. (C) Heatmap of DEGs in GC. Abbreviation: DEGs, differential expression genes. |
Furthermore, we analyzed the biological functions of the target genes. The biological processes mainly included enriched regeneration, response to lipopolysaccharide, response to molecule of bacterial origin and antibiotic, associated cell components present in the extracellular matrix, and molecular functions in extracellular matrix structural constituent (Figure 3A). The GO chord plot and cluster plot displayed the correlations between the DEGs of radiosensitivity, ranked by the logFC and GO terms (Figure 3B and C). The protein–protein interaction (PPI) and the molecular complex detection (MOCDE) displayed two central communities in these differentially expressed radiosensitivity genes in GC: five and three genes, respectively (Figure 3D).
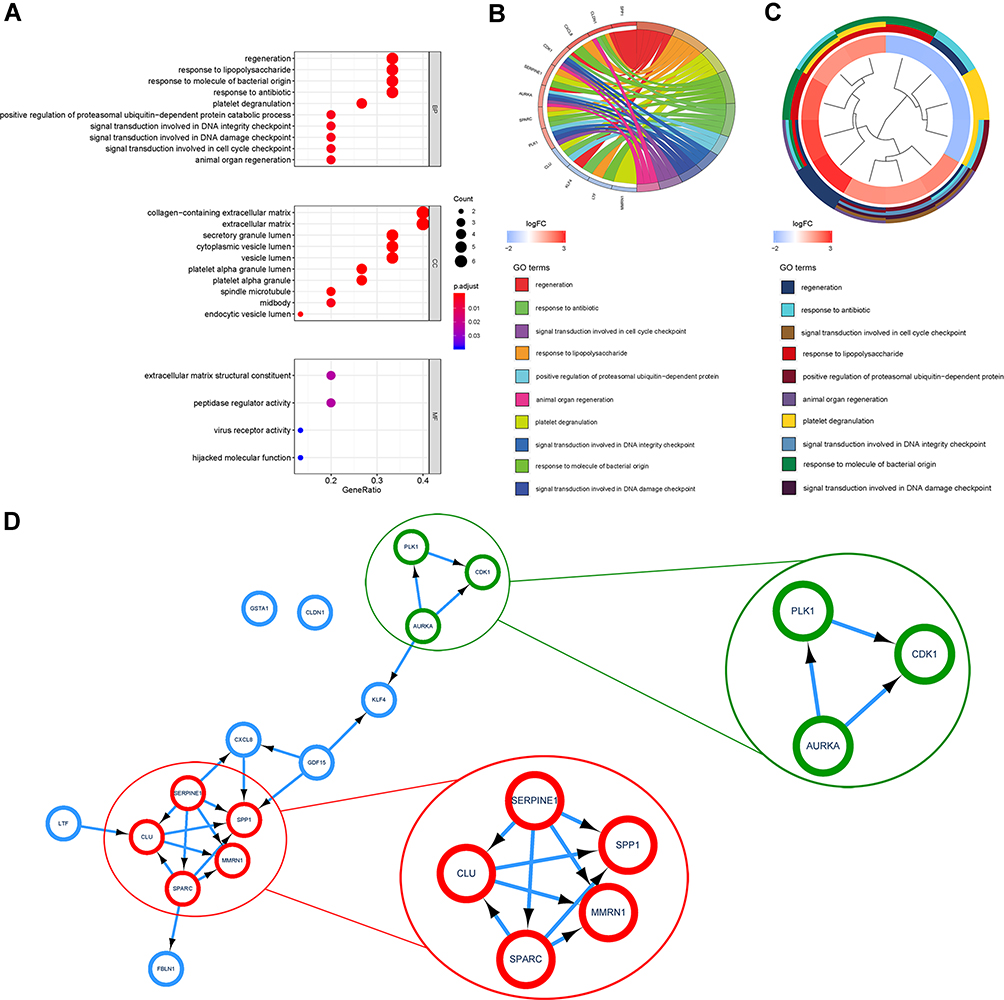 |
Figure 3 Enrichment analysis of the DEGs of radiosensitivity in GC. (A) Bubble chart displayed the top 10 BP, CC, and MF. (B) GO chord plot showed the correlation between ranked radiosensitivity genes and GO terms. (C) GO cluster plot showed a circular dendrogram of the clustering of the logFC and the assigned functional terms. (D) PPI and MCODE analysis showed two communities containing five genes in a red module and three genes in the green module. The red module is comprised of five hub genes, SERPINE1, SPP1, MMRN1, SPARC, and CLU, and the green module consists of three hub genes, PLK1, CDK1, and AURKA. Abbreviations: BP, biological process; CC, cellular component; MF, molecular function; PPI, protein–protein interaction; MCODE, molecular complex detection. |
Identification of the CD19 Status
The status of CD19 differed markedly in the RR and RS groups. In high CD19 group, the proportion of RR was 41.4% (n=65) and that for RS (n=92) was 58.6%, whereas in the low CD19 group, the proportion of RR was 68.24% (n=101) and that for RS (n=47) was 31.76% (P<0.001). Similarly, the expression of CD19 was significantly higher in RS than in RR (Supplementary material Fig. S3a). The heatmap shows the expression of the radiosensitivity gene signatures and clinicopathological variables in the RR and RS groups. Also, a significantly different expression of CD19 was observed in the RR and RS groups (Fig. S3b).
Prognostic Role of Radiosensitivity Genes and CD19 Status in GC
To investigate the effect of radiosensitivity genes and CD19 status on gastric prognosis, we performed Cox univariate analysis (Figure 4A). The risk signature was established by selecting SPARC, AURKA, SERPIN E1, and CDK1, and the risk scores of GC patients were calculated using the LASSO Cox regression model; finally, the 2-gene model was obtained: (−0.3376)×AURKA+(−0.1868)×CDK1. According to the median risk score, patients were divided into low- and high-risk groups. The OS rate of the high-risk group was significantly lower than that of the low-risk group (Figure 4B, P<0.001), and the 5-year OS rate was 0.56% in the high-risk group and 7.3% (P=0.0015) in the low-risk group.
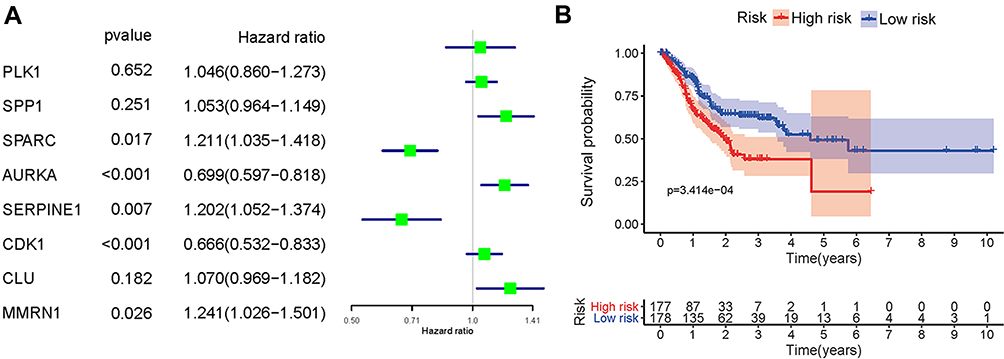 |
Figure 4 Effect of radiosensitivity genes in GC contributing to the prognosis. (A) Cox univariate analysis of radiosensitivity genes showed that SPARC, SERPINE1, and MMRN1 were the risk factors, while AURKA and CDK1 were the protective factors of the prognosis. (B) Correlation between the risk score and the OS of GC patients showed that the survival probability in the low-risk group was higher than that in the high-risk group. |
The heatmap shows the expression of the two selected radiosensitivity genes combined with CD19 status and clinicopathological variables in the high- and low-risk groups. However, no significant difference was detected in the variables between the two groups (Figure 5A). Furthermore, we used stepwise Cox multivariate analyses to determine whether the risk signature was an independent predictor. Multivariate analyses showed that the patients’ age, female gender, M stage, Helicobacter pylori infection, CD19 expression, and the risk score of hub radiosensitivity genes were significantly related to OS (Figure 5B). While in RS, multivariate analyses showed that only Helicobacter pylori infection, family history, CD19 expression, and the risk score of hub radiosensitivity genes were significantly related to OS (Figure 5C). These findings suggested that the risk signature and CD19 are influencing factors for GC patients and can independently predict the prognosis of the disease.
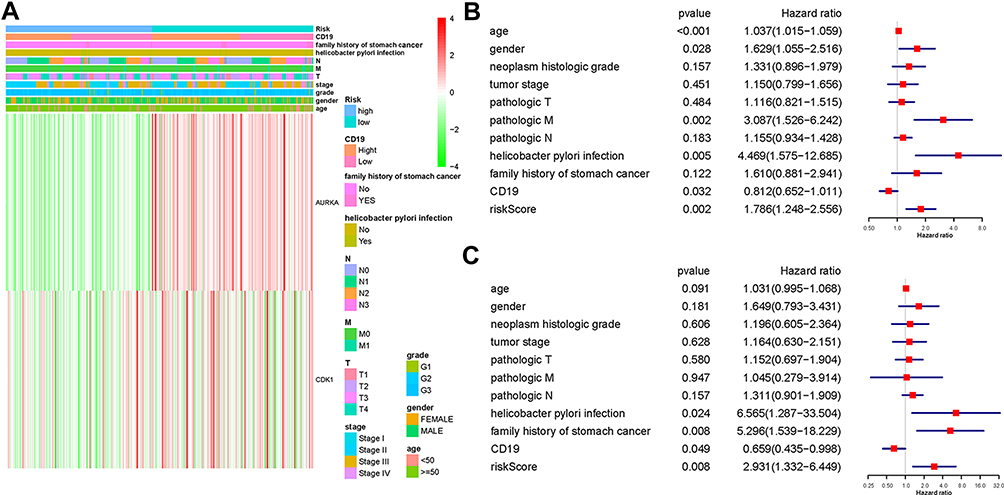 |
Figure 5 Effects of radiosensitivity genes and clinicopathological variables on the prognosis of GC patients. (A) The heatmap shows the expression of two hub radiosensitivity genes and the distribution of clinicopathological variables between the high- and low-risk groups. Both genes were highly expressed in the low-risk group and lowly expressed in the high-risk group. (B and C) Cox multivariate analyses of clinicopathological variables and OS in all patients (B) and in RS cluster (C) shows that Helicobacter pylori infection, family history, and risk score of hub radiosensitivity genes in GC are the risk factors and the CD19 expression was the protective factor of prognosis. |
External Validation Based on GEO Datasets
In order to ensure the comparability of the results, we downloaded the dataset (GSE84437) from GEO database for external validation. The survival analysis based on the risk score of the 2-gene signature showed that the survival probability in low-risk score was significantly higher than that in the high-risk score (Fig. S4a). The expression of CKD1 and AURKA in GSE84437 dataset was similar to that in TCGA, indicating radiosensitivity in the low-risk group. Also, a significant difference was noted in the T stage of GC, indicating that T stage was high in the high-risk group (Fig. S4b).
Discussion
The TCGA dataset GC (STAD) described a set of gene signatures that reflected radiosensitivity, and the result suggested that a 2-gene model could be a predictive marker for the response of these patients to RT. We also investigated the correlation between CD19 status, radiosensitivity genes, clinicopathological features, and prognosis of GC. These studies, for the first time, demonstrated the correlation between radiosensitivity and CD19 status of GC patients and identified the potential factors that affect survival.
Firstly, we applied unsupervised learning to divide the dataset into two groups and used DFI to determine RR and RS. The results showed that the patients in RS treated with RT provided a better DFI rate than those in RR, indicating that the radiosensitivity genes might be related to the therapeutic effect of GC. This result was similar in breast cancer and glioblastoma multiforme.17,18 Next, we investigated the patients and tumor features to identify the hub of radiosensitivity genes. Although the trend of gene expression differed in the high- and low-risk groups, no statistical correlation was established between the expression of single-gene and clinical characteristics.
To further explore the prediction and influencing factors of the prognosis of GC patients, we combined the clinical variables, CD19 status, and the expression of hub radiosensitivity genes expressions. The therapeutic effects of radiation arise from triggering the immunological response in the tumor microenvironment by inducing interferon-gamma and the activation of T cells.19,20 Reportedly, in preclinical studies, this treatment ignites an adaptive anti-tumor immunity, known as the “abscopal effect”21 CAR-T cell therapy is one of the most promising approaches for malignant tumors, and the FDA (food and drug administration) has approved it for relapsed/refractory acute lymphoblastic leukemia.22 Recent studies have been directed at examining the efficacy of CAR-T therapy in gastrointestinal tumors.23 CD19 is the target of CAR-T therapy, and hence, we focused on the prognosis of GC patients, especially in RS. Hitherto, no studies have been reported regarding the radiosensitivity and CD19 status of GC. After adjusting the parameters, the multiple Cox regression model showed that CD19 was a protective factor, especially in RS.
Similarly, the risk score calculated by the 2-radiosensitivity genes model was the risk factor, but considering they had a negative coefficient, we ascribed it to be positive. Several studies showed that CDK1 inhibits cell proliferation and enhances the radiosensitivity in cancers.24–26 CDK1-encoding proteins drive the cell cycle by phosphorylation of Ser/Thr proteins.27 The potential mechanism enhances the radiosensitivity of cancer cells related to homologous recombination repair28 and genomic stability.29 In different cancer types, AURKA drives radiosensitization from chromosomal missegregation on tripolar mitotic spindles.30 Both the genes showed a favorable function on radiotherapy treated as RS genes. However, the mechanism of radiosensitivity in GC needs to be explored further.
We speculated that the patients with high expression of CD19 consist of several immunogenic tumors before radiotherapy, inducing a robust adaptive immune response, which is associated with enhanced GC survival.7 Especially in RS, RT promotes immunological response in the tumor microenvironment, enhancing the eradication of the tumor cells to extend the rate of OS.31 However, the crosstalk between radiosensitivity genes and CD19 status needs to be confirmed by further experiments and clinical trials.32
Conclusion
In conclusion, we first validated the predictive value of radiosensitivity genes in GC patients undergoing RT in the TCGA dataset and also deduced the correlation between these gene models and CD19 status. Furthermore, we found that the radiosensitivity gene signature and CD19 expression were significant influencing factors for the clinical outcome of GC patients and may be used for selecting patients who will benefit from RT combined with CAR-T cell therapy. We also showed that CD19-high-RS patients had improved outcome, suggesting that these patients may potentially benefit from RT combined with CAR-T.
Ethics approval
This article does not contain any studies with human participants performed by any of the authors.
Author Contributions
All authors made substantial contributions to conception and design, acquisition of data, or analysis and interpretation of data; took part in drafting the article or revising it critically for important intellectual content; agreed to submit to the current journal; gave final approval of the version to be published; and agree to be accountable for all aspects of the work.
Disclosure
The authors report no conflicts of interest for this work.
References
1. G S, G V, V F, et al. Mast cells, angiogenesis and lymphangiogenesis in human gastric cancer. Int J Mol Sci. 2019;20(9).
2. Lott PC, Carvajal-Carmona LG. Resolving gastric cancer aetiology: an update in genetic predisposition. Lancet Gastroenterol Hepatol. 2018;3(12):874–883. doi:10.1016/S2468-1253(18)30237-1
3. Van Cutsem E, Sagaert X, Topal B, Haustermans K, Prenen H. Gastric cancer. Lancet. 2016;388(10060):2654–2664. doi:10.1016/S0140-6736(16)30354-3
4. Hartgrink H, Jansen EP, van Grieken NC, van de Velde CJ. Gastric cancer. Lancet. 2009;374(9688):477–490. doi:10.1016/S0140-6736(09)60617-6
5. Niccolai N, A A, Prisco D, A A. Gastric cancer and the epoch of immunotherapy approaches. World J Gastroenterol. 2015;21(19):5778–5793. doi:10.3748/wjg.v21.i19.5778
6. E N, D P, De MM, A A. What is recent in pancreatic cancer immunotherapy? Biomed Res Int. 2013;2013:492372.
7. Yang L, Wang Y, Wang H. Use of immunotherapy in the treatment of gastric cancer. Oncol Lett. 2019;18(6):5681–5690. doi:10.3892/ol.2019.10935
8. Katoh M, Katoh M. Precision medicine for human cancers with Notch signaling dysregulation (Review). Int J Mol Med. 2020;45(2):279–297. doi:10.3892/ijmm.2019.4418
9. Goebeler ME, Bargou R. Blinatumomab: a CD19/CD3 bispecific T cell engager (BiTE) with unique anti-tumor efficacy. Leuk Lymphoma. 2016;57(5):1021–1032. doi:10.3109/10428194.2016.1161185
10. A A, Bagos PG, Koutsandrea V, Georgakilas G. Molecular determinants of radiosensitivity in normal and tumor tissue: a bioinformatic approach. Cancer Lett. 2017;403:37–47. doi:10.1016/j.canlet.2017.05.023
11. A A, Fortunato S. Consensus clustering in complex networks. Sci Rep. 2012;2:336. doi:10.1038/srep00336
12. Jang B, Kim I. A radiosensitivity gene signature and PD-L1 status predict clinical outcome of patients with glioblastoma multiforme in the cancer genome atlas dataset. Cancer Res Treatment. 2020;52(2):530–542. doi:10.4143/crt.2019.440
13. Ritchie ME, Phipson B, Wu D, et al. limma powers differential expression analyses for RNA-sequencing and microarray studies. Nucleic Acids Res. 2015;43(7):e47. doi:10.1093/nar/gkv007
14. Yu G, Wang L-G, Han Y, He Q-Y. clusterProfiler: an R package for comparing biological themes among gene clusters. Omics. 2012;16(5):284–287. doi:10.1089/omi.2011.0118
15. W W, Sánchez-Cabo F, Ricote M. GOplot: an R package for visually combining expression data with functional analysis. Bioinformatics. 2015;31(17):2912–2914. doi:10.1093/bioinformatics/btv300
16. Liu J, Lichtenberg T, Hoadley K, et al. An integrated TCGA pan-cancer clinical data resource to drive high-quality survival outcome analytics. Cell. 2018;173(2):400–416.e411.
17. Bs J, Ia K. A radiosensitivity gene signature and PD-L1 status predict clinical outcome of patients with glioblastoma multiforme in the cancer genome atlas dataset. Cancer Res Treatment. 2019.
18. Jang B-S, Kim IA. A radiosensitivity gene signature and PD-L1 predict the clinical outcomes of patients with lower grade glioma in TCGA. Radiotherapy Oncol. 2018;128(2):245–253. doi:10.1016/j.radonc.2018.05.003
19. Burnette B, Liang H, Lee Y, et al. The efficacy of radiotherapy relies upon induction of type i interferon-dependent innate and adaptive immunity. Cancer Res. 2011;71(7):2488–2496. doi:10.1158/0008-5472.CAN-10-2820
20. Lee Y, Auh SL, Wang Y, et al. Therapeutic effects of ablative radiation on local tumor require CD8+ T cells: changing strategies for cancer treatment. Blood. 2009;114(3):589–595. doi:10.1182/blood-2009-02-206870
21. Lugade AA, Moran JP, Gerber SA, Rose R, Frelinger JG, Lord EM. Local radiation therapy of B16 melanoma tumors increases the generation of tumor antigen-specific effector cells that traffic to the tumor. J Immunol. 2005;174(12):7516–7523. doi:10.4049/jimmunol.174.12.7516
22. Brudno JN, Kochenderfer JN. Recent advances in CAR T-cell toxicity: mechanisms, manifestations and management. Blood Rev. 2019;34:45–55. doi:10.1016/j.blre.2018.11.002
23. Kruger S, M M, Kobold S, et al. Advances in cancer immunotherapy 2019 - latest trends. J Exp Clin Cancer Res. 2019;38(1):268. doi:10.1186/s13046-019-1266-0
24. Liu H, Tan H, Lin Y, Xu B, Zhao W, Xie Y. MicroRNA-1271-5p inhibits cell proliferation and enhances radiosensitivity by targeting CDK1 in hepatocellular carcinoma. J Biochem. 2020;167(5):513–524. doi:10.1093/jb/mvz114
25. Wang J, Chang L, Lai X, et al. Tetrandrine enhances radiosensitivity through the CDC25C/CDK1/cyclin B1 pathway in nasopharyngeal carcinoma cells. Cell Cycle. 2018;17(6):671–680. doi:10.1080/15384101.2017.1415679
26. Fu S, Jin L, Gong T, et al. Effect of sinomenine hydrochloride on radiosensitivity of esophageal squamous cell carcinoma cells. Oncol Rep. 2018;39(4):1601–1608. doi:10.3892/or.2018.6228
27. Prevo R, Pirovano G, Puliyadi R, et al. CDK1 inhibition sensitizes normal cells to DNA damage in a cell cycle dependent manner. Cell Cycle. 2018;17(12):1513–1523. doi:10.1080/15384101.2018.1491236
28. Wei D, Parsels L, Karnak D, et al. Inhibition of protein phosphatase 2A radiosensitizes pancreatic cancers by modulating CDC25C/CDK1 and homologous recombination repair. Clin Cancer Res. 2013;19(16):4422–4432. doi:10.1158/1078-0432.CCR-13-0788
29. Neganova I, Tilgner K, Buskin A, et al. CDK1 plays an important role in the maintenance of pluripotency and genomic stability in human pluripotent stem cells. Cell Death Dis. 2014;5:e1508. doi:10.1038/cddis.2014.464
30. Orth M, Unger K, Schoetz U, Belka C, Lauber K. Taxane-mediated radiosensitization derives from chromosomal missegregation on tripolar mitotic spindles orchestrated by AURKA and TPX2. Oncogene. 2018;37(1):52–62. doi:10.1038/onc.2017.304
31. Tchou J, Zhao Y, Levine L, et al. Safety and efficacy of intratumoral injections of chimeric antigen receptor (CAR) T cells in metastatic breast cancer. Cancer Immunol Res. 2017;5(12):1152–1161. doi:10.1158/2326-6066.CIR-17-0189
32. Zhao W, Jia L, Zhang M, et al. The killing effect of novel bi-specific Trop2/PD-L1 CAR-T cell targeted gastric cancer. Am J Cancer Res. 2019;9(8):1846–1856.
 © 2020 The Author(s). This work is published and licensed by Dove Medical Press Limited. The
full terms of this license are available at https://www.dovepress.com/terms
and incorporate the Creative Commons Attribution
- Non Commercial (unported, 3.0) License.
By accessing the work you hereby accept the Terms. Non-commercial uses of the work are permitted
without any further permission from Dove Medical Press Limited, provided the work is properly
attributed. For permission for commercial use of this work, please see paragraphs 4.2 and 5 of our Terms.
© 2020 The Author(s). This work is published and licensed by Dove Medical Press Limited. The
full terms of this license are available at https://www.dovepress.com/terms
and incorporate the Creative Commons Attribution
- Non Commercial (unported, 3.0) License.
By accessing the work you hereby accept the Terms. Non-commercial uses of the work are permitted
without any further permission from Dove Medical Press Limited, provided the work is properly
attributed. For permission for commercial use of this work, please see paragraphs 4.2 and 5 of our Terms.