Back to Journals » International Journal of Nephrology and Renovascular Disease » Volume 14
Profiling Biomarkers in HIV Glomerular Disease – Potential for the Non-Invasive Diagnosis of HIVAN?
Authors Naicker S ![]() , Dix-Peek T, Klar RM, Kalunga G, Mosiane P, Dickens C
, Dix-Peek T, Klar RM, Kalunga G, Mosiane P, Dickens C ![]() , Duarte R
, Duarte R ![]()
Received 29 July 2021
Accepted for publication 8 October 2021
Published 8 December 2021 Volume 2021:14 Pages 427—440
DOI https://doi.org/10.2147/IJNRD.S331484
Checked for plagiarism Yes
Review by Single anonymous peer review
Peer reviewer comments 2
Editor who approved publication: Professor Pravin Singhal
Saraladevi Naicker,1,* Therese Dix-Peek,2,* Roland Manfred Klar,2 Glendah Kalunga,1 Pulane Mosiane,3 Caroline Dickens,2 Raquel Duarte2
1Department of Internal Medicine, Faculty of Health Sciences, University of the Witwatersrand, Johannesburg, South Africa; 2Department of Internal Medicine Laboratory, Faculty of Health Sciences, University of the Witwatersrand, Johannesburg, South Africa; 3Department of Anatomical Pathology, Faculty of Health Sciences, University of the Witwatersrand, Johannesburg, South Africa
*These authors contributed equally to this work
Correspondence: Saraladevi Naicker
Department of Internal Medicine, Faculty of Health Sciences, University of the Witwatersrand, Johannesburg, South Africa
Tel +27 83 6429575
Email [email protected]
Background: There is a wide spectrum of kidney pathology in human immunodeficiency virus (HIV) infection, affecting all structures of the kidney. The histology of HIV chronic kidney disease (CKD) is diverse, ranging from HIV-associated nephropathy (HIVAN) to focal glomerulosclerosis (FSGS), HIV-immune complex disease (HIV-ICD), other glomerulopathies and tubulo-interstitial nephritis. Definitive diagnosis is by kidney biopsy, an invasive procedure. However, serum and urinary biomarkers may be useful in predicting the histological diagnosis of HIVAN.
Purpose: We wished to determine the utility of serum and urinary biomarkers in predicting the histological diagnosis of HIVAN.
Patients and Methods: We measured neutrophil gelatinase-associated lipocalin (NGAL), cystatin C, transforming growth factor (TGF)-β isoforms and bone morphogenetic protein (BMP)-7 in the serum and urine in patients with different histological forms of HIV glomerular disease.
Results: In HIVAN, we demonstrated increased levels of serum cystatin C and increased levels of serum and urinary NGAL. Urinary TGF-β 1 and TGF-β 2 levels were elevated in HIV-positive patients with CKD but were not significantly different in the different HIV histologies, while urinary BMP-7 levels were elevated in minimal change disease.
Conclusion: This study confirmed the presence of increased serum and urinary biomarkers of tubular injury in patients with HIVAN, and increased urinary biomarkers of fibrosis in HIV CKD, and may indicate their value as a non-invasive diagnostic tool for the diagnosis of HIVAN.
Keywords: cystatin C, neutrophil gelatinase-associated lipocalin, NGAL, transforming growth factor (TGF)-β isoforms, bone morphogenetic protein (BMP)-7, HIV chronic kidney disease
Introduction
Kidney disease associated with human immunodeficiency virus (HIV) infection was first described in 1984 in African-American and Haitian patients with AIDS.1 Originally defined as “acquired immune deficiency syndrome (AIDS) nephropathy”, HIV-associated nephropathy (HIVAN) was synonymous with collapsing focal segmental glomerulosclerosis (FSGS), accompanied by microcystic tubular dilatation and interstitial inflammation and fibrosis. Left untreated, HIVAN progressed rapidly to end-stage kidney disease (ESKD) over the course of a few months.2 In addition to HIVAN, the spectrum of kidney pathology attributable to HIV infection extends beyond HIVAN and includes other chronic kidney disease (CKD), including focal glomerulosclerosis (FSGS), HIV-immune complex disease (HIV-ICD), other glomerulopathies and tubulo-interstitial nephritis. The Renal Pathology Working Group of the Kidney Disease Improving Global Outcomes (KDIGO) Controversies Conference on HIV and Kidney Disease has revised the classification of HIV kidney disease.3 They recommend distinguishing classic HIVAN (collapsing FSGS with microcystic tubular dilatation and interstitial inflammation) from non-collapsing FSGS in the setting of HIV infection; they suggest that direct causality of HIV can only be established with reasonable certainty in classic HIVAN.
Proteinuria and renal dysfunction are markers of CKD associated with HIV infection.4 Studies have demonstrated renal histological changes consistent with HIV infection in both albuminuric and proteinuric patients,4,5 with a high prevalence of HIVAN documented in patients with albuminuria in a study from South Africa.4 HIV infection-related albuminuria and proteinuria, and kidney function improve upon treatment with antiretroviral therapy (ART).6–8 These studies suggest that ART improves kidney function and emphasize the need for screening and early treatment to prevent or postpone ESKD in HIV patients. However, renal histological resolution does not parallel clinical and virologic improvement9 and some patients progress to ESKD in spite of ART; this progression may be attributed to the presence of APOL1 high risk genotypes10 and a high index of chronic damage on kidney histology.11
Kidney fibrosis, a complex and multifactorial process, is a common feature of progressive CKD. Epithelial-mesenchymal crosstalk, where epithelial cells communicate with interstitial fibroblasts and stimulate the production of growth factors, has been reported in chronic interstitial inflammation and fibrosis.12 A number of profibrotic growth factors, including transforming growth factor (TGF)-β, connective tissue growth factor (CTGF), epidermal growth factor (EGF), and fibroblast growth factor (FGF), have been implicated in CKD11,13 and HIV related kidney disease.14–16
In HIVAN, HIV-1 infects the glomerular podocytes, the epithelial cells of the tubules and the collecting ducts resulting in podocyte injury, proliferation and dedifferentiation with the subsequent collapse of the glomerular tuft,14 and tubular injury and dilatation. Neutrophil gelatinase-associated lipocalin (NGAL) is a recognized biomarker of renal proximal tubular injury.17 Podocyte damage in HVAN may be attributed to antagonistic TGF-β and BMP-7 signaling.16,18 TGF-β expression was increased in HIV progressive glomerular diseases; however, this was not unique to HIV-associated kidney diseases.19 In adults, BMP-7 maintains the function of the tubular epithelium and its downregulation is associated with acute or chronic tubular injury.20
To date, the definitive diagnosis of HIVAN and other renal pathologies in HIV relies on a kidney biopsy, an invasive procedure. Serum and urinary biomarkers may have utility in predicting the histological diagnosis of HIVAN. Urine is an ideal source for non-invasive tests to monitor kidney disease. Several studies have explored the utility of urinary biomarkers in HIV kidney disease; biomarkers that were shown to be increased in HIV kidney disease are urine kidney injury molecule-1 (KIM-1), liver-type fatty acid binding protein (L-FABP), alpha-1-microglobulin (α1m), B2-microglobulin (B2-M) and N-acetyl-beta-D-glucosaminidase (NAG). High urinary levels of B2-M were found in children with biopsy-proven HIVAN.21 Urinary concentrations of NAG were found to be increased in HIV-infected patients.22 Serial measurements of multiple biomarkers in the Women’s Interagency HIV Study (WIHS) were found to be of value in detecting and monitoring kidney disease.23 Neither KIM-1 nor NGAL showed significant mortality risk in the adjusted model in the study by Peralta et al.24 Among HIV-infected women, higher urine albumin, α1M, IL-18, and KIM-1 levels were each associated with faster eGFR decline over eight years of follow-up. Urinary levels of L-FABP appeared to have a J-shaped association with death.24 Further research is required to outline the diagnostic as well the predictive role of biomarkers in progression of CKD and mortality.
We explored the utility of NGAL and cystatin C as biomarkers of tubular injury and TGF-β and BMP-7 as biomarkers of fibrosis in different histological forms of HIV CKD.
Materials and Methods
Ethical approval for the study was granted by the Human Research Ethics Committee of the University of the Witwatersrand (certificate number M 091009). HIV-positive adult patients (aged 18 years and older) with known renal histology and CKD were recruited at the adult HIV/HIV Renal Clinics at the Charlotte Maxeke Johannesburg Academic, Chris Hani Baragwanath and Helen Joseph Hospitals in Johannesburg, South Africa after signing informed consent. The study was conducted in accordance with the Declaration of Helsinki.
Exclusion criteria included patients under 18 years, those unable to give consent, already on ART or with shrunken kidneys. HIV-positive patients without kidney disease and apparently normal healthy adult volunteers at the different health facilities served as controls.
Hemoglobin, cholesterol, serum albumin, serum creatinine and eGFR (determined by the CKD-EPI equation without the African American correction), urinary protein creatinine ratio and urine albumin creatinine ratio were determined by the National Health Laboratory Service as standard of care. For each HIV-positive patient, serum and urine were collected at initial diagnosis of HIV infection, prior to initiation of therapy for HIV. There were 25 HIV-positive patients with CKD whose histological diagnoses were known, 25 HIV-positive patients without kidney disease and 24 healthy volunteers who participated in this study.
Biomarker Analysis
Serum and mid-stream urine samples were centrifuged at 1250 x g for 15 mins and 10 mins respectively and the supernatants were aliquoted and stored at −80°C until assayed. Bone morphogenetic protein-7 concentrations were determined by enzyme linked immunosorbent assays (DBP700, Quantikine ELISA, R&D, Minneapolis, MN, USA) according to manufacturer’s instructions. Optical density of BMP-7 was measured at 450 nm on a microplate reader (Elx800, BioTek, Winooski, VT, USA) and concentrations were calculated using the 5PL algorithm. Low levels of biomarkers were determined by extrapolation of the 5PL curve, with levels set at zero when they fell below this. All other analytes were measured using multianalyte Luminex immunoassays. Cystatin C concentrations were measured in serum, diluted 4000-fold and in urine, diluted 10-fold (FCSTM16, Human Kidney Biomarker Magnetic Luminex, R&D) according to the manufacturer’s instructions. Levels of NGAL in serum, diluted 10-fold and urine, diluted 10-fold, were assayed according to manufacturer’s instructions (FCSTM16, Human Kidney Biomarker Magnetic Luminex, R&D). Transforming growth factor-β1, -β2 and - β3 concentrations were measured in serum (activated with hydrochloric acid, neutralized with sodium hydroxide/ HEPES, and diluted 4-fold) and urine (activated with acid, neutralized with sodium hydroxide/HEPES, and with the addition of 0.5% bovine serum albumin, to a dilution factor of 1.44) using the TGF-β Assay kit (171-W4001M, Bio-Rad, Hercules, CA, USA) as per manufacturer’s recommendations. The Multiplex analytes were run on a BioPlex 200™ fluorescence platform, and concentrations were determined using a 5PL algorithm. All biomarker measurements were made in duplicate.
Statistics
Data were analyzed using STATA version 14 software (Stata Corp, College Station, TX, USA). Continuous data are presented as means ± standard deviations for normally distributed variables or as medians and interquartile ranges (IQR) if not normally distributed. Categorical data are presented as ratios and percentages. P values below 0.05 were considered significant.
Biomarker levels were tested for normality using the Shapiro–Wilk test for normality and were found to be non-normally distributed. Levels of biomarkers are presented as medians and IQRs and represented using box-and-whisker plots with outliers indicated. To determine differences between the levels of the various groups, a Kruskal–Wallis test was used. When significant differences were found, a post-hoc Dunn test was used to identify which groups showed significance. Correlations were assessed using Spearman’s rank correlation coefficient with a rho>0.5 or <-0.5, and p<0.05 showing evidence of correlation.
Results
Demographic, clinical and biomarker data are presented in Table 1. The mean ages of the 3 groups were similar, as were their blood pressures. Proteinuria and albuminuria were present in the HIV CKD group only. The HIV-positive CKD group comprised of patients with classic HIVAN (n=6), HIV ICD (n=7), minimal change disease (MCD; n=6), non-collapsing FSGS (n=4), membranous nephropathy (n=1) and membranoproliferative glomerulonephritis (n=1). There was no significant difference in proteinuria when comparing HIVAN with the other histological types of HIV CKD (p=0.590). However, HIVAN patients had significantly lower eGFRs (p=0.031) when compared with the other forms of HIV CKD.
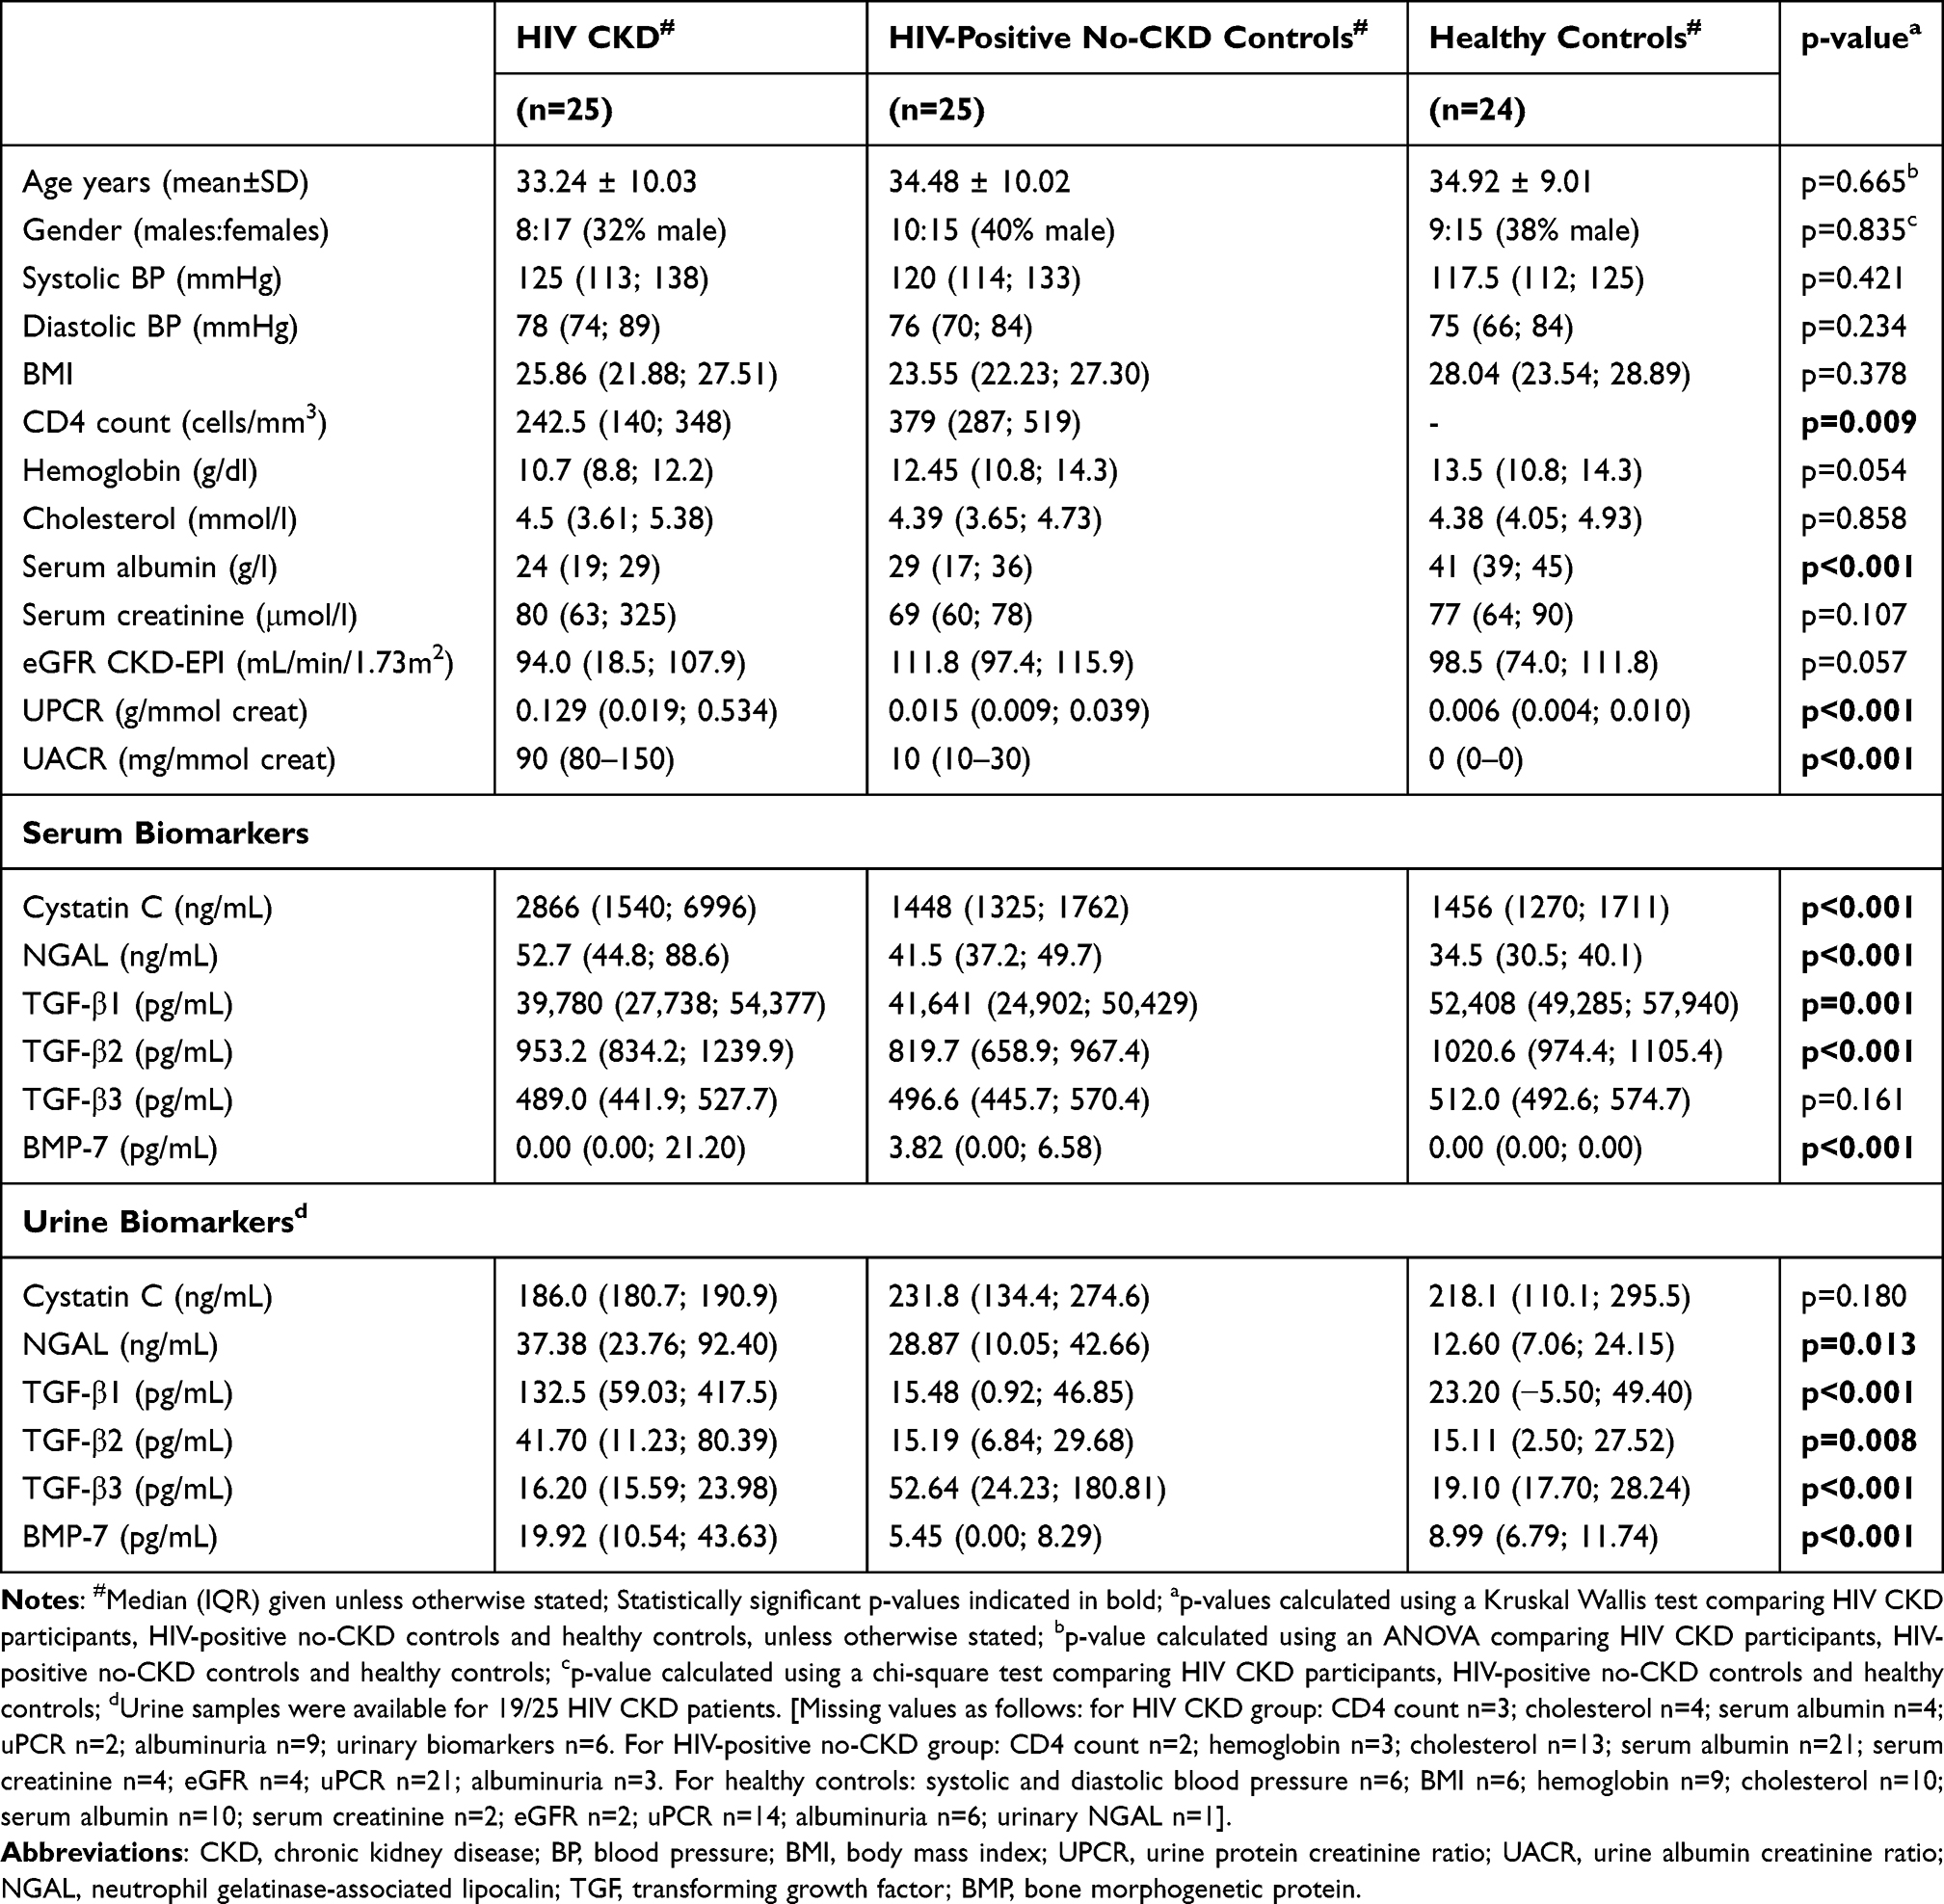 |
Table 1 Demographic, Clinical and Biomarker Profiles of the Study Population |
Biomarker Levels
Cystatin C
Serum cystatin C levels were significantly elevated in the HIV CKD group (p<0.001). When comparing serum levels of cystatin C across the groups, HIV-positive CKD patients had significantly higher levels than the two control groups [p=0.001 for HIV-positive non-CKD controls and p<0.001 for healthy controls] (Table 1 and Figure 1A). HIVAN patients had the highest median serum cystatin C levels; Figure 1B. Serum and urine cystatin C correlated with serum creatinine (p<0.001), and correlated negatively with eGFR; p=0.002 and p=0.002 for serum and urine respectively. There was no correlation of cystatin C with proteinuria; Table 3.
 |
Table 2 Summary of p-values Comparing Serum and Urine Biomarker Levels in the Study Population |
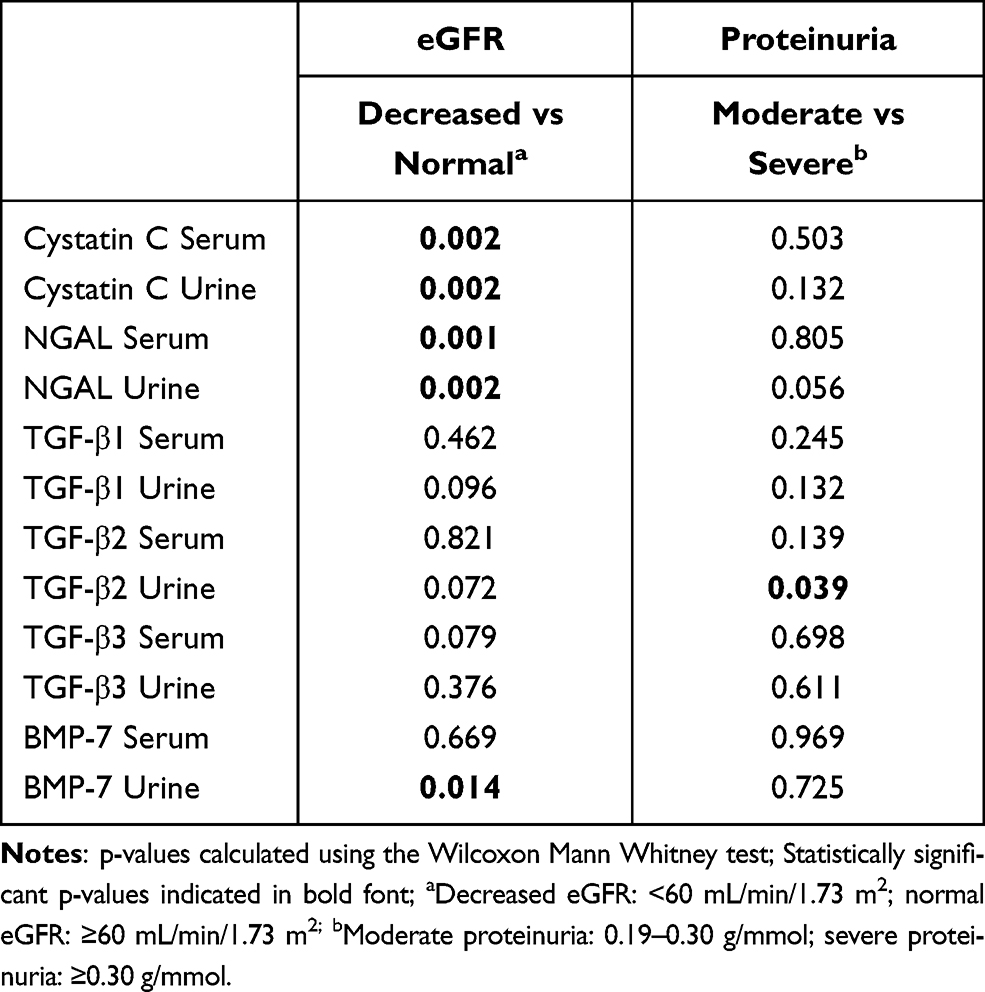 |
Table 3 Correlations Between Biomarker Levels and Markers of Kidney Function |
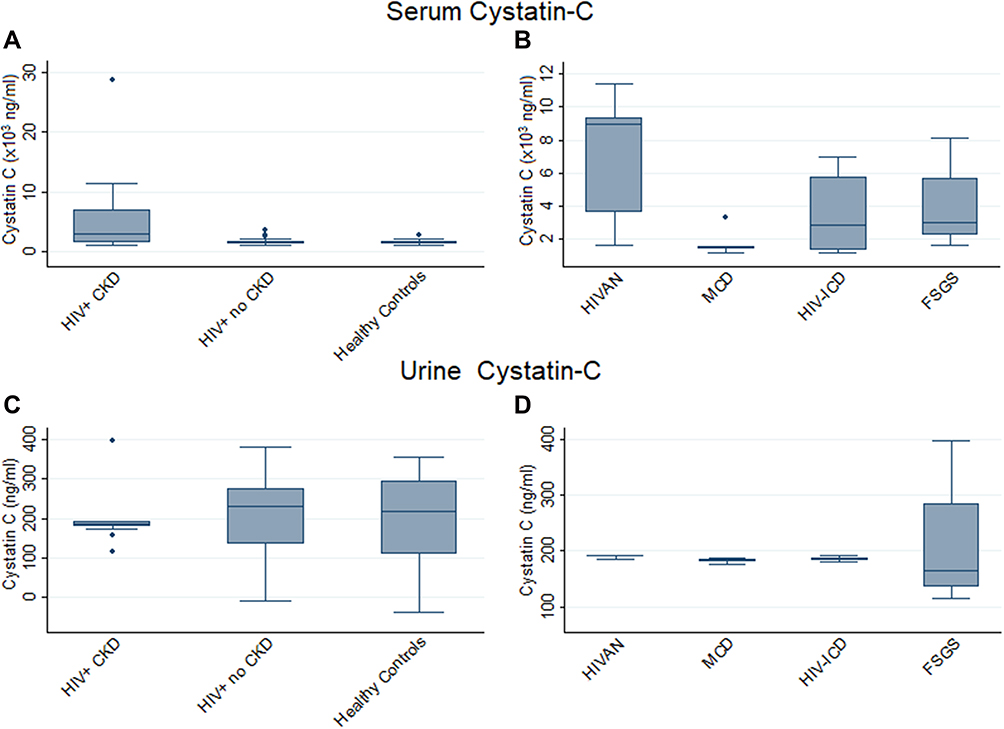 |
Figure 1 Serum and urine Cystatin C levels in HIV+ CKD patients and Controls (A and C) and HIV+ CKD histological types (B and D). Horizontal lines within each box indicate median values with the boxes extending from the 25th to the 75th percentile. Whiskers denote values within 1.5 x IQR, and dots indicate outlier values outside this range. p-values for each graph calculated comparing all participants (A and C) or all HIV-positive CKD patients (B and D) using the Kruskal–Wallis test with post-hoc analysis performed pairwise using Dunn’s Multiple Comparison Test. Significant associations: (A) HIV+ CKD vs HIV+ no-CKD p=0.001; HIV+ CKD vs healthy controls p<0.001. (B) HIVAN vs MCD p=0.001; HIVAN vs HIV-ICD p=0.038; MCD vs FSGS p=0.053. (C) HIV+ CKD vs healthy controls p=0.043. (D) HIVAN vs MCD p=0.045; HIVAN vs FSGS p=0.012. Abbreviations: CKD, chronic kidney disease; FSGS, Focal segmental glomerulosclerosis; HIVAN, HIV-associated nephropathy; HIV-ICD, HIV immune complex disease; IQR, Interquartile range; MCD, minimal change disease. |
Urinary cystatin C levels were decreased in HIV-positive CKD patients compared with healthy controls (p=0.043); Figure 1C; and when looking at CKD patients only, median levels were higher in HIVAN patients, with significant differences compared to FSGS (p=0.012) and MCD (p=0.045); Table 2. As can be seen from the box-and-whisker plots, the range of urinary cystatin C levels in HIV-positive CKD patients was much smaller than the range in the two control groups.
Neutrophil Gelatinase-Associated Lipocalin (NGAL)
The highest levels of serum NGAL were present in the HIV-positive CKD patients, followed by the HIV-positive no-CKD individuals and were lowest in the healthy controls; p<0.001 (Table 1). Comparisons of the HIV-positive CKD and the two control groups were significant (p=0.031 and p<0.001 for the HIV no-CKD and healthy controls respectively; Table 2 and Figure 2A). When comparing serum NGAL levels in the different CKD groups, the levels in HIVAN patients were significantly higher than the levels in the MCD (p=0.004) and HIV-ICD (p=0.035) patients; Table 2 and Figure 2B.
 |
Figure 2 Serum and urine NGAL levels in HIV+ CKD patients and Controls (A and C) and HIV+ CKD histological types (B and D). Horizontal lines within each box indicate median values with the boxes extending from the 25th to the 75th percentile. Whiskers denote values within 1.5 x IQR, and dots indicate outlier values outside this range. p-values for each graph calculated comparing all participants (A and C) or all HIV-positive CKD patients (B and D) using the Kruskal–Wallis test with post-hoc analysis performed pairwise using Dunn’s Multiple Comparison Test. Significant associations: (A) HIV+ CKD vs HIV+ no-CKD p=0.031; HIV+ CKD vs healthy controls p<0.001; HIV+ no-CKD vs healthy controls p=0.016. (B) HIVAN vs MCD p=0.004; HIVAN vs HIV-ICD p=0.035. (C) HIV+ CKD vs healthy controls p=0.002; HIV+ no-CKD vs healthy controls p=0.026. (D) HIVAN vs MCD p=0.006. Abbreviations: CKD, chronic kidney disease; FSGS, Focal segmental glomerulosclerosis; HIVAN, HIV-associated nephropathy; HIV-ICD, HIV immune complex disease; IQR, Interquartile range; MCD, minimal change disease; NGAL, neutrophil gelatinase-associated lipocalin. |
When comparing urinary NGAL levels, the HIV-positive patients had significantly higher levels than the healthy controls (HIV-positive CKD patients vs healthy controls p=0.002 and HIV-positive no-CKD patients vs healthy controls p=0.026); Table 2 and Figure 2C.
HIVAN patients had the highest median levels of urinary NGAL, significantly higher than levels in MCD patients (p=0.006) and HIV-ICD (p=0.081), Table 2 and Figure 2D. Urinary NGAL levels were also higher in HIVAN patients when compared to all other HIV CKD histologies combined (p=0.003); results not shown.
Serum and urinary NGAL levels correlated significantly with reduced kidney function; p=0.001 and p=0.002 respectively, but not with proteinuria; Table 3.
Transforming Growth Factor -β1
Serum levels of TGF-β1 were significantly lower in the HIV-positive patients compared with the healthy controls; p=0.001 (Table 1). None of the HIV-positive groups, with or without CKD, differed significantly from each other (Table 2).
Urinary TGF-β1 levels were significantly higher in patients with HIV-positive CKD (p<0.001) compared to the two control groups. While urinary TGF-β1 levels were significantly higher in HIVAN vs the control groups (healthy controls and HIV no-CKD; p=0.005; Figure 3C and D), TGF-β1 levels within the HIV CKD histology groups did not differ significantly from each other (Figure 3D, Table 2) although median levels were higher in the HIVAN group.
 |
Figure 3 Serum and urine TGF-β1 levels in HIV+ CKD patients and Controls (A and C) and HIV+ CKD histological types (B and D). Horizontal lines within each box indicate median values with the boxes extending from the 25th to the 75th percentile. Whiskers denote values within 1.5 x IQR, and dots indicate outlier values outside this range. p-values for each graph calculated comparing all participants (A and C) or all HIV-positive CKD patients (B and D) using the Kruskal–Wallis test with post-hoc analysis performed pairwise using Dunn’s Multiple Comparison Test. Significant associations: (A) HIV+ CKD vs healthy controls p=0.002; HIV+ no-CKD vs healthy controls p<0.001. (B) No significant associations. (C) HIV+ CKD vs HIV+ no-CKD p<0.001; HIV+ CKD vs healthy controls p<0.001. (D) No significant associations. Abbreviations: CKD, chronic kidney disease; FSGS, Focal segmental glomerulosclerosis; HIVAN, HIV-associated nephropathy; HIV-ICD, HIV immune complex disease; IQR, Interquartile range; MCD, minimal change disease; TGF, transforming growth factor. |
Transforming Growth Factor-β2
Serum TGF-β2 levels were lowest among the HIV-positive patients without CKD, differing significantly from both the HIV-positive CKD patients (p=0.008) and the healthy controls (p<0.001); Table 2 and Figure 4A. The highest serum TGF-β2 levels were present in the healthy control group. HIVAN patients had the highest median serum TGF-β2 levels of all the groups analyzed but did not differ significantly from any of the other CKD groups, probably because of the large interquartile range.
 |
Figure 4 Serum and urine TGF-β2 levels in HIV+ CKD patients and Controls (A and C) and HIV+ CKD histological types (B and D). Horizontal lines within each box indicate median values with the boxes extending from the 25th to the 75th percentile. Whiskers denote values within 1.5 x IQR, and dots indicate outlier values outside this range. p-values for each graph calculated comparing all participants (A and C) or all HIV-positive CKD patients (B and D) using the Kruskal–Wallis test with post-hoc analysis performed pairwise using Dunn’s Multiple Comparison Test. Significant associations: (A) HIV+ CKD vs HIV+ no-CKD p=0.008; HIV+ CKD vs healthy controls p=0.053; HIV+ no-CKD vs healthy controls p<0.001. (B) No significant associations. (C) HIV+ CKD vs HIV+ no-CKD p=0.008; HIV+ CKD vs healthy controls p=0.002. (D) No significant associations. Abbreviations: CKD, chronic kidney disease; FSGS, Focal segmental glomerulosclerosis; HIVAN, HIV-associated nephropathy; HIV-ICD, HIV immune complex disease; IQR, Interquartile range; MCD, minimal change disease; TGF, transforming growth factor. |
Urinary TGF-β2 levels, like those of urinary TGF-β1, were significantly higher in HIV-positive CKD patients (p=0.008; Table 1) compared to the two control groups which did not differ significantly from each other. Urinary TGF-β2 levels were significantly higher in HIVAN patients than in the two control groups (p=0.012 for the no-CKD group; p=0.005 for healthy controls; Figure 4C and D) but were not significantly different from the remaining HIV-positive CKD pathologies including MCD (Table 2). Urinary TGF-β2 levels correlated with proteinuria (p=0.039) but not with kidney function (Table 3).
Transforming Growth Factor-β3
Serum TGF-β3 levels were similar in all groups (Table 1), but were slightly higher in the healthy controls compared to patients with HIV CKD; p=0.029 (Figure 5A).
 |
Figure 5 Serum and urine TGF-β3 levels in HIV+ CKD patients and Controls (A and C) and HIV+ CKD histological types (B and D). Horizontal lines within each box indicate median values with the boxes extending from the 25th to the 75th percentile. Whiskers denote values within 1.5 x IQR, and dots indicate outlier values outside this range. p-values for each graph calculated comparing all participants (A and C) or all HIV-positive CKD patients (B and D) using the Kruskal–Wallis test with post-hoc analysis performed pairwise using Dunn’s Multiple Comparison Test. Significant associations: (A) HIV+ CKD vs healthy controls p=0.029. (B) HIVAN vs HIV-ICD p=0.012; HIV-ICD vs FSGS p=0.044. (C) HIV+ CKD vs HIV+ no-CKD p<0.001; HIV+ no-CKD vs healthy controls p=0.001. (D) MCD vs FSGS p=0.016. Abbreviations: CKD, chronic kidney disease; FSGS, Focal segmental glomerulosclerosis; HIVAN, HIV-associated nephropathy; HIV-ICD, HIV immune complex disease; IQR, Interquartile range; MCD, minimal change disease; TGF, transforming growth factor. |
Serum TGF-β3 levels were increased in HIVAN vs HIV ICD (p=0.012) and in HIV ICD vs FSGS and (p=0.044); Figure 5B, Table 2.
Urinary TGF-β3 levels were significantly higher in the HIV-positive no-CKD group than in the HIV-positive CKD group and the healthy controls; p<0.001 (Table 1 and Figure 5C). The HIV-positive CKD and healthy control groups did not differ significantly from each other. Among the various HIV-positive CKD histologies, median urinary TGF-β3 levels were highest among MCD patients. When the MCD patients were excluded from analysis of the HIV-positive CKD group, median urinary TGF-β3 levels decreased resulting in this group now differing significantly from both the HIV-positive no-CKD group (p<0.001) and the healthy control group (p=0.045). Urinary TGF-β3 levels were significantly lower in the HIVAN patients compared to the HIV-positive no-CKD group; p=0.005.
Bone Morphogenetic Protein-7
Serum BMP-7 levels were in general very low in HIV patients and were undetectable in the healthy controls. Urinary BMP-7 levels were significantly higher in the HIV-positive CKD group compared with HIV no-CKD and healthy controls; p<0.001 and p=0.004 respectively (Tables 1 and 2 and Figure 6C), and were significantly higher in the MCD vs HIVAN (p=0.027) and FSGS (p=0.049) histologies; (Table 2 and Figure 6D).
 |
Figure 6 Serum and urine BMP-7 levels in HIV+ CKD patients and Controls (A and C) and HIV+ CKD histological types (B and D). Horizontal lines within each box indicate median values with the boxes extending from the 25th to the 75th percentile. Whiskers denote values within 1.5 x IQR, and dots indicate outlier values outside this range. p-values for each graph calculated comparing all participants (A and C) or all HIV-positive CKD patients (B and D) using the Kruskal–Wallis test with post-hoc analysis performed pairwise using Dunn’s Multiple Comparison Test. Significant associations: (A) HIV+ CKD vs healthy controls p<0.001; HIV+ no-CKD vs healthy controls p=0.001. (B) No significant associations. (C) HIV+ CKD vs HIV+ no-CKD p<0.001; HIV+ CKD vs healthy controls p=0.004; HIV+ no-CKD vs healthy controls p=0.042. (D) HIVAN vs MCD p=0.030; MCD vs FSGS p=0.048. Abbreviations: BMP, bone morphogenetic protein; CKD, chronic kidney disease; FSGS, Focal segmental glomerulosclerosis; HIVAN, HIV-associated nephropathy; HIV-ICD, HIV immune complex disease; IQR, Interquartile range; MCD, minimal change disease. |
Correlation of Biomarkers with Kidney Function and Proteinuria in CKD Patients
Table 3 shows that the biomarkers that showed correlations with eGFR were serum and urinary cystatin C (p<0.001 and 0.041 respectively), serum and urinary NGAL (p<0.001 and 0.004 respectively) and urinary BMP-7 (p=0.007).
Urinary TGFβ-2 (p=0.039) showed correlation with proteinuria, while urinary NGAL (p=0.056) showed a trend towards significance.
Discussion
HIV-positive CKD patients had significantly higher levels of serum cystatin C compared with the two control groups, with HIVAN patients showing the highest median serum cystatin C levels. Increased serum and urinary cystatin C have been reported as markers of renal tubular dysfunction.25 Our study showed correlation of serum cystatin C with serum creatinine, and a negative correlation with eGFR, indicating its association with kidney function. Urinary cystatin C concentration has been found to be increased in HIV-positive patients26 and to correlate with GFR and B2-microglobulin in patients with HIV infection.27 Our study did not concur, showing decreased urinary cystatin C levels in HIV CKD patients. Higher levels of urinary cystatin C were found in patients with established HIV-associated renal diseases than in patients without proteinuria or trace proteinuria.28 Our study showed correlation of cystatin C with eGFR but not with proteinuria.
Patients with HIVAN had significantly elevated biomarkers of tubular injury as demonstrated by significantly elevated serum and urinary NGAL levels in HIVAN in this study. The finding of elevated serum NGAL levels in patients with HIVAN has not been reported previously. The elevated serum NGAL levels in HIVAN may indicate the degree of tubular injury in HIVAN, with excess release of NGAL from the proximal tubules and subsequent reabsorption. In contrast, serum NGAL levels were not as highly elevated in patients with other HIV CKDs such as minimal change disease and various other histological types, or in HIV-positive patients without kidney disease or healthy controls, and is probably a reflection of the tubular injury present in HIVAN. While median serum and urine levels of NGAL were higher in HIVAN than in other HIV CKD, we were not able to determine definitive cut-off levels.
Previous studies showed significantly increased urinary NGAL levels in patients with HIVAN compared with HIV-positive patients and negative controls with other forms of CKD.21,29,30 Our study showed correlation of serum and urinary NGAL with kidney function, while its association with proteinuria trended towards significance. Elevated levels of urinary NGAL were also found in HIVAN patients with relatively preserved kidney function and mild to moderate proteinuria, suggesting that NGAL can be an early biomarker in the course of progressive kidney disease due to HIVAN.30–32 NGAL, a 25-KD protein secreted into the urine by damaged kidney tubular epithelial cells, may therefore be a useful biomarker to detect the presence of renal tubular injury and distinguish HIVAN from other forms of CKD or other glomerulopathies in HIV infection.
NGAL levels were elevated in both the serum and urine of HIVAN patients, and a larger study with greater numbers of HIVAN patients would help determine cut-off levels that are definitive for HIVAN.
While serum levels of TGF-β1 were significantly lower in the HIV-positive patients compared with the healthy controls, urinary TGF-β1 levels were significantly higher in patients with HIV-positive CKD patients compared to the two control groups. Urinary TGF-β1 levels were the highest in the HIVAN group but were not significantly different from the other histological groups in our study, probably due to the small numbers in the different histological groups. HIV-infected individuals with albuminuria were reported to excrete higher levels of urine TGF-β1 and collagen IV compared to those without albuminuria; in addition, increased inflammation was associated with increased urinary TGF-β1 in HIVAN.33 HIV-positive patients with CKD in a recent study from Nigeria were shown to express higher levels of urinary TGF-β1 in association with proteinuria.34
Our study did not show correlation of TGF-β1 with kidney function or proteinuria.
Healthy controls had the highest median serum TGF-β2 levels of all the groups analyzed in our study. Urinary TGF-β2 levels, like those of urinary TGF-β1, were significantly higher in HIV-positive CKD patients compared to the two control groups and correlated with proteinuria. Increased urinary TGF-β2 levels were previously reported in HIV infection.35–37
Urinary TGF-β3 levels were significantly higher in the HIV-positive no-CKD group than in the HIV-positive CKD group and the healthy controls. Urinary TGF-β3 levels were however significantly lower in the HIVAN patients compared to the HIV-positive no-CKD group. While the majority of studies have suggested a profibrotic role for the different TGF-β isoforms, recent studies have suggested that TGF-β2 and TGF-β3 may exert antifibrotic effects.36,37 A larger study is recommended to define the role of the different TGF-β isoforms.
TGF-β was elevated in HIV-infected individuals and may contribute to the pathogenesis of HIVAN.35–37 TGF-β expression is increased in progressive glomerular disease and these studies suggested that TGF-β is not specific for HIV kidney disease.19,35 Various cell types have been reported to increase local production of TGF-β in the kidneys of individuals with HIV such as mesangial cells;38,39 mononuclear cells in the peripheral blood have also been found to produce and secrete TGF-β, with associated elevation of TGF-β in the plasma and tissues.35
Urinary BMP-7 levels were significantly higher in the HIV CKD group compared with healthy controls, and were the highest in the minimal change disease group; this may be a reflection of the absence of fibrosis in minimal change disease. Urinary BMP-7 correlated with kidney function in our study. BMP-7 is a protein of the TGF-β super family and is postulated to counteract the profibrotic effects of TGF-β. BMP-7 has anti-inflammatory, anti-fibrotic and anti-oxidative effects, reduces extracellular matrix production, enhances extracellular matrix degradation by increasing the activity of matrix metalloproteinase (MMP)-2 and reducing activation of plasminogen activator inhibitor (PAI-1).40 In a study of diabetic nephropathy, serum BMP-7 and TGF-β levels correlated with the degree of interstitial fibrosis and tubular atrophy (IFTA). Increased levels of TGF-β and decreased levels of BMP-7 were noted with increasing IFTA.41 However, in vitro studies showing the anti-fibrotic effects of BMP-7 were not replicated in vivo.42
A recent study by Muiru et al23 has recommended that longitudinal studies utilizing serial measurements of multiple biomarkers would be of value in predicting the presence and progression of kidney disease.
Our study was limited by its cross-sectional nature and sample size, especially in the different histological subgroups. However, our study provides useful data for the clinician in differentiating HIVAN from other histological forms of CKD in patients with HIV infection. Future studies with a larger sample size are recommended to confirm these findings.
Conclusion
This study confirmed the presence of increased serum and urinary biomarkers of tubular injury in patients with HIVAN, and increased urinary biomarkers of fibrosis in HIV CKD. This biomarker marker profile of elevated serum and urinary NGAL, and high levels of urinary TGF-β1 in HIV-infected patients with CKD may indicate their value as a non-invasive diagnostic tool for the diagnosis of HIVAN.
Acknowledgments
Our sincere gratitude goes out to the patients who participated in this study, the staff and postgraduate students at the different institutions for their assistance and support.
We thank the Medical Research Council of South Africa who funded this study via its Self-Initiated Research Grant to Professor Saraladevi Naicker.
Dr G Kalunga was the recipient of the International Society of Nephrology and Carnegie Fellowship grants. Dr RM Klar was supported by postdoctoral funding from the University Research Committee of the University of the Witwatersrand.
Disclosure
Professor Saraladevi Naicker report grants from Medical Research Council of South Africa (MRC), during the conduct of the study. The authors report no other conflicts of interest in this work.
References
1. Rao TK, Fillippone EJ, Nicastri AD, et al. Associated Focal and Segmental Glomerulosclerosis in the Acquired Immunodeficiency Syndrome. New Engl J Med. 1984;310(11):669–673. PMID: 6700641. doi:10.1056/NEJM198403153101101
2. Carbone L, D’Agati V, Cheng JT, Appel GB. Course and prognosis of human immunodeficiency virus-associated nephropathy. Am J Med. 1989;87(4):389–395. PMID: 2801729. doi:10.1016/s0002-9343(89)80819-8
3. Swanepoel CR, Atta MG, D’Agati VD, et al. Kidney disease in the setting of HIV infection: conclusions from a Kidney Disease: improving Global Outcomes (KDIGO) Controversies Conference. Kidney Int. 2018;93(3):545–559. PMID: 29398134. doi:10.1016/j.kint.2017.11.007
4. Han TM, Naicker S, Ramdial PK, Assounga AG. A cross-sectional study of HIV-seropositive patients with varying degrees of proteinuria in South Africa. Kidney Int. 2006;69(12):2243–2250. PMID: 16672914. doi:10.1038/sj.ki.5000339
5. Fabian J, Naicker S, Venter WDF, et al. Urinary screening abnormalities in antiretroviral-naïve HIV-infected outpatients and implications for management- a single centre study in South Africa. Ethn Dis. 2009;S1:80–85.
6. Lucas GM, Eustace JA, Sozio S, Mentari EK, Appiah KA, Moore RD. Highly active antiretroviral therapy and the incidence of HIV-1 associated nephropathy: 12-year cohort study. AIDS. 2004;18(3):541–546. PMID: 15090808. doi:10.1097/00002030-200402200-00022
7. Stöhr W, Reid A, Walker AS, et al.; DART Trial Team. Glomerular dysfunction and associated risk factors over 4-5 years following antiretroviral therapy initiation in Africa. Antivir Ther. 2011;16(7):1011–1020. PMID: 22024517. doi:10.3851/IMP1832
8. Wyatt CM, Klotman PE. HIV-1 and HIV-associated nephropathy 25 years later. Clin J Am Soc Nephrol. 2007;2(Suppl 1):S20–S24. PMID: 17699507. doi:10.2215/CJN.03561006
9. Fabian J, Naicker S, Goetsch S, Venter WD. The clinical and histological response of HIV-associated kidney disease to antiretroviral therapy in South Africans. Nephrol Dial Transplant. 2013;28(6):1543–1554. PMID:23444185. doi:10.1093/ndt/gft010
10. Fine DM, Wasser WG, Estrella MM, et al. APOL1 risk variants predict histopathology and progression to ESRD in HIV-related kidney disease. J Am Soc Nephrol. 2012;23(2):343–350. PMID: 22135313. PMCID: PMC3269183. doi:10.1681/ASN.2011060562
11. Post FA, Campbell LJ, Hamzah L, et al. Predictors of renal outcome in HIV-associated nephropathy. Clin Infect Dis. 2008;46(8):1282–1289. PMID: 18444868. doi:10.1086/529385
12. Prunotto M, Budd DC, Gabbiani G, et al. Epithelial-mesenchymal crosstalk alteration in kidney fibrosis. J Pathol. 2012;228:131–147. doi:10.1002/path.4049
13. Yamamoto T, Noble NA, Cohen AH, et al. Expression of transforming growth factor-beta isoforms in human glomerular diseases. Kidney Int. 1996;49(2):461–469. PMID: 8821830. doi:10.1038/ki.1996.65
14. Lu TC, He JC, Klotman PE. Podocytes in HIV-associated nephropathy. Nephron Clin Pract. 2007;106(2):c67–c71. PMID: 17570932. doi:10.1159/000101800
15. Bottinger EP, Bitzer M. TGF-ß signaling in renal disease. J Am Soc Nephrol. 2002;13(10):2600–2610. PMID: 12239251. doi:10.1097/01.ASN.0000033611.79556.AE
16. Wahab NA, Mason RM. A critical look at growth factors and epithelial-to-mesenchymal transition in the adult kidney. Nephron Exp Nephrol. 2006;104(4):e129–e134. PMID: 16902316. doi:10.1159/000094963
17. Mishra J, Ma Q, Prada A, et al. Identification of neutrophil gelatinase-associated lipocalin as a novel early urinary biomarker for ischemic renal injury. J Am Soc Nephrol. 2003;14(10):2534–2543. PMID: 14514731. doi:10.1097/01.asn.0000088027.54400.c6
18. Patel SR, Dressler GR. BMP7 signaling in renal development and disease. Trends Mol Med. 2005;11(11):512–518. PMID: 16216558. doi:10.1016/j.molmed.2005.09.007
19. Bódi I, Kimmel PL, Abraham AA, Svetkey LP, Klotman PE, Kopp JB. Renal TGF-β in HIV-associated kidney diseases. Kidney Int. 1997;51(5):1568–1577. PMID: 9150474. doi:10.1038/ki.1997.215
20. Zeisberg M, Hanai J, Sugimoto H, et al. BMP-7 counteracts TGF-beta1-induced epithelial-to-mesenchymal transition and reverses chronic renal injury. Nat Med. 2003;9(7):964–968. PMID: 12808448. doi:10.1038/nm888
21. Soler-García AA, Johnson D, Hathout Y, Ray PE. Iron-related proteins: candidate urine biomarkers in childhood HIV-associated renal diseases. Clin J Am Soc Nephrol. 2009;4(4):763–771. PMID: 19279121; PMCID: PMC2666435. doi:10.2215/CJN.0200608
22. Hall AM, Edwards SG, Lapsley M, et al. Subclinical tubular injury in HIV-infected individuals on antiretroviral therapy: a cross-sectional analysis. Am J Kidney Dis. 2009;54(6):1034–1042. PMID: 19783343. doi:10.1053/j.ajkd.2009.07.012
23. Muiru AN, Scherzer R, Ascher SB, et al. Associations of CKD risk factors and longitudinal changes in urine biomarkers of kidney tubules among women living with HIV. BMC Nephrol. 2021;22(1):296. PMID: 34461840. doi:10.1186/s12882-021-02508-6
24. Peralta C, Scherzer R, Grunfeld C, et al. Urinary biomarkers of kidney injury are associated with all-cause mortality in the Women’s Interagency HIV Study (WIHS). HIV Med. 2014;15(5):291–300. PMID: 24313986. doi:10.1111/hiv.12113
25. Conti M, Moutereau S, Zater M, et al. Urinary cystatin C as a specific marker of tubular dysfunction. Clin Chem Lab Med. 2006;44(3):288–291. PMID: 16519600. doi:10.1515/CCLM.2006.050
26. Kabanda A, Vandercam B, Bernard A, Lauwerys R, de Strihou CV. Low molecular weight proteinuria in human immunodeficiency virus-infected patients. Am J Kidney Dis. 1996;27(6):803–808. PMID: 8651244. doi:10.1016/s0272-6386(96)90517-x
27. Deyà-Martínez À, Fortuny C, Soler-Palacín P, et al. Cystatin C: a marker for inflammation and renal function among HIV-infected children and adolescents. Pediatr Infect Dis J. 2016;35(2):196–200. PMID: 26479972. doi:10.1097/INF.0000000000000960
28. Soler-García AA, Rakhmanina NY, Mattison PC, Ray PE. A urinary biomarker profile for children with HIV-associated renal diseases. Kidney Int. 2009;76(2):207–214. PMID: 19357719; PMCID: PMC2778294. doi:10.1038/ki.2009.115
29. Sola-Del Valle DA, Mohan S, Cheng JT, et al. Urinary NGAL is a useful clinical biomarker of HIV-associated nephropathy. Nephrol Dial Transplant. 2011;26(7):2387–2390. PMID: 21555394; PMCID: PMC3164447. doi:10.1093/ndt/gfr258
30. Paragas N, Nickolas TL, Wyatt C, et al. Urinary NGAL marks cystic disease in HIV-associated nephropathy. J Am Soc Nephrol. 2009;20(8):1687–1692. PMID: 19628667; PMCID: PMC2723987. doi:10.1681/ASN.2009010065
31. Jotwani V, Scherzer R, Abraham A, et al. Does HIV infection promote early kidney injury in women? Antivir Ther. 2014;19(1):79–87. PMID: 23970313; PMCID: PMC3933452. doi:10.3851/IMP2677
32. Shlipak MG, Scherzer R, Abraham A, et al. Urinary markers of kidney injury and kidney function decline in HIV-infected women. J Acquir Immune Defic Syndr. 2012;61(5):565–573. PMID: 23023103; PMCID: PMC3509242. doi:10.1097/QAI.0b013e3182737706
33. Mitchell BI, Byron MM, Ng RC, Chow DC, Ndhlovu LC, Shikuma CM. Elevation of non-classical (CD14+/lowCD16++) monocytes is associated with increased albuminuria and urine TGF-β1 in HIV-infected individuals on stable antiretroviral therapy. PLoS One. 2016;11(4):e0153758. PMID: 27097224; PMCID: PMC4838224. doi:10.1371/journal.pone.0153758
34. Ekrikpo UE, Okuku CN, Ajayi SO, et al. Urinary transforming growth factor-beta 1 (uTGF-β1) and prevalent CKD risk in HIV-positive patients in West Africa. Kidney Int Rep. 2019;4(12):1698–1704. PMID: 31844806; PMCID: PMC6895576. doi:10.1016/j.ekir.2019.07.011
35. Lotz M, Seth P. TGF beta and HIV infection. Ann N Y Acad Sci. 1993;685:501–511. PMID: 7689810. doi:10.1111/j.1749-6632.1993.tb35912.x
36. Sureshbabu A, Muhsin SA, Choi ME. TGF-β signaling in the kidney: profibrotic and protective effects. Am J Physiol Renal Physiol. 2016;310(7):F596–F606. PMID: 26739888; PMCID: PMC4824143. doi:10.1152/ajprenal.00365.2015
37. Yamamoto T, Noble NA, Miller DE, et al. Increased levels of transforming growth factor-beta in HIV-associated nephropathy. Kidney Int. 1999;55(2):579–592. PMID: 9987082. doi:10.1046/j.1523-1755.1999.00296.x
38. Shukla RR, Kumar A, Kimmel PL. Transforming growth factor beta increases the expression of HIV-1 gene in transfected human mesangial cells. Kidney Int. 1993;44(5):1022–1029. PMID: 8264131. doi:10.1038/ki.1993.344
39. Xu L, Xiong S, Guo R, et al. Transforming growth factor β3 attenuates the development of radiation-induced pulmonary fibrosis in mice by decreasing fibrocyte recruitment and regulating IFN-γ/IL-4 balance. Immunol Lett. 2014;162(1Pt A):27–33. PMID: 24996042. doi:10.1016/j.imlet.2014.06.010
40. Li RX, Yiu WH, Tang SC. Role of bone morphogenetic protein-7 in renal fibrosis. Front Physiol. 2015;6:114. PMID: 25954203; PMCID: PMC4407503. doi:10.3389/fphys.2015.00114
41. John P, Yadla M. Noninvasive method of differentiating diabetic nephropathy and nondiabetic renal disease using serum bone morphogenetic protein-7 and transforming growth factor-beta 1 levels in patients with type-2 diabetes mellitus. Saudi J Kidney Dis Transpl. 2019;30(6):1300–1309. PMID: 31929277. doi:10.4103/1319-2442.275474
42. Kim S, Jeong CH, Song SH, et al. Micellized protein transduction domain-bone morphogenetic protein-7 efficiently blocks renal fibrosis via inhibition of transforming growth factor-beta-mediated epithelial-mesenchymal transition. Front Pharmacol. 2020;11:591275. PMID: 33364962; PMCID: PMC7751754. doi:10.3389/fphar.2020.591275
 © 2021 The Author(s). This work is published and licensed by Dove Medical Press Limited. The
full terms of this license are available at https://www.dovepress.com/terms
and incorporate the Creative Commons Attribution
- Non Commercial (unported, 3.0) License.
By accessing the work you hereby accept the Terms. Non-commercial uses of the work are permitted
without any further permission from Dove Medical Press Limited, provided the work is properly
attributed. For permission for commercial use of this work, please see paragraphs 4.2 and 5 of our Terms.
© 2021 The Author(s). This work is published and licensed by Dove Medical Press Limited. The
full terms of this license are available at https://www.dovepress.com/terms
and incorporate the Creative Commons Attribution
- Non Commercial (unported, 3.0) License.
By accessing the work you hereby accept the Terms. Non-commercial uses of the work are permitted
without any further permission from Dove Medical Press Limited, provided the work is properly
attributed. For permission for commercial use of this work, please see paragraphs 4.2 and 5 of our Terms.