Back to Journals » Neuropsychiatric Disease and Treatment » Volume 17
Prevalence and Predictors of Postictal Confusion After Electroconvulsive Therapy
Authors Ittasakul P ![]() , Jarernrat P
, Jarernrat P ![]() , Tor PC
, Tor PC ![]()
Received 14 September 2020
Accepted for publication 19 October 2020
Published 2 February 2021 Volume 2021:17 Pages 283—289
DOI https://doi.org/10.2147/NDT.S281961
Checked for plagiarism Yes
Review by Single anonymous peer review
Peer reviewer comments 3
Editor who approved publication: Dr Yu-Ping Ning
Pichai Ittasakul,1 Phathamon Jarernrat,1 Phern-Chern Tor2
1Department of Psychiatry, Faculty of Medicine, Ramathibodi Hospital, Mahidol University, Bangkok, Thailand; 2Department of Mood and Anxiety, Institute of Mental Health, Singapore
Correspondence: Pichai Ittasakul
Department of Psychiatry, Faculty of Medicine, Ramathibodi Hospital, Mahidol University, 270 Rama VI Road, Ratchathewi, Bangkok, 10400, Thailand
Tel +662-2011478
Fax +662-200-3277
Email [email protected]
Objective: To investigate the prevalence and predictors of postictal confusion (PIC) in patients who received electroconvulsive therapy (ECT).
Methods: We conducted chart reviews for 79 patients who were receiving inpatient ECT. Subjects with PIC were identified. PIC was defined by confusion, disorientation, motor restlessness, purposeless movement, and nonresponse to verbal commands following ECT within an hour, intravenous benzodiazepine was necessary to manage disturbed behavior. Multivariable logistic regression analysis was used to examine the association of PIC with demographic and clinical variables.
Results: Prevalence of PIC was 36.7%. In 912 ECT sessions, the occurrence of PIC was 86 times. Patients with PIC (n = 29) had significant higher body mass index (BMI) (27 ± 6.6 kg/m2 vs 24.1 ± 5.2 kg/m2, t = − 2.22, df = 77, p = 0.029) than patients without PIC (n = 50). PIC associated with BMI (Pearson correlation = 0.25, p = 0.029). BMI was significant predictor of PIC after adjusting for other covariates (odds ratio = 0.91, 95% CI= 0.83– 0.99, p < 0.035).
Conclusion: PIC was not uncommon in patients receiving ECT. BMI was an independent predictor of PIC. Psychiatrists should be aware of the risks of PIC in patients with high BMI receiving ECT.
Keywords: electroconvulsive therapy; ECT, body mass index; BMI, Thai patients, agitation, postictal confusion; PIC
Introduction
Electroconvulsive therapy (ECT) is commonly used to treat severe mental disorders including schizophrenia, schizoaffective disorder, bipolar affective disorder and medication resistant depression. It is a rapid, highly effective treatment. A common adverse effect is postictal confusion (PIC) following ECT. The prevalence of PIC in patients who received ECT treatments was 30–65%.1–4 Symptoms of PIC, including confusion, disorientation, motor restlessness, purposeless movement, and nonresponse to verbal commands can last from 1 to 60 minutes after ECT.3 The severity of PIC can vary from mild to severe. PIC may be leading to patient falls, and risk to ECT staff.5,6 Thirty-four percent of patients who had previous history of PIC may be have PIC again after ECT.7 Previous studies demonstrated that risk factors associated with PIC after ECT include old age,8 catatonia,1 pretreatment anxiety9 electrode placement method,6 using of lithium,10 anesthetic agent and muscle relaxant11,12 and duration of seizure.3
A recent study in Thai psychiatric patients reported the occurrence of PIC after ECT at 62.1%.4 To our knowledge, there is limited literature about PIC in Thai patients. Therefore, we aimed to investigate the prevalence and predictors of PIC in Thai patients who received ECT to guide clinicians in its prevention.
Materials and Methods
Setting and Study Design
We performed a retrospective chart review on all patients who received inpatient ECT from December 2014 to November 2018 at the Ramathibodi Hospital, Mahidol University, Bangkok, Thailand. Psychiatric diagnoses were performed by psychiatrists based on the DSM-IV-TR.13 We collected data including age, gender, body mass index (BMI), psychiatric diagnosis, duration of current illness, concurrent medication, ECT data (e.g., stimulus intensity, seizure duration determined by electroencephalography [EEG], electrode placement method, and number of ECT sessions). In our study, PIC was defined by confusion, disorientation, motor restlessness, purposeless movement, nonresponse to verbal command following ECT within an hour in post-anesthetic care unit (PACU) and intravenous benzodiazepine (diazepam 5–20 mg or midazolam 2.5–5 mg) was necessary to manage disturbed behavior.14
The study protocol was approved by the Ethics Committee on Human Experimentation of the Faculty of Medicine, Ramathibodi Hospital, Mahidol University. Research was conducted in accordance with the Declaration of Helsinki of the World Medical Association.15 All patients provided verbal and written informed consent before participation.
ECT Treatment
Psychiatrists and anesthesiologists assessed all patients before receiving ECT. Lithium and benzodiazepines were discontinued at least 48 hours and 15 hours respectively before treatment. The ECT procedures were performed at the (PACU) by staffs, which included psychiatrists, psychiatric residents, anesthetic staff, psychiatric nurses, and anesthetic nurses. Anesthesia consisted of thiopental (2–5 mg/kg IV) or propofol (1–2 mg/kg IV) and succinylcholine (0.5–1 mg/kg IV). ECT was administered three times per week using the brief pulse wave (1.0 millisecond pulse width) generated by a Mecta Spectrum 5000Q (Mecta Corp, USA) or Thymatron System IV (Somatics, Northampton, USA).
The seizure threshold (ST) was determined at the first ECT session using the dose-titration method as shown in Table 1 for Mecta Spectrum 5000Q and in Table 2 for Thymatron System IV, except that males started at Step 2. The ST was defined as the dose at which there was definite evidence on the electroencephalogram of generalized seizure activity for at least 25 s. The method of electrode placement (bilateral [BL] or right unilateral [RUL]) was determined by the symptom severity, as determined by the treating psychiatrist.
 |
Table 1 Dose Titration Schedule and Parameter Settings for Mecta Spectrum 5000Q |
 |
Table 2 Dose Titration Schedule and Parameter Settings for Thymatron System IV |
The stimulus intensity was then increased to 500% above ST for RUL electrode placement and 50% above the ST for BL electrode placement.16 Treatment was typically stopped when maximal improvement (remission or plateau of effect) was reached as assessed by standardized psychiatric rating scales or when adverse effects limited further treatments. Psychiatric rating scales, including the Brief Psychiatric Rating Scale (BPRS)17,18 for schizophrenia, Montgomery Asberg Depression Rating Scale (MADRS)19,20 for depression, and Young Mania Rating Scale (YMRS)21,22 for mania, were used to assess the severity of symptoms at baseline (24 hours before ECT), after every 3 sessions of ECT treatment, and after the last ECT session. Assessments were performed by staff and psychiatric residents who had received appropriate training. Assessments of inter-rater reliability were performed using the intraclass correlation coefficient (ICC). The ICC was 0.9. Remission was defined as follows: BPRS < 31 for schizophrenia,17 MADRS < 10 for depression,19 and YMRS < 10 for mania.21,22
Statistical Analysis
Demographic data between patients with and without PIC were compared with Chi-squared and Fisher’s exact tests for categorical parameters and t-tests for continuous parameters. Correlations between PIC and demographic data, clinical characteristics, and ECT treatment variables were carried out using Pearson correlation. Variables included for analysis were gender, age, BMI, psychotropic drug (number of concomitant psychotropic drugs and classes of drugs), anesthetic agent, electrode placement method, number of ECT sessions, stimulus intensity, and EEG seizure duration.
Multivariable logistic regression analysis was used to examine the association of PIC to demographic and clinical variables. The strength of the association was presented by odds ratio with 95% confidence interval (95% CI). P-value was set at < 0.05. All statistical analysis were performed using SPSS 21.0 for Windows (IBM Corp., Armonk, NY, USA).
Results
Demographic Characteristics
Seventy-nine patients were included in the study. The clinical characteristics of the 79 patients are shown in Table 3. The total number of ECT was 912 sessions.
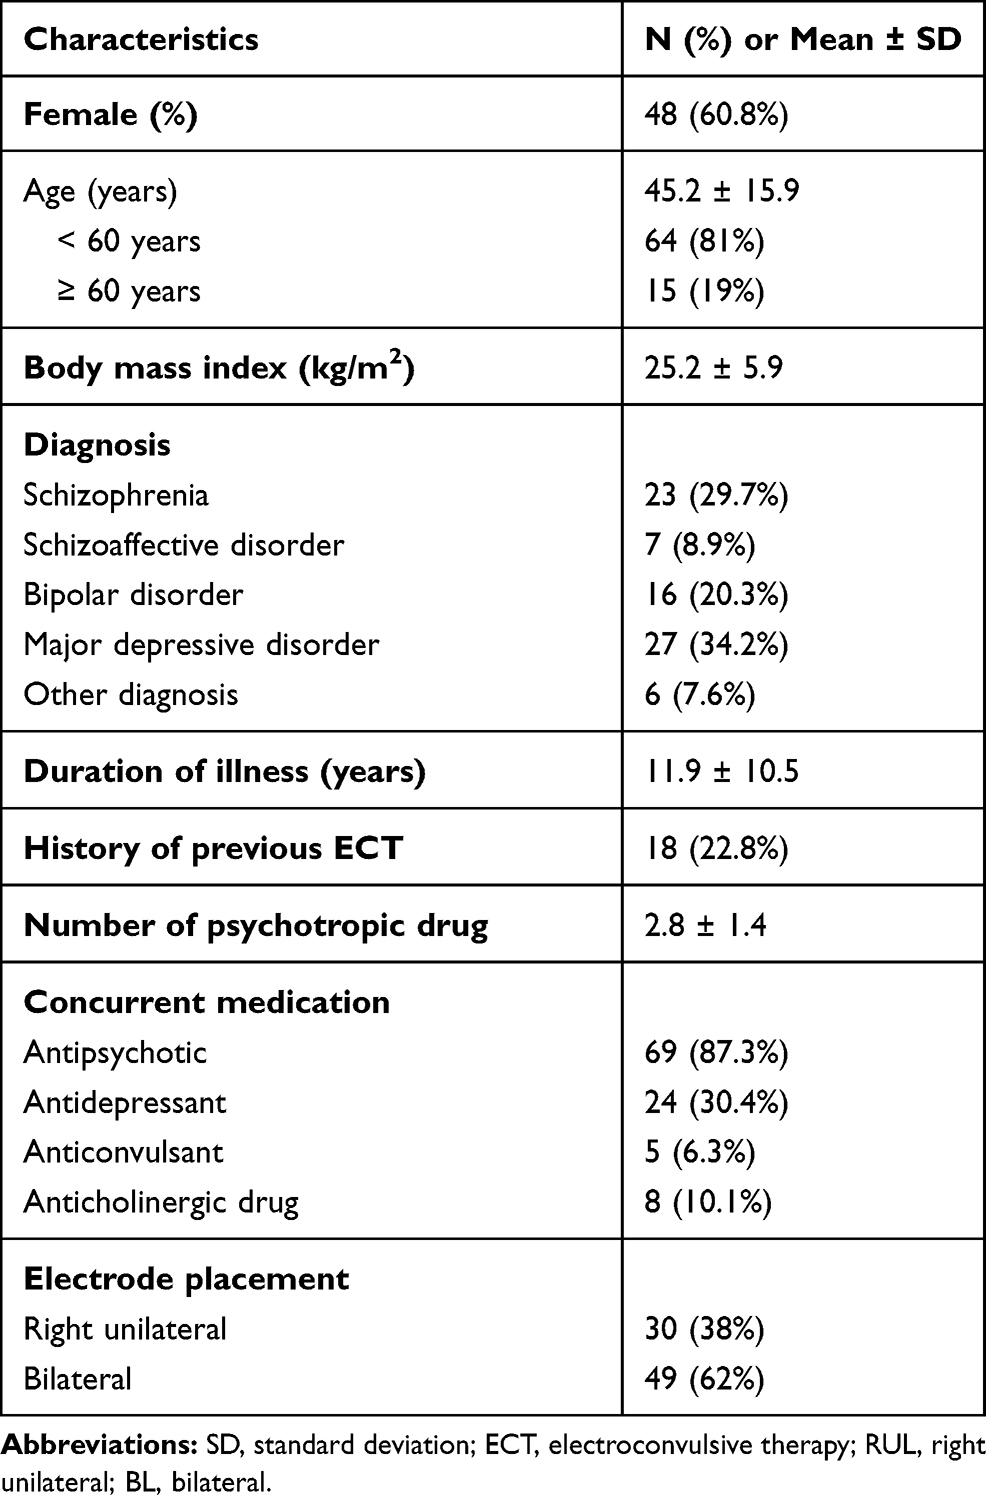 |
Table 3 Demographic Data (Total N = 79) |
Prevalence and Associated Factor of Postictal Confusion
Of the 79 patients, 29 (36.7%) developed PIC at one or more sessions during the ECT course while 63.3% (50/79) had no PIC. In 912 ECT sessions, the occurrence of PIC was 86 times (9.4%, 86/912).
Among 29 patients who developed PIC 37.9% (11/29) had only one PIC, 24.1% (7/29) had two PIC, 13.8% (4/29) had three PIC, 13.8% (4/29) had four PIC, 3.4% (1/29) had seven PIC, 3.4% (1/29) had eight PIC, and 3.4% (1/29) had eighteen PIC during the ECT course.
Patients with PIC compared to those without PIC were similar with respect to gender, age, duration of illness, psychiatric diagnosis, history of previous ECT, concurrent medication, anesthetic agent, electrode placement, number of ECT session, stimulus intensity, and EEG seizure duration, with the exception that patients with PIC had statistically significant higher BMI (27 ± 6.6 kg/m2 vs 24.1 ± 5.2 kg/m2, t = −2.22, df = 77, p = 0.029) than patients without PIC. Occurrence of PIC associated with BMI (Pearson correlation = 0.25, p = 0.029) (Table 4)
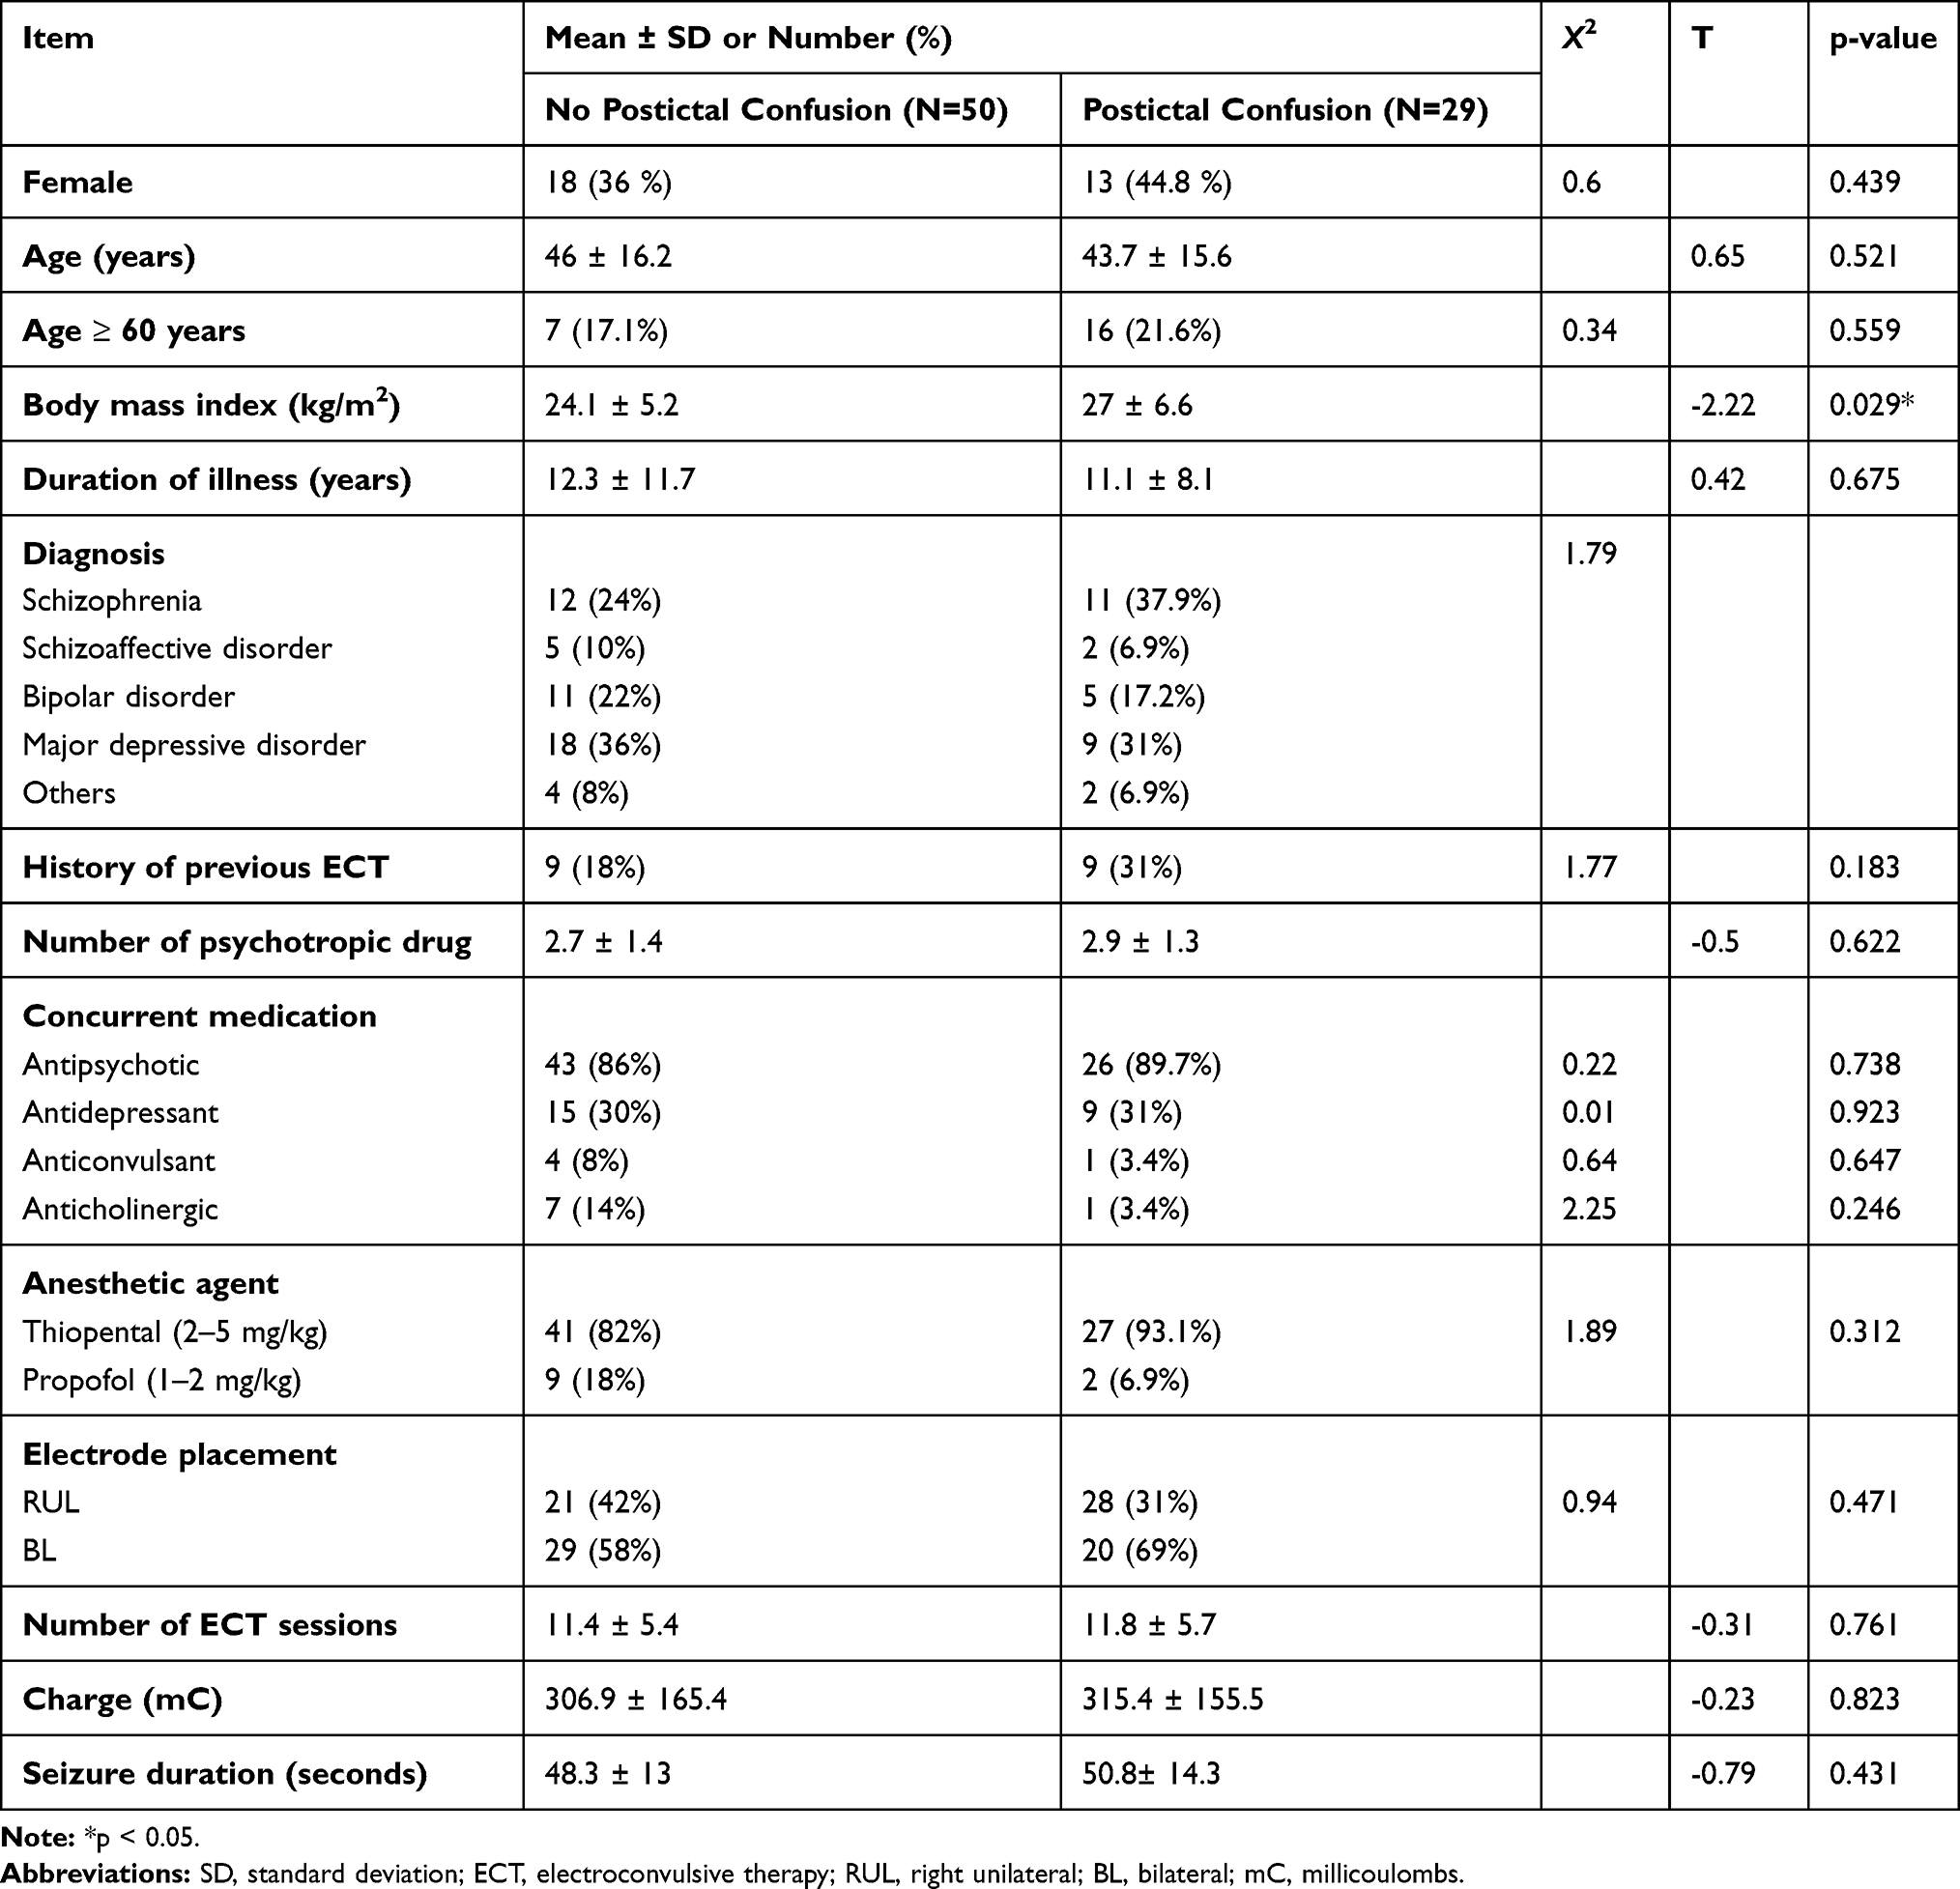 |
Table 4 Comparison Between Postictal Confusion and No Postictal Confusion Group |
Multivariable logistic regression analysis revealed that BMI was significant predictor of PIC after adjusting for other covariates (odds ratio = 0.91, 95% CI= 0.83–0.99, p < 0.035). The results for multiple logistic regression was demonstrated in Table 5.
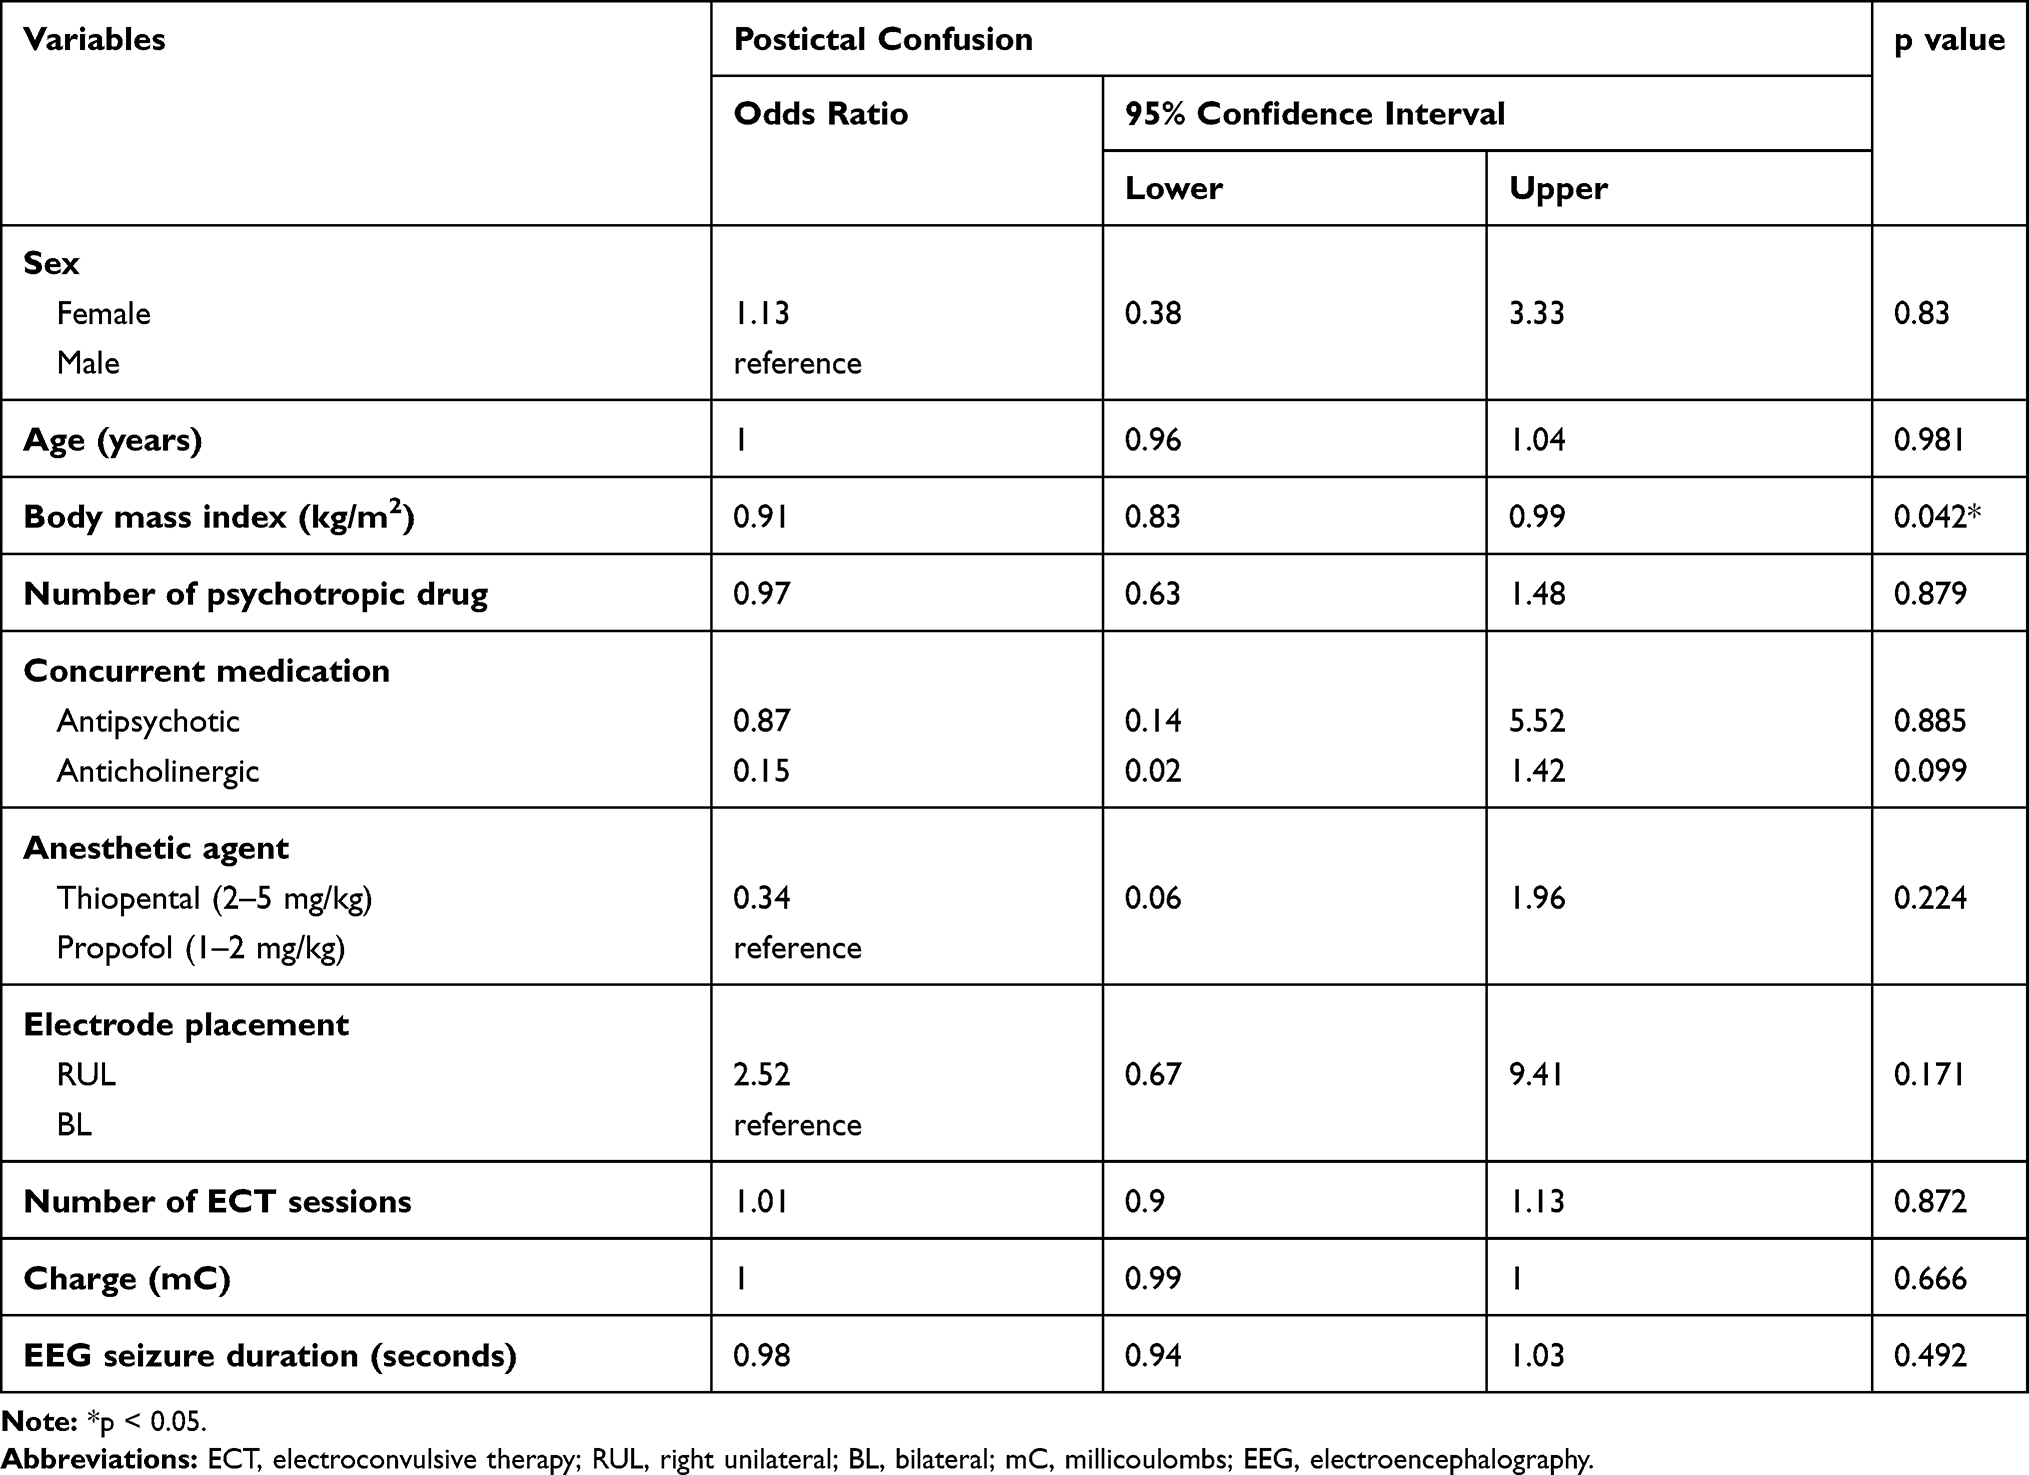 |
Table 5 Multivariable Logistic Regression Analysis for Postictal Confusion |
Discussion
In our study, ECT was commonly used to treat patients with major depressive disorders (34.2%) and schizophrenia (29.5%), while in other countries, ECT was most commonly used for major depressive disorders followed by bipolar depression and, significantly less commonly, schizophrenia and schizoaffective disorders, especially in the United States.23
Our study found that PIC was seen in 36.7% of patients receiving ECT. This result was lower than the prevalence in a previous study that reported prevalence was 62.1% in Thai psychiatric patients.4 In other studies, the prevalence of PIC was vary from 7% to 65%.1–3,7 This may be explained by difference of definition of PIC, in our study, we only included patients who required medication to control symptoms, therefore, the patients who had mild symptoms of PIC who did not require medication were excluded. Despite this variation in prevalence of PIC, studies have consistently demonstrated high prevalence of PIC in patients who receiving ECT.1–4
Furthermore, we found patients who developed PIC after ECT had higher BMI compared to those who had no PIC. PIC had a significant positive association with BMI. High BMI increased the likelihood of PIC in psychiatric patients who receiving ECT. These findings may be explained by patients who had higher BMI may have more frequently develop oxygen desaturation during ECT24,25 because ventilation is difficult in high BMI patients, that may lead to PIC. It would be interesting to investigate if PIC has an association with the degree of desaturation.
In our study, no association was demonstrated between PIC and other factors, including sex, age, concurrent antipsychotic and anticholinergic drug, number of psychotropic drugs, anesthetic agents, and electrode placement, stimulus intensity, EEG seizure duration. This finding was consistent with those of previous studies conducted by Devanand et al14 and Kikuchi et al.1
However, regarding electrode placement method and seizure duration, previous studies demonstrated that BL electrode placement associated with more frequent PIC26 and unilateral electrode placement can minimize risk of PIC.27 Long seizure duration is also associated with likelihood of PIC in PACU.3 These previous findings were in contrast with our finding. Obviously, the association between these factors with postictal agitation needs further elucidation.
A strength of this study was that we explored BMI as associated factors of PIC. However, this study has several limitations. First, subjects included in this study were all in-patients from a university hospital in Thailand, thus the results should be interpreted with caution in other settings. Second, there are other factors that might associated with PIC, which were not identified in this clinical sample (e.g., comorbid neurological disease, clinical features, and pretreatment anxiety, doses of antipsychotics). Third, sample size was small. Fourth, there was no correction for multiple comparison as this was an exploratory study. Finally, although we demonstrate an association between BMI and probability of PIC, we have not demonstrated causality.
Conclusion
In summary, PIC commonly occurred in patients receiving ECT. BMI was found to be an independent predictor of PIC. Psychiatrists should be aware of the potentially higher risk of PIC in patients with higher BMI.
Acknowledgments
Special thanks to staff at the Electroconvulsive Therapy Clinic, Ramathibodi hospital, for supporting the data collection process.
Author Contributions
All authors made substantial contributions to conception and design, acquisition of data, or analysis and interpretation of data; took part in drafting the article or revising it critically for important intellectual content; agreed to submit to the current journal; gave final approval of the version to be published; and agree to be accountable for all aspects of the work.
Disclosure
The authors have no potential conflicts of interest to disclose.
References
1. Kikuchi A, Yasui-Furukori N, Fujii A, Katagai H, Kaneko S. Identification of predictors of post-ictal delirium after electroconvulsive therapy. Psychiatry Clin Neurosci. 2009;63(2):180–185. doi:10.1111/j.1440-1819.2009.01930.x
2. Tzabazis A, Schmitt HJ, Ihmsen H, et al. Postictal agitation after electroconvulsive therapy: incidence, severity, and propofol as a treatment option. J ECT. 2013;29(3):189–195. doi:10.1097/YCT.0b013e3182887b5b
3. Reti IM, Krishnan A, Podlisky A, et al. Predictors of electroconvulsive therapy postictal delirium. Psychosomatics. 2014;55(3):272–279. doi:10.1016/j.psym.2013.03.004
4. Pitidhrammabhorn U, Ittasakul P, Waleeprakhon P, Goldman MB. Clinical characteristics of inpatients undergoing electroconvulsive therapy (ECT) In a university hospital, Thailand. ASEAN J Psychiatry. 2016;17(2):144–150.
5. Rao SS, Daly JW, Sewell DD. Falls associated with electroconvulsive therapy among the geriatric population: a case report. J ECT. 2008;24(2):173–175. doi:10.1097/YCT.0b013e3181579697
6. Sackeim HA, Decina P, Malitz S, Hopkins N, Yudofsky SC, Prohovnik I. Postictal excitement following bilateral and right-unilateral ECT. Am J Psychiatry. 1983;140(10):1367–1368.
7. Hermida AP, Janjua AU, Tang Y, Syre SR, Job G, McDonald WM. Use of orally disintegrating olanzapine during electroconvulsive therapy for prevention of postictal agitation. J Psychiatr Pract. 2016;22(6):459–462. doi:10.1097/PRA.0000000000000185
8. Andrade C, Arumugham SS, Thirthalli J. Adverse effects of electroconvulsive therapy. Psychiatr Clin North Am. 2016;39(3):513–530. doi:10.1016/j.psc.2016.04.004
9. Gomez J, Dally P. Intravenous tranquillization with ECT. Br J Psychiatry. 1975;127:604–608. doi:10.1192/bjp.127.6.604
10. el-Mallakh RS. Complications of concurrent lithium and electroconvulsive therapy: a review of clinical material and theoretical considerations. Biol Psychiatry. 1988;23(6):595–601. doi:10.1016/0006-3223(88)90006-6
11. Swartz CM. Electroconvulsive therapy emergence agitation and succinylcholine dose. J Nerv Ment Dis. 1990;178(7):455–457. doi:10.1097/00005053-199007000-00007
12. McGirr A, Berlim MT, Bond DJ, Chan PY, Yatham LN, Lam RW. Adjunctive ketamine in electroconvulsive therapy: updated systematic review and meta-analysis. Br J Psychiatry. 2017;210(6):403–407. doi:10.1192/bjp.bp.116.195826
13. American Psychiatric Association. Diagnostic and Statistical Manual of Mental Disorders: DSM-IV-TR. Washington, DC: American Psychiatric Association; 2000.
14. Devanand DP, Briscoe KM, Sackeim HA. Clinical features and predictors of postictal excitement. Convuls Ther. 1989;5(2):140–146.
15. World Medical Association. World medical association declaration of Helsinki: ethical principles for medical research involving human subjects. JAMA. 2013;310(20):2191–2194. doi:10.1001/jama.2013.281053
16. Ittasakul P, Likitnukul A, Pitidhrammabhorn U, Waleeprakhon P, Goldman MB. Stimulus intensity determined by dose-titration versus age-based methods in electroconvulsive therapy in Thai patients. Neuropsychiatr Dis Treat. 2019;15:429–434. doi:10.2147/NDT.S187589
17. Leucht S, Kane JM, Kissling W, Hamann J, Etschel E, Engel R. Clinical implications of brief psychiatric rating scale scores. Br J Psychiatry. 2018;187(4):366–371. doi:10.1192/bjp.187.4.366
18. Thompson PA, Buckley PF, Meltzer HY. The brief psychiatric rating scale: effect of scaling system on clinical response assessment. J Clin Psychopharmacol. 1994;14(5):344–346. doi:10.1097/00004714-199410000-00010
19. Hawley CJ, Gale TM, Sivakumaran T. Defining remission by cut off score on the MADRS: selecting the optimal value. J Affect Disord. 2002;72(2):177–184. doi:10.1016/S0165-0327(01)00451-7
20. Montgomery SA, Asberg M. A new depression scale designed to be sensitive to change. Br J Psychiatry. 1979;134:382–389. doi:10.1192/bjp.134.4.382
21. Kongsakon R, Bhatanaprabhabhan D. Validity and reliability of the young mania rating scale: Thai version. J Med Assoc Thai. 2005;88(11):1598–1604.
22. Young RC, Biggs JT, Ziegler VE, Meyer DA. A rating scale for mania: reliability, validity and sensitivity. Br J Psychiatry. 1978;133:429–435. doi:10.1192/bjp.133.5.429
23. Leiknes KA, Jarosh-von Schweder L, Høie B. Contemporary use and practice of electroconvulsive therapy worldwide. Brain Behav. 2012;2(3):283–344. doi:10.1002/brb3.37
24. Surve R, Bansal S, Sriganesh K, Subbakrishna DK, Thirthalli J, Umamaheswara Rao GS. Incidence and risk factors for oxygen desaturation during recovery from modified electroconvulsive therapy: a prospective observational study. J Anaesthesiol Clin Pharmacol. 2015;31(1):99–103. doi:10.4103/0970-9185.150555
25. Uakritdathikarn T, Chongsuvivatwong V, Geater AF, Vasinanukorn M, Thinchana S, Klayna S. Perioperative desaturation and risk factors in general anesthesia. J Med Assoc Thai. 2008;91(7):1020–1029.
26. Tsujii T, Uchida T, Suzuki T, Mimura M, Hirano J, Uchida H. Factors associated with delirium following electroconvulsive therapy: a systematic review. J ECT. 2019;35(4):279–287. doi:10.1097/YCT.0000000000000606
27. Heshe J, Röder E, Theilgaard A. Unilateral and bilateral ECT. A psychiatric and psychological study of therapeutic effect and side effects. Acta Psychiatr Scand Suppl. 1978;275:1–180.
 © 2021 The Author(s). This work is published and licensed by Dove Medical Press Limited. The
full terms of this license are available at https://www.dovepress.com/terms
and incorporate the Creative Commons Attribution
- Non Commercial (unported, 3.0) License.
By accessing the work you hereby accept the Terms. Non-commercial uses of the work are permitted
without any further permission from Dove Medical Press Limited, provided the work is properly
attributed. For permission for commercial use of this work, please see paragraphs 4.2 and 5 of our Terms.
© 2021 The Author(s). This work is published and licensed by Dove Medical Press Limited. The
full terms of this license are available at https://www.dovepress.com/terms
and incorporate the Creative Commons Attribution
- Non Commercial (unported, 3.0) License.
By accessing the work you hereby accept the Terms. Non-commercial uses of the work are permitted
without any further permission from Dove Medical Press Limited, provided the work is properly
attributed. For permission for commercial use of this work, please see paragraphs 4.2 and 5 of our Terms.