Back to Journals » Clinical Ophthalmology » Volume 11
Prevalence and causes of blindness, visual impairment, and cataract surgery in Timor-Leste
Authors Correia M, Das T ![]() , Magno J, Pereira BM, Andrade V, Limburg H, Trevelyan J, Keeffe J, Verma N, Sapkota Y
, Magno J, Pereira BM, Andrade V, Limburg H, Trevelyan J, Keeffe J, Verma N, Sapkota Y
Received 20 July 2017
Accepted for publication 5 October 2017
Published 29 November 2017 Volume 2017:11 Pages 2125—2131
DOI https://doi.org/10.2147/OPTH.S146901
Checked for plagiarism Yes
Review by Single anonymous peer review
Peer reviewer comments 2
Editor who approved publication: Dr Scott Fraser
Marcelino Correia,1 Taraprasad Das,2,3 Julia Magno,1 Bernadette M Pereira,1 Valerio Andrade,1 Hans Limburg,4 John Trevelyan,5 Jill Keeffe,3 Nitin Verma,6 Yuddha Sapkota2
1National Eye Center, Guido Valadares National Hospital, Dili, Timor-Leste; 2International Agency for Prevention of Blindness South East Asia Regional Office, LV Prasad Eye Institute, Banjara Hills, Hyderabad, India; 3LV Prasad Eye Institute, Hyderabad, India; 4International Centre for Eye Health, London, UK; 5International Agency for Prevention of Blindness, London, UK; 6Ophthalmology Department, University of Tasmania and Sydney, Royal Hobart Hospital, North Hobart, TAS, Australia
Purpose: To estimate the prevalence and causes of blindness and visual impairment, cataract surgical coverage (CSC), visual outcome of cataract surgery, and barriers to uptake cataract surgery in Timor-Leste.
Method: In a nationwide rapid assessment of avoidable blindness (RAAB), the latest population (1,066,409) and household data were used to create a sampling frame which consists of 2,227 population units (study clusters) from all 13 districts, with populations of 450–900 per unit. The sample size of 3,350 was calculated with the assumed prevalence of blindness at 4.5% among people aged ≥50 years with a 20% tolerable error, 95% CI, and a 90% response rate. The team was trained in the survey methodology, and inter-observer variation was measured. Door-to-door visits, led by an ophthalmologist, were made in preselected study clusters, and data were collected in line with the RAAB5 survey protocol. An Android smart phone installed with mRAAB software was used for data collection.
Result: The age–gender standardized prevalence of blindness, severe visual impairment, and visual impairment were 2.8%, (1.8–3.8), 1.7% (1.7–2.3), and 8.1% (6.6–9.6), respectively. Cataract was the leading cause of blindness (79.4%). Blindness was more prevalent in the older age group and in women. CSC was 41.5% in cataract blind eyes and 48.6% in cataract blind people. Good visual outcome in the cataract-operated eyes was 62% (presenting) and 75.2% (best corrected). Two important barriers to not using available cataract surgical services were accessibility (45.5%) and lack of attendants to accompany (24.8%).
Conclusion: The prevalence of blindness and visual impairment in Timor-Leste remains high. CSC is unacceptably low; gender inequity in blindness and CSC exists. Lack of access is the prominent barrier to cataract surgery.
Keywords: blindness, prevalence, Timor, RAAB, population based survey
Introduction
Blindness and visual impairment are persistent global challenges despite the fact that nearly 80% of the causes are avoidable and 90% of those affected live in developing countries.1–9 Timor-Leste (East Timor) is a young nation in the South-East Asian region. Since independence in 1999, Timor-Leste has made significant progress in political stability, peace, and socioeconomic development. But it lags behind in some of the vital health status indicators such as the infant mortality rate (IMR), maternal mortality rate (MMR), vaccination coverage, undernutrition, and many infectious diseases including tuberculosis, malaria, and leprosy.10
The country is divided into 13 districts, 65 subdistricts, 442 suco (villages), and 2,225 aldea/villages. According to the 2010 census, Timor-Leste has a population of 1.06 million (males 51% and females 49%) and 10.3% are aged ≥50 years.11 It has one referral hospital in the capital, Dili, which provides general eye care services including correction of refractive error and cataract surgery; additionally, two provincial eye clinics provide primary eye care and refraction services.
The Ministry of Health (MoH) is working to establish and maintain a cost-effective health system, and eye health has been included in the strategic planning framework in recognition of the significant economic and social impact of blindness.
The East Timor Eye Program (ETEP) initiated in 2000 by the Royal Australasian College of Surgeons (RACS) included mobile eye care services by visiting volunteer Australian ophthalmologists. A permanent eye care service was established in Dili in 2004. The Fred Hollows Foundation, New Zealand, joined the initiative in 2005. Since then, >10,000 cataract surgeries have been performed with annual surgical outputs of >1,200 in recent years.12
A prevalence of blindness study conducted in 2005 in Bobonaro and Dili districts of Timor-Leste led to the publication of first data on eye care services in Timor-Leste. That study reported 4.1% blindness and 17.7% visual impairment among the population aged ≥40 years.13 The leading causes of blindness and visual impairment were cataract and uncorrected refractive error (URE), respectively. Based on the findings of the survey, a master plan in eye care was developed to expand eye care services through extensive community outreach, infrastructure, and human resource development. A repeat survey in the same population (2010) reported that the gender–age–domicile adjusted prevalence of blindness was 7.7% for visual acuity of 6/60 and 3.6% for visual acuity of 3/60 among Timorese aged ≥40 years.14 This study indicated that prevalence and causes of blindness were unchanged over the 5 years. A study in nearby rural Indonesia around the same time showed that blindness was 2.2% (all ages) and cataract was the leading cause of bilateral blindness (62.5%).15 In urban Indonesia, the prevalence of blindness was lower at 1.12% among those aged ≥40 years.16
Over the previous 15 years, there was some development in eye care services as a result of a collaborative effort by the government and international non-governmental organizations (INGOs). In 2015, the ETEP was handed over to the MoH with a phasing out of support from external development partners. Therefore, the MoH, Timor-Leste, decided to carry out a rapid assessment of avoidable blindness (RAAB) survey to assess the impact of on-going eye care service and to design the country-specific eye health strategic plan in line with the WHO Global Action Plan 2014–2019.17 The aim of the present study was to estimate the prevalence and causes of blindness and visual impairment, cataract surgical coverage (CSC), visual outcome of cataract surgery, and barriers to uptake of cataract surgery in Timor-Leste.
Method
The sample size was calculated with an expected prevalence of blindness of 4.5% (among people ≥50 years) with a tolerable β error of 20%, a non-compliance of 10%, and confidence levels of 95%. The design effect correction factor (DEFF) was 1.5 to compensate in sample size for the decrease in variation caused by the cluster sampling of 50 people in each cluster. Using these assumptions with the 2010 census data, the sample size was calculated at 3,336 in 67 study clusters. In order to achieve this, we subdivided the country into districts, subdistricts, sucos, and aldea (villages). The average population size of a village is 473, which represented an appropriate population unit to form a study cluster. Therefore, the list of all 2,227 villages across the 13 districts of the country comprised the sampling frame from which 67 villages were selected with a probability proportional to size. Among the selected villages, if the population was >1,000, it was divided as per compact segment sampling procedures and if <500 an adjacent village(s) was randomly chosen and combined to form the study cluster.
The data collection was preceded by a 4-day training of the field teams and a pilot study. Three survey teams were trained, of which two teams at any time were mobilized for field work, led by a local ophthalmologist. The training was carried out by a certified RAAB trainer (YS) and covered all survey team members.
The study teams were trained for data collection and were assessed for the inter-observer variability (IOV) in assessment of participants. The IOV was carried out in a village hall of a non-study cluster where 50 people aged ≥50 years were invited to undergo an eye examination. All three teams examined the same person for visual acuity, lens status, and assigning the cause of vision impairment if the presenting vision was worse than 6/18. The findings were masked between examination teams and entered into the IOV data entry RAAB5 software.
Detailed maps of selected study clusters were obtained and prepared prior to the data collection work. The direction of the starting point in the cluster was randomly chosen though it was usually from the local health post situated in the village. Selected eligible households were enrolled in the study in house-to-house visits until 50 people aged ≥50 years were enrolled in each cluster.
After enrollment and verbal consent, the demographics (age, gender, and habitat) and history of spectacle use were recorded. The presenting distance visual acuity was measured using a standardized tumbling E card. Pinhole visual acuity was tested in all eyes with visual acuity <6/18. The anterior segment eye examination was done initially with a flashlight. A direct ophthalmoscope assessed the media clarity and was further used for fundus examination. A dilated eye examination (with Tropicamide 1%) was performed if pinhole vision was worse than 6/18 unless there was obvious cataract or corneal opacity. Ocular surgery history and related information such as the date, location, and cost of surgery were recorded for those who had undergone eye surgery in the past. The barriers to cataract surgery were recorded in those who had visual acuity <6/18 in either eye due to cataract. Appropriate medications, prescriptions, and referrals were done after the examination. If the enrolled person was not found in the house and/or not returning in a couple of days, their vision status was obtained from the family members or the neighbors and the record was marked as unavailable for eye examination.
Data collection in this study was paperless. All findings were entered into a smartphone where the mRAAB software was installed. This software has screens for demography, visual acuity, and ocular examination findings. The data entry permits an incomplete data entry “as save” and allows a later completion for those who need a dilated eye examination. The software mRAAB has in-built validation rules and consistency checks and provides the option for checking of data before final saving by review screen. Inconsistencies or errors, if any, are shown in the review screen when the study participant was still present.
Blindness, severe visual impairment, and moderate visual impairment with presenting visual acuity (PVA) <3/60, 6/60, and 6/18 in the better eye, respectively, were defined as per the WHO classification.18 The following formula was used for CSC.
CSC in person: The proportion of people with bilateral cataract eligible for cataract surgery who have received cataract surgery in one or both eyes.
CSC in eyes: The proportion of cataract eyes that received cataract surgery (at 3/60, 6/60, and 6/18 levels).
We used the following statistical methods for data analysis: 1) the estimated prevalence of visual impairment and blindness and those attributed specifically to cataract; 2) 95% CI, and 3) odds ratio (OR) to assess risk factors on blindness and CSC. We considered a P-value <0.05 as significant.
The RAAB survey protocol is one of the methods of data collection for blindness surveys recommended in the WHO Global Action Plan 2014–2019.16 It has been implemented in more than 70 countries worldwide.19 The study protocol in Timor-Leste RAAB was in accordance with the Declaration of Helsinki for human research ethics. The protocol was approved by the National Health Research Committee, MoH, Timor-Leste (July 10, 2016). Verbal informed consent was obtained from each study participant before the eye examination, and the participants were told that the participation was voluntary and that they were free to withdraw at any point. It was always explained that the name and identification of the study participant would not appear in any form of report generated from this study. No monetary incentive was offered for participation in this study.
Results
The findings of inter-observer agreement Kappa analysis were 0.65 for presenting vision and 0.75 for assigning the principal cause of visual impairment within acceptable range according to the RAAB survey instruction manual.
Age and gender distribution of Timor-Leste Census 2010 data for the population and study participants showed a fairly similar pattern of distribution. The 80–99 and the 60–69 years age groups were slightly overrepresented in the sample, while the 70–79 and the 50–59 years age groups were slightly underrepresented (Table 1). These variations were adjusted in the survey results and presented as age–gender adjusted results.
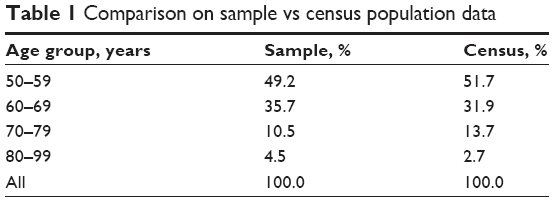 | Table 1 Comparison on sample vs census population data |
Of the 3,350 enrolled eligible residents, 97.1% (n=3,253) participated in the study. Among the examined population, 48.5% were male and 51.5% were female. Age and gender distribution of enrolled vs examined people is shown in Table 2.
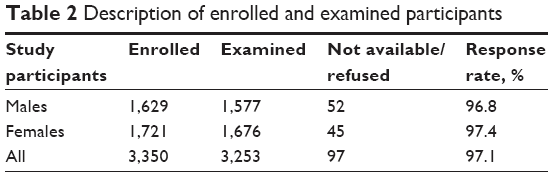 | Table 2 Description of enrolled and examined participants |
Prevalence of blindness and visual impairment
The overall age- and gender-adjusted prevalence of blindness with PVA <3/60 was 2.8% in persons and 4.6% among the eyes. The prevalence of blindness in females was relatively higher at 3.1% compared to males at 2.4% (OR 1.4, 95% CI 0.9–2.1, P=0.1), and was statistically not significant (Table 3).
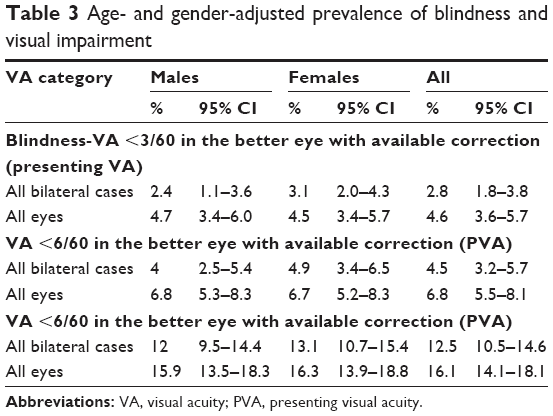 | Table 3 Age- and gender-adjusted prevalence of blindness and visual impairment |
The age- and gender-adjusted prevalence of severe visual impairment with PVA <6/60 was 4.5% (Male: 4.0%, Female: 4.9%); the prevalence of moderate visual impairment with PVA <6/18 was 12.5% (Male: 12.0%, Female 13.1%); and the crude prevalence of blindness with visual acuity <3/60 was 3.0% (Male: 2.5%, Female: 3.4%). The crude prevalence of blindness increased substantially with increasing age in both genders (Table 4).
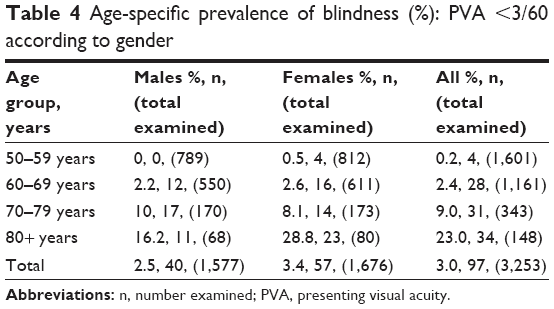 | Table 4 Age-specific prevalence of blindness (%): PVA <3/60 according to gender |
Causes of blindness
Cataract was the leading cause of bilateral blindness representing 79.4% of overall blindness. Other major causes of blindness were posterior segment problem (6.2%), glaucoma, and globe anomalies (5.2% each) (Table 5).
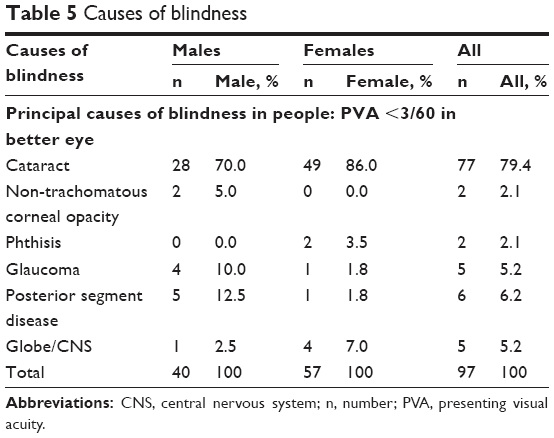 | Table 5 Causes of blindness |
Cataract is still the leading cause of severe visual impairment and moderate visual impairment among the Timorese population. URE contributed to almost one-third (32.2%) of moderate visual impairment (Table 6).
 | Table 6 Causes of severe visual impairment |
Cataract surgical coverage
Age–gender adjusted CSC in Timor is low among the cataract blind people (48.6%) and cataract blind eyes (41.5%). The situation is worse in female gender (31.3% and 30.4%, respectively) (Table 7).
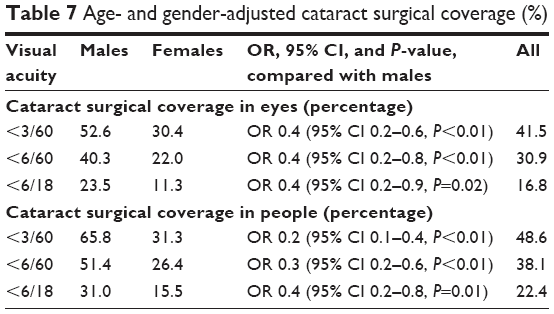 | Table 7 Age- and gender-adjusted cataract surgical coverage (%) |
Visual outcome of cataract surgery
In addition to low CSC, the surgical outcome is not meeting the WHO standard of >80% operated eyes achieving 6/18 or better. Based on the presenting and best-corrected visual acuities, good visual outcome of cataract surgery was recorded in 62% and 75.2% of cataract-operated eyes, respectively (Table 8). Adequate optical correction could considerably improve the visual outcome after cataract surgery.
 | Table 8 Visual outcome among the cataract-operated eyes |
The survey revealed that the visual outcomes have not improved in recent years despite the advancement of technology in cataract surgery. Conversely, the “good outcome” has declined from 77.8% 7 years ago to 57% in recent years (Table 9). More than half (52.4%) of the poor outcome following cataract surgery was related to long-term complications of surgery such as posterior capsule opacification and retinal detachment, and one-third (33.3%) were due to surgical complications. Among the borderline visual outcome, 45.2% were due to URE and 38.7% were due to long-term complications of cataract surgery (Table 10).
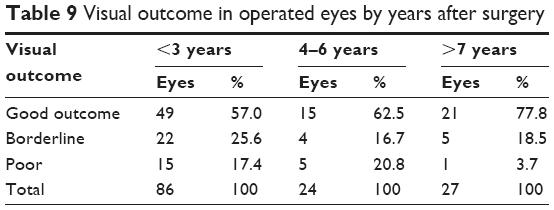 | Table 9 Visual outcome in operated eyes by years after surgery |
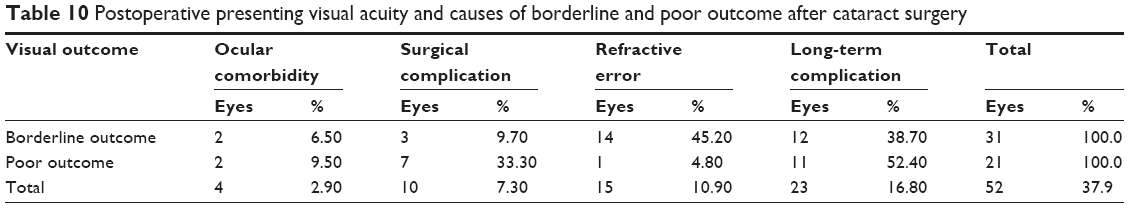 | Table 10 Postoperative presenting visual acuity and causes of borderline and poor outcome after cataract surgery |
Barriers to uptake of available cataract surgical services
Eye care services in Timor-Leste are free. However, this does not include indirect costs such as travel, accommodation, food, and wage loss of an accompanying person. The accessibility to service and lack of attendant were the main barriers at 45.5% and 24.8%, respectively (Table 11).
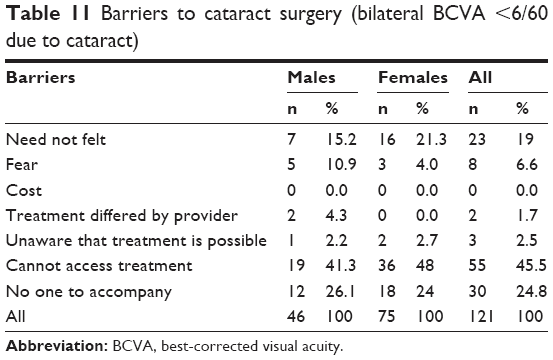 | Table 11 Barriers to cataract surgery (bilateral BCVA <6/60 due to cataract) |
Discussion
The current RAAB is a nationwide study in Timor-Leste unlike the previous surveys which were limited to a few selected districts around the capital city, Dili. All the population within the districts had an equal chance to get included as village-based clusters were selected with a probability proportional to size. As a result, this survey has the power to generalize results to formulate national planning for eye care services. The response rate at 97.1% was high with very few refusals or absentees.
Although the findings of this survey cannot be directly compared to the previous surveys as different age groups (≥50 years in the current study and ≥40 years in past studies) were sampled, it is clear that the prevalence of blindness has reduced in Timor-Leste compared to results in 2005 and 2010. The current age- and gender-adjusted prevalence of blindness is 2.8% (n=3,084) in people aged ≥50 years. The blindness is higher among females at 3.1% compared to males at 2.4% though statistically not significant. This gender inequality was not reported in previous surveys carried out in this country.
It is not surprising that cataract is the leading cause of blindness though the fact that this prevalence is nearly 30% more than the global prevalence is surprising.20 Glaucoma and traumatic corneal opacity are other major causes of blindness in the country. As trachoma (TT) has been identified in some areas of the country, a detailed trachoma survey is warranted.
Although most of the bilateral blindness in the country is due to cataract and >90% of surgeries are done for cataract, the CSC is very low (<50% in all three visual acuity categories, among the people and in eyes). The CSC among females is significantly lower, nearly half that of cataract blind eyes in males (OR 0.65, 95% CI 0.62–0.69, P≤0.01). This finding was not reported in previous surveys.
Overall, there were fairly good visual outcomes (PVA ≥6/18) of cataract surgery in Timor-Leste at 62%; but this does not meet the WHO recommendations of >80%. The declining proportion of good outcome over the years despite the advances in surgical techniques and technology in cataract surgery is indeed alarming. In the poor outcome group, seven of 21 (33%) eyes had intraoperative complications and among the borderline outcome group, 14 of 31 (45.2%) eyes had URE. These findings clearly suggest that there is scope for further improvement of visual outcome by improving surgical quality and optical services, including biometry. The prominent barriers among unoperated cataract blind people were the accessibility issues such as non-proximity of surgical services and lack of an accompanying attendant. This could have contributed to obvious gender disparity in CSC.
There were two limitations in this study: 1) the blindness definition included only the visual acuity (<3/60) and not the visual field; 2) the posterior capsular opacification was considered a post cataract surgery complication. In the absence of a visual field analyzer available in the system, the visual field was not included in the definition of blindness. Similarly, in the absence of a laser capsulotomy service (YAG Laser) the posterior capsule opacification was included as one of the post cataract surgery complications. The strength of the study was its nationwide inclusion, a systematic examination of the recruits using the accepted standards RAAB, and a good response.
Conclusion
In Timor-Leste, the prevalence of blindness and visual impairment is still challengingly high, although it has reduced compared to earlier surveys. Gender equity, quality, and accessibility issues for the services must be addressed to improve the general quality of eye care services of the country. Focus of intervention should be on reducing cataract blindness.
Acknowledgment
This research was funded by the Lions Clubs International Foundation SightFirst grant (SF1868/UND). The funding organization had no role in the design or conduct of this research.
Disclosure
The authors report no conflicts of interest in this work.
References
World Health Organization. Action plan for the prevention of avoidable blindness and vision impairment 2009–2013. World Health Organization. Available from: http://www.who. int/blindness/ACTION_PLAN_WHA62–1-English.pdf. Accessed April 25, 2017. | ||
Thylefors B, Négrel AD, Pararajasegaram R, Dadzie KY. Global data on blindness. Bull World Health Organ. 1995;73(1):115–121. | ||
Resnikoff S, Pascolini D, Etya’ale D, et al. Global data on visual impairment in the year 2002. Bull World Health Organ. 2004;82(11):844–851. | ||
Pascolini D, Mariotti SP. Global estimates of visual impairment: 2010. Br J Ophthalmol. 2012;96(5):614–618. | ||
Resnikoff S, Pascolini D, Mariotti SP, Pokharel GP. Global magnitude of visual impairment caused by uncorrected refraction errors in 2004. Bull World Health Organ. 2008;86(1):63–70. | ||
Bourne R, Price H, Taylor H, et al; Global Burden of Disease Vision Loss Expert Group. New systematic review methodology for visual impairment and blindness for the 2010 Global Burden of Disease study. Ophthalmic Epidemiol. 2013;20(1):33–39. | ||
Bourne R, Price H, Stevens G, GBD Vision Loss Expert Group. Global burden of visual impairment and blindness. Arch Ophthalmol. 2012;130(5):645–647. | ||
Stevens GA, White RA, Flaxman SR, et al; Vision Loss Expert Group. Global Prevalence of vision impairment and blindness: magnitude and temporal trends 1990–2010. Ophthalmology. 2013;120(12):2377–2384. | ||
Keeffe J, Taylor HR, Fotis K, et al; Vision Loss Expert Group of the Global Burden of Disease Study. Prevalence and causes of vision loss in Southeast Asia and Oceania: 1990–2010. Br J Ophthalmol. 2014;98(5):586–591. | ||
World Health Statistics 2014, World Health Organization. Available from: http://apps.who.int/iris/bitstream/10665/112738/1/9789240692671_eng.pdf. Accessed April 25, 2017. | ||
Population and Housing Census 2010, National Statistic Directorate, United Nation Population Fund, Dili, Timor-Leste. Available from: https://www.unicef.org/timorleste/2012_CECSUS-English_Publication_FINAL_English_Volume_4.pdf. Accessed April 25, 2017. | ||
Annual Report 2015, East Timor Eye Programme, Guide Valadares Hospital, Dili Timor-Leste. Available from: http://www.surgeons.org/for-the-public/racs-global-health/timor-leste/timor-leste-eye-program/. Accessed April 26, 2017. | ||
Ramke J, Palagyi A, Naduvilath T, du Toit R, Brian G. Prevalence and causes of blindness and low vision in Timor-Leste. Br J Ophthalmol. 2007;91(9):1117–1121. | ||
Ramke J, Brian G, Naduvilath T, Lee L, Qoqonokana MQ. Prevalence and causes of blindness and low vision revisited after 5 years of eye care in Timor-Leste. Ophthalmic Epidemiol. 2012;19(2):52–57. | ||
Saw SM, Husain R, Gazzard GM, Koh D, Widjaja D, Tan DT. Causes of low vision and blindness in rural Indonesia. Br J Ophthalmol. 2003;87(9):1075–1078. | ||
Sitorrus R, Oktariana VD, Affandi ES, et al; The Jakarta Urban Eye Health Study Group. Prevalence and causes of blindness and visual impairment in urban Indonesian adult population: The UrbanJakarta Eye Health Study. Invest Ophthalmol Vis Sci. 2010;51:125. | ||
Universal eye health, A global action plan 2014–2019, WHO ISBN: 978 92 4 1506564. Available from: http://www.who.int/blindness/actionplan/en/. Accessed April 26, 2017. | ||
WHO definition of Blindness. Available from: http://www.who.int/blindness/Change%20the%20Definition%20of%20Blindness.pdf. Accessed July 20, 2017. | ||
Hans Limburg, RAAB repository. Available from: http://www.iapb.org/blog/raab-repository-new-resource-eye-health-research-and-planning. Accessed July 20, 2017. | ||
Mariotti SP, Pascolini D. Global estimates of visual impairment: 2010. Br J Ophthalmol. 2012;96(5):614–618. |
 © 2017 The Author(s). This work is published and licensed by Dove Medical Press Limited. The
full terms of this license are available at https://www.dovepress.com/terms
and incorporate the Creative Commons Attribution
- Non Commercial (unported, 3.0) License.
By accessing the work you hereby accept the Terms. Non-commercial uses of the work are permitted
without any further permission from Dove Medical Press Limited, provided the work is properly
attributed. For permission for commercial use of this work, please see paragraphs 4.2 and 5 of our Terms.
© 2017 The Author(s). This work is published and licensed by Dove Medical Press Limited. The
full terms of this license are available at https://www.dovepress.com/terms
and incorporate the Creative Commons Attribution
- Non Commercial (unported, 3.0) License.
By accessing the work you hereby accept the Terms. Non-commercial uses of the work are permitted
without any further permission from Dove Medical Press Limited, provided the work is properly
attributed. For permission for commercial use of this work, please see paragraphs 4.2 and 5 of our Terms.