Back to Journals » Clinical Interventions in Aging » Volume 12
Pressure injuries in elderly with acute myocardial infarction
Authors Komici K, Vitale DF, Leosco D, Mancini A, Corbi G ![]() , Bencivenga L
, Bencivenga L ![]() , Mezzani A, Trimarco B, Morisco C, Ferrara N, Rengo G
, Mezzani A, Trimarco B, Morisco C, Ferrara N, Rengo G ![]()
Received 27 February 2017
Accepted for publication 18 May 2017
Published 19 September 2017 Volume 2017:12 Pages 1495—1501
DOI https://doi.org/10.2147/CIA.S135676
Checked for plagiarism Yes
Review by Single anonymous peer review
Peer reviewer comments 2
Editor who approved publication: Dr Richard Walker
Klara Komici,1 Dino F Vitale,2 Dario Leosco,1 Angela Mancini,1 Graziamaria Corbi,3 Leonardo Bencivenga,1 Alessandro Mezzani,4 Bruno Trimarco,5 Carmine Morisco,5 Nicola Ferrara,1,2 Giuseppe Rengo1,2
1Division of Geriatrics, Department of Translational Medical Sciences, University of Naples Federico II, Naples, Italy; 2Cardiac Rehabilitation Division, Salvatore Maugeri Foundation, IRCCS, Scientific Institute of Telese Terme (BN), Telese Terme, Italy; 3Department of Medicine and Health Sciences, University of Molise Campobasso, Campobasso, Italy; 4Cardiac Rehabilitation Division, Salvatore Maugeri Foundation, IRCCS, Scientific Institute of Veruno, Veruno, Italy; 5Division of Cardiology, Department of Advanced Biomedical Sciences, University of Naples Federico II, Naples, Italy
Objectives: To assess pressure injury (PI) incidence among patients hospitalized for acute myocardial infarction (AMI) in an intensive coronary care unit (ICCU) and to detect the impact of specific risk factors on the development of PI in this clinical setting.
Patients and methods: Prospective cohort study in ICCU setting. Patients admitted for AMI: patients mean age 67.5±11.5 years (n=165). Norton Scale, Mini Nutritional Assessment (MNA), demographic, clinical and biochemical data collected at the time of ICCU admission have been tested in a logistic model to assess the odds ratios (ORs) of PI risk development. The jackknifed area under the receiver operating characteristic curve (AUC) and the decision curve analysis have been employed to assess the additive predictive value of a factor.
Results: Twenty-seven (16.3%) patients developed PIs. An increased PI risk was associated with advanced age (OR =2.5 every 10-year increase; 95% CI =1.1–5.7), while probability of PI development was reduced in patients with higher left ventricular ejection fraction (LVEF) (OR =0.4 every 5% increase; 95% CI =0.24–0.66), MNA score (OR =0.65 every unit change; 95% CI =0.44–0.95) and Norton Scale score (OR =0.7 every unit change; 95% CI =0.57–0.88). The AUC and the decision curve analysis showed that LVEF inclusion improved the discrimination power and the clinical net benefit of the final model.
Conclusion: Age, LVEF, Norton Scale and MNA scores have a strong and independent clinical value as predictors of in-hospital PI development in patients with AMI. This finding has the potential to improve the clinical management of patients admitted in ICCU.
Keywords: pressure injury, Mini Nutritional Assessment, Norton Scale, acute myocardial systolic dysfunction
Introduction
Pressure injuries (PIs) are a common complication of multimorbidity, in particular in elderly patients hospitalized in acute and chronic care units and with limited mobility.1 PI epidemiology greatly varies depending on the clinical settings, with incidence rates ranging from 1% to almost 40% in acute care units and from 2% to 20% in long-term care units.2 In terms of costs, PIs represent a relevant socioeconomic burden, third in line only after cancers and cardiovascular diseases.3,4 PIs occur as the result of pressure alone or in combination with shear and/or friction applied to skin, recognizing several contributing factors. Albeit the mechanical pressure, inducing skin hypoperfusion, is recognized as a pivotal etiopathogenic aspect, several other intrinsic and extrinsic factors play a relevant role in PI incidence and progression. Importantly, PIs trigger an increased mortality burden independent from that related to the underlying pathology.5 Recognized intrinsic risk factors for PI occurrence are represented by age, immobilization, comorbidities, malnutrition, obesity and tissue hypoperfusion, while extrinsic risk factors are friction and shearing forces, skin moisture, duration and intensity of pressure, treatment with hypnotics or sedative drugs.6,7 Taking into account the presence and severity of all these risk factors, several scales, such as Norton Scale, Braden Scale or Waterlow Scale,8 have been implemented to give a prognostic estimate of PI incidence. Moreover, it has been reported that specific classes of patients, including subjects undergoing cardiac invasive and surgical procedures9,10 and patients with heart failure,11 are at particularly high risk for PI development.
Of relevance for the present study, PI risk factors in patients hospitalized in acute coronary care units for acute myocardial infarction (AMI) have not been fully investigated. Thus, the aim of the present study was to assess PI incidence and to detect the impact of specific risk factors measured at the time of hospital admission in this clinical setting.
Patients and methods
Study population
We enrolled 165 consecutive patients admitted at the intensive coronary care unit (ICCU) of the University of Naples Federico II with diagnosis of AMI from September 2014 to March 2015. All patients with AMI, with and without ST elevated myocardial infarction (STEMI or NSTEMI), were included in the study, with the only exclusion criteria being represented by the presence of PI at hospital admission. Patients with hospitalization length shorter than 72 hours were excluded, because PIs usually develop after 3 days of hospitalization.12 PI presence was assessed by examination of patient’s skin at the time of admission and during the entire hospitalization period. The Norton Scale, a validated and standardized tool for PI risk assessment,13 was administered to all patients at the time of the enrolment. Moreover, on the same day, patients underwent a complete clinical examination, including transthoracic echocardiography. Demographic and clinical data, including age, gender, body mass index (BMI), left ventricular ejection fraction (LVEF), systolic blood pressure (SBP), history of hypertension, dyslipidemia, diabetes and presence of other cardiovascular and noncardiovascular comorbidities, were also collected. Venous blood samples were collected in all patients, at the time of the hospital admission, to assess biochemical data, including hemoglobin, troponin I, albumin and serum creatinine levels to estimate glomerular filtration rate (GFR), as previously described.14 Finally, nutritional status in each patients was evaluated by Mini Nutritional Assessment (MNA) scale short form.15
To prevent PI development in ICCU admitted patients, our procedure provides the application of the following interventions: use of pH-balanced skin cleansers; promptly cleaning of skin after episodes of incontinence; weight control over time; assessment of fluid and food intake; nutritional support for patients with/at risk of malnutrition; regular repositioning of patients with/at risk for PI. Our institutional review board, the Ethics Committee of University of Naples Federico II, approved the study. The study protocol was explained in detail to patients or their relatives before enrolment and a written informed consent was obtained from all participants or their relatives.
Statistical methods
Continuous variables are expressed as mean ± standard deviation and interquartile range (IQR) while categorical variables are expressed as rates ±95% CI. According to the variable distribution normality, Student’s t-tests or Wilcoxon rank sum test was used to compare means of groups defined by the absence or the presence of PI. For categorical variables, a chi-square test was performed. Multivariate logistic regression analysis was used to identify the factors associated with the development of PI. Using parsimonious criteria and taking into account the study sample size to have at least 10 observations (patients) for each potential prognostic factor tested, 16 potentially prognostic independent variables were selected: age, gender, BMI, SBP, GFR, hemoglobin and albumin levels, troponine I, creatine kinase myocardial band (CKMB), LVEF, Norton Scale and MNA scale, history of diabetes, STEMI/NSTEMI, dyslipidemia and chronic obstructive pulmonary disease (COPD).
The model-building strategy was focused on the multivariable fractional polynomials (MFP)16,17 algorithm and was oriented to:
- Select the factors significantly associated with PI development and assess the weight of the relations by odds ratio (OR). In the final model, the ORs of the significant variables were computed relative to clinically meaningful differences for age and LVEF (10 years and 5% units, respectively) and relative to 1 scale unit difference for MNA and Norton Scale. Moreover, in order to compare each other the impact of the significant factors in the studied population, ORs relative to their IQR variations have also been computed.
- Assess the linearity or nonlinearity of these associations.
- Evaluate the stability and hence the internal validity of the results obtained using the “bootstrap” technique.18
In the final model, the stability of the association of each prognostic factor was measured by the number of times that each variable was included as significant in a large (5,000) number of bootstrap replications, applying the same MFP selection procedure (bootstrap inclusion frequency [BIF]). The stability of the linearity between each variable and the probability of PI development was measured by the frequency (in the bootstrap subset) of a significant linear vs nonlinear association.
Receiver operating characteristics curve analysis was applied to evaluate the performance of the final model. The area under the curve (AUC) was used as a measure of the model discriminant power and the McNeil test was used to compare the power of different models. The decision curve analysis19 was used to compare the net clinical benefit obtained applying a hypothetical treatment to prevent PI development under three possible strategies: 1) treat all patients; 2) treat none; 3) treat according to a prediction model. We compared two models: one with and one without LVEF. The decision curve analysis represents an innovative method to evaluate the expected cost-weighted benefit when the prognostic instrument under examination is applied to the clinical practice. This method is suitable to test alternative diagnostic or prognostic strategies that offer advantages over commonly used techniques. AUC and the clinical decision curve were assessed with the jackknife resampling procedure to avoid the “self-reference” bias of the standard analysis. All analyses were performed with 0.05 type I error threshold using STATA 14.1 software (Stata Corp. LP College Station, Texas, USA).
Results
In the total study population of 165 patients, mean age was 67.5±11.5 years, 122 subjects were males (73.9%), mean LVEF was 39.9±8.7 and 104 patients (63.0%) had STEMI (Table 1). The mean length of hospitalization stay was 7.0±3.2 days.
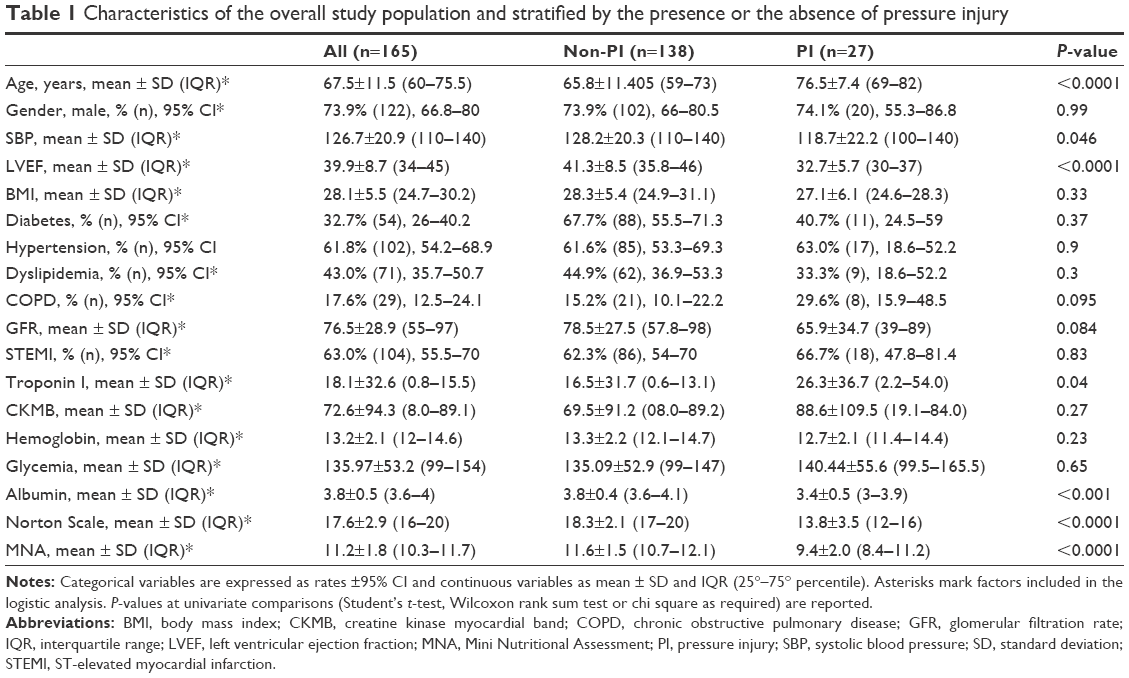 | Table 1 Characteristics of the overall study population and stratified by the presence or the absence of pressure injury |
Characteristics of patients with and without PI
Twenty-seven (16.3%) patients developed PI during the hospitalization period. No significant differences between patients with and without PI were observed for gender, BMI, cardiovascular risk factors, COPD, GFR, STEMI, CKMB, glycemia and hemoglobin levels. Patients who developed PI were more likely to be older and to have lower SBP, LVEF, plasma albumin levels, Norton Scale score and MNA score and higher baseline troponine I levels (Table 1). In the PI group the mean length of hospitalization was 11.8±3.1 vs 6.1±2.2 days in non-PI group (P-value <0.001).
In our study population 21 patients (21/27, 77.8%) presented stage 1 PI and six patients (6/27, 22.2%) stage 2 PI. PI stage 1 patients presented a mean age of 76.10±7.44 years and an LVEF of 33.14%±5.83%. PI stage 2 patients had a mean age of 77.83±7.68 years and LVEF of 31.33%±5.54%.
Determinants of PI development
At binary logistic regression analysis, only age, LVEF, MNA score and Norton Scale score were independent predictors of PI development with a pseudo R2 (Nagelkerke) of 62.7% (Figure 1). An increased risk of PI development was associated with advanced age (OR =2.5 every 10 years increase; 95% CI =1.1–5.7), while probability of PI development was reduced in patients with higher LVEF (OR =0.4 every 5% increase; 95% CI =0.24–0.66), MNA score (OR =0.65 every unit change; 95% CI =0.44–0.95) and Norton Scale score (OR =0.7 every unit change; 95% CI =0.57–0.88). To allow the comparison of the relative impact of significant factors and considering the exponential pattern of OR scale, ORs relative to IQR variations have been computed. In the studied population, the ORs relative to 1 IQR variation indicate that the strongest impact on PI development was exhibited by the LVEF (87% risk reduction for 1 IQR increase), followed by age (76% risk reduction for 1 IQR decrease), Norton Scale (75% risk reduction for 1 IQR increase) and MNA (64% risk reduction for 1 IQR increase).
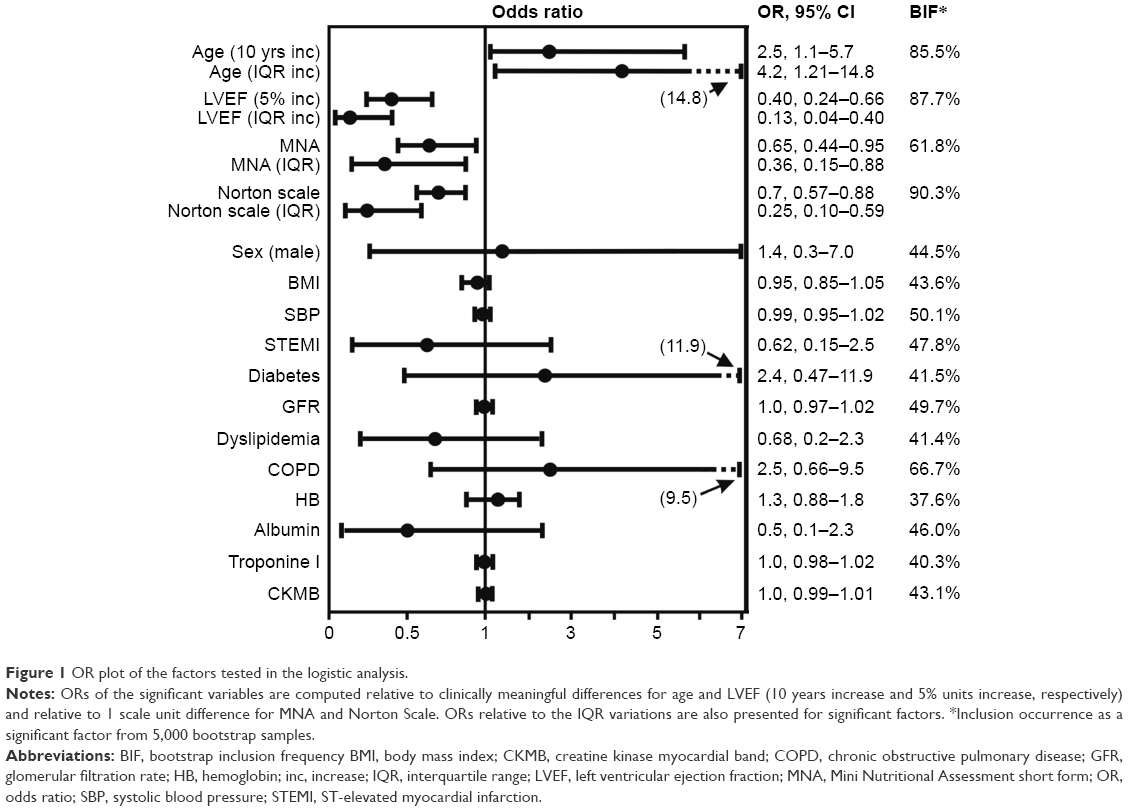 | Figure 1 OR plot of the factors tested in the logistic analysis. |
Norton Scale score showed the strongest stability (BIF =90.3%) followed by LVEF (BIF =87.7%) and age (BIF =85.5%), while MNA score BIF was 61.8%. A linear association was the most frequent functional form observed in the bootstrap sample (75.8%, 87.0%, 85.2% and 60.5%, for LVEF, Norton Scale, age and MNA, respectively). As depicted in Figure 2, LVEF strongly increased the discriminant power of the predictive model for PI development. Indeed, the jackknifed AUC of the full model was significantly higher than the model without LVEF (AUC =0.93±0.03; AUC =0.88±0.04, respectively; P=0.03).
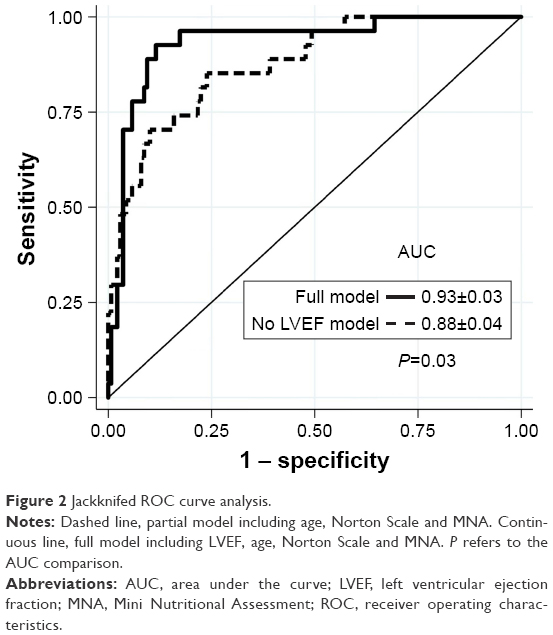 | Figure 2 Jackknifed ROC curve analysis. |
From a clinical perspective, LVEF improved the net benefit of the predictive model. As documented in the decision curve analysis graph (Figure 3), the full model showed a clinical net benefit profile higher than the model not including LVEF along all the relevant span of the threshold probability. Of note, both models exhibited profiles above those observed with the “treat all” and “treat none” strategies.
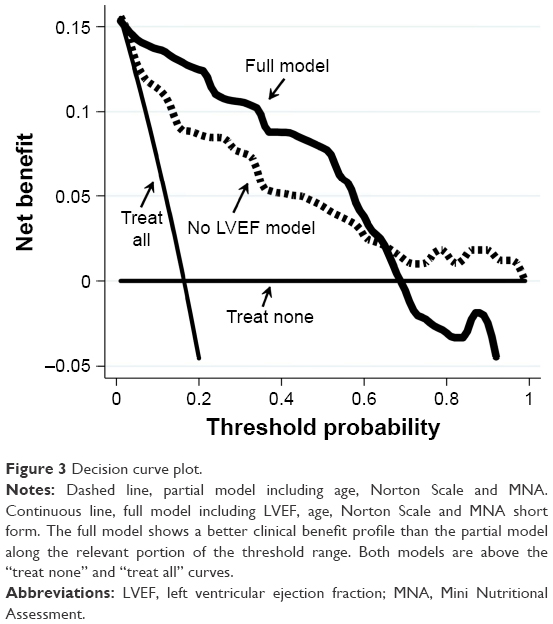 | Figure 3 Decision curve plot. |
Discussion
The most important finding of the present study is the identification of variables, measured at the time of ICCU admission, able to predict accurately the risk of PI development in patients with AMI. Our study indicates that age, LVEF, nutritional status and Norton Scale have a significant and independent clinical value as predictors of in-hospital PI development.
More than one million people per year develop PIs in the US and patients with cardiovascular disease are at high risk of PI development.20,21 Pokorny et al11 identified chronic heart failure as a significant risk factor for PI development following cardiac surgery. Moreover, in the clinical setting of intensive care unit, Cox22 recognized cardiovascular disease as a relevant comorbid condition in the prediction of PI incidence. However, despite the lowering in capillary tissue perfusion observed in patients with acute systolic dysfunction being identified as a predisposing factor for PI development along with malnutrition and immobilization, the present study represents, to the best of our knowledge, the first to describe LVEF as an independent PI risk factor. In this regard, our study indicates that 1) LVEF represents the most important risk factor for PI development in our population (Figure 1); 2) 5% decrease in LVEF poses the same risk rise of 10-year age increase (2.5-fold odds increase); 3) LVEF inclusion in the final model adds a significant higher discriminant power than the partial model without LVEF and exhibits a higher net benefit in the clinical utility analysis.
Importantly, there is a great interest in the identification of predictors of PI development especially in the acute-care setting. This interest derives from the necessity to identify patients at particularly high risk for developing PI, in order to implement in this patient subset prevention programs able to decrease PI-related morbidity, mortality and costs.23,24 In the acute-care setting, predictors of PI development in order to be effective for risk stratification need to be easily computable, available at the time of hospital admission and highly specific and sensible. Age, LVEF, MNA and Norton Scale fulfill these characteristics, and their predictive values should be easily tested in future larger and multicentric studies to confirm the excellent discriminant power, we observed, in identifying AMI patients at high PI risk.
Our data are consistent with the results of other studies that indicate a relationship between age and PIs.25–27 Coleman et al28 have performed a systematic review to identify independent predictors of PU development, and in this analysis age emerged as a relevant independent risk factor. The usefulness of Norton Scale has been already reported in several studies;29 however, the results of the present study extend previous findings to the clinical setting of patients admitted in ICCU for AMI. Furthermore, the nutritional status is an established risk factor influencing the development of PIs.30 Poor nutritional status may indeed interfere with blood flow, nutrient disposition, immune defenses and adequate peripheral oxygenation, thus predisposing to impaired wound healing.31 In line with this and consistent with our finding, Yatabe et al32 have reported that MNA predicts PI development in elderly patients admitted in acute-care setting. Plasma protein levels depend on the nutritional status,33 and a close association between hypoalbuminemia and PI development has been reported.34 It is worth noting that while albumin and troponin I levels were significantly different between groups with and without PIs at univariate analysis, these factors did not come out to be significantly associated with PI incidence at the logistic regression analysis. In this regard it is important to underline that the exclusion of a candidate factor from the final model is the combination of several features including, but not limited to, low variability of the factor within the population that results in a weak undetected effect, and/or a study power not adequate to identify an otherwise weak effect, and/or a weak effect in the population considered, and/or capture of a weak effect by other factors present in the model. In our study population of 165 subjects and selecting 16 potential variables for the multivariate analysis, we can be confident to capture strong associations between variables and PI risk development. Of note, the result observed for albumin levels (univariate/multivariate divergence) is consistent with the study by Yatabe et al.32
In our study population we observed a PI incidence of 16.3% among patients with AMI, which was consistent with Vanderwee et al,35 reporting an incidence rate for in-hospital PI development of 13.27%. However, it is important to underline that there are several reports available in the literature identifying a wide range of PI development rate in the acute care unit. This inconsistency can be explained by the heterogeneity in patient characteristics, specific clinical setting and the method adopted for data collection.
In our population, the percentage of patients developing PU is apparently high (16.3%). However, it is important to underline that our population includes elderly patients, suffering multiple comorbidities and admitted to the ICU with diagnosis of AMI. According to National Pressure Ulcer Advisory Panel guidelines, the use of structured risk assessment scales for identification of patients at risk for PI and malnutrition is recommended.36 In our study model, Norton Scale and MNA have shown a good predictive value, together with age and LVEF. Thus, in elderly patients with AMI and reduced LVEF, MNA and Norton Scale are important for the accurate identification of patients at risk for PI development. Besides cardiovascular interventional strategies in elderly patients with reduced cardiac function, a plan care, also based on the individual deficits of mobility and nutrition, should be developed.
Study limitations
The current study reports a single-center experience in a relatively small group of patients and, therefore, deserves further confirmation in future studies to allow an external validation of the present results both from a predictive and clinical utility point of view.
Conclusion
In patients hospitalized for AMI, LVEF is a strong and independent predictor of in-hospital PU development together with age, Norton Scale and MNA. Thus, we propose a simple predictive model including four variables able to accurately assess the risk of PI development. This may represent an important improvement in the clinical management among patients admitted in the ICCUs. Further research will need to give an external validation to the present results.
Disclosure
The authors report no conflicts of interest in this work.
References
VanGilder C, Amlung S, Harrison P, Meyer S. Results of the 2008–2009 international pressure ulcer prevalence survey and a 3-year, acute care, unit-specific analysis. Ostomy Wound Manage. 2009;55(11):39–45. | ||
Reddy M, Gill SS, Rochon PA. Preventing pressure ulcers: a systematic review. JAMA. 2006;296(8):974. | ||
Tricco AC, Cogo E, Isaranuwatchai W, et al. A systematic review of cost-effectiveness analysis of complex wound interventions reveals optimal treatments for specific wound types. BMC Med. 2015;13:90. | ||
Kuhn BA, Coulter SJ. Balancing the pressure ulcer cost and quality equation. Nurs Econ. 1992;10:353–359. | ||
Harris RP, Helfand M, Woolf SH, et al; Methods Work Group, Third US Preventive Services Task Force. Current methods of the US Preventive Services Task Force: a review of the process. Am J Prev Med. 2001;20(Suppl 3):21–35. | ||
Fogerty MD, Abumrad NN, Nanney L, Arbogast PG, Poulose B, Barbul A. Risk factors for pressure ulcers in acute care hospitals. Wound Repair Regen. 2008;16(1):11–18. | ||
Lyder C, Ayello E. Pressure ulcers: a patient safety issue. In: Hughes R, ed. Patient Safety and Quality: An Evidence-Based Handbook for Nurses. AHRQ publication no. 08–0043. Rockville, MD: Agency for Healthcare Research and Quality; 2008:1–33. | ||
Pancorbo-Hidalgo PL, Garcia-Fernandez FP, Lopez-Medina IM, Alvarez-Nieto C. Risk assessment scales for pressure ulcer prevention: a systematic review. J Adv Nurs. 2006;54(1):94–110. | ||
Husni EA. Skin ulcers secondary to arterial and venous disease. In: Lee BY, editor. Chronic ulcers of the skin. New York, NY: McGraw Hill; 1986:93–101. | ||
Lewicki LJ, Mion L, Splane KG, Samstag D, Secic M. Patient risk factors for pressure ulcer during cardiac surgery. AORN J. 1997;65(5):933–942. | ||
Pokorny ME, Koldjeski D, Swanson M. Skin care intervention for patients having cardiac surgery. Am J Crit Care. 2003;12(6):535–544. | ||
Chen HL, Shen WQ, Xu YH, Zhang Q, Wu J. Perioperative corticosteroids administration as a risk factor for pressure ulcers in cardiovascular surgical patients: a retrospective study. Int Wound J. 2015;12(5):581–585. | ||
Carlson EV, Kemp MG, Shott S. Predicting the risk of pressure ulcers in critically ill patients. Am J Crit Care. 1999;8(4):262–269. | ||
Baath C, Hall-Lord ML, Idvall E, Wiberg-Hedman K, Wilde Larsson B. Interrater reliability using Modified Norton Scale, Pressure Ulcer Card, Short Form-Mini Nutritional Assessment by registered and enrolled nurses in clinical practice. J Clin Nurs. 2008;17(5):618–626. | ||
Levey AS, Coresh J, Balk E, et al; National Kidney Foundation. National Kidney Foundation practice guidelines for chronic kidney disease: evaluation, classification, and stratification. Ann Intern Med. 2003;139(2):137–147. | ||
Vellas B, Villars H, Abellan G, et al. Overview of the MNA–its history and challenges. J Nutr Health Aging. 2006;10(6):456–463; discussion 463–465. | ||
Royston P, Ambler G, Sauerbrei W. The use of fractional polynomials to model continuous risk variables in epidemiology. Int J Epidemiol. 1999;28(5):964–974. | ||
Royston P, Sauerbrei W. Multivariate model building: a pragmatic approach to regression analysis based on fractional polynomials for modeling continuous variables. Chichester, UK: Wiley; 2008. | ||
Royston P, Sauerbrei W. Bootstrap assessment of the stability of multivariable models. Stata J. 2009;9(4):547–570. | ||
Van Calster B, Vickers AJ. Calibration of risk prediction models: impact on decision-analytic performance. Med Decis Making. 2015;35(2):162–169. | ||
Boyle M, Green M. Pressure sores in intensive care: defining their incidence and associated factors and assessing the utility of two pressure sore risk assessment tools. Aust Crit Care. 2001;14(1):24–30. | ||
Cox J. Predictors of pressure ulcer development in adult critical care patients. Am J Crit Care. 2011;20(5):364–375. | ||
Ayello E, Braden B. How and why to do pressure ulcer risk assessment. Adv Skin Wound Care. 2002;15(3):125–133. | ||
Demarré L, Van Lancker A, Van Hecke A, et al. The cost of prevention and treatment of pressure ulcers: a systematic review. Int J Nurs Stud. 2015;52(11):1754–1774. | ||
Bergstrom N, Braden B, Kemp M, Champagne M, Ruby E. Multi-site study of incidence of pressure ulcers and the relationship between risk level, demographic characteristics, diagnoses, and prescription of preventive interventions. J Am Geriatr Soc. 1996;44(1):22–30. | ||
Bours GJ, De Laat E, Halfens RJ, Lubbers M. Prevalence, risk factors and prevention of pressure ulcers in Dutch intensive care units: results of a cross-sectional survey. Intensive Care Med. 2001;27(10):1599–1605. | ||
Nijs N, Toppetes A, Defloor T, Bernaerts K, Milisen K, Van Den Berghe G. Incidence and risk factors for pressure ulcers in the intensive care unit. J Clin Nurs. 2009;18(9):1258–1266. | ||
Coleman S, Gorecki C, Nelson EA, et al. Patient risk factors for pressure ulcer development: systematic review. Int J Nurs Stud. 2013;50(7):974–1003. | ||
García-Fernández FP, Pancorbo-Hidalgo PL, Agreda JJ. Predictive capacity of risk assessment scales and clinical judgment for pressure ulcers: a meta-analysis. J Wound Ostomy Continence Nurs. 2014;41(1):24–34. | ||
Ohura T, Nakajo T, Okada S, Omura K, Adachi K. Evaluation of effects of nutrition intervention on healing of pressure ulcers and nutritional states (randomized controlled trial). Wound Repair Regen. 2011;19(3):330–336. | ||
Mathus-Vliegen EM. Old age, malnutrition, and pressure sores: an ill-fated alliance. J Gerontol A Biol Sci Med Sci. 2004;59(4):355–360. | ||
Yatabe MS, Taguchi F, Ishida I, et al. Mini nutritional assessment as a useful method of predicting the development of pressure ulcers in elderly inpatients. J Am Geriatr Soc. 2013;61(10):1698–1704. | ||
Vellas B, Guigoz Y, Baumgartner M, Garry PJ, Lauque S, Albarede JL. Relationships between nutritional markers and the mini-nutritional assessment in 155 older persons. J Am Geriatr Soc. 2000;48(10):1300–1309. | ||
Serra R. Grande R, Buffone G, et al. Albumin administration prevents the onset of pressure ulcers in intensive care unit patients. Int Wound J. 2015;12(4):432–435. | ||
Vanderwee K, Clark M, Dealey C, Gunningberg L, Defloor T. Pressure ulcer prevalence in Europe: a pilot study. J Eval Clin Pract. 2007;13(2):227–235. | ||
Haesler E, Kottner J, Cuddigan J; 2014 International Guideline Development Group. The 2014 International Pressure Ulcer Guideline: methods and development. J Adv Nurs. 2016;73(6):1515–1530. |
 © 2017 The Author(s). This work is published and licensed by Dove Medical Press Limited. The
full terms of this license are available at https://www.dovepress.com/terms
and incorporate the Creative Commons Attribution
- Non Commercial (unported, 3.0) License.
By accessing the work you hereby accept the Terms. Non-commercial uses of the work are permitted
without any further permission from Dove Medical Press Limited, provided the work is properly
attributed. For permission for commercial use of this work, please see paragraphs 4.2 and 5 of our Terms.
© 2017 The Author(s). This work is published and licensed by Dove Medical Press Limited. The
full terms of this license are available at https://www.dovepress.com/terms
and incorporate the Creative Commons Attribution
- Non Commercial (unported, 3.0) License.
By accessing the work you hereby accept the Terms. Non-commercial uses of the work are permitted
without any further permission from Dove Medical Press Limited, provided the work is properly
attributed. For permission for commercial use of this work, please see paragraphs 4.2 and 5 of our Terms.