Back to Journals » Open Access Emergency Medicine » Volume 12
Preparing for the Maximum Emergency with a Simulation: A Table-Top Test to Evaluate Bed Surge Capacity and Staff Compliance with Training
Authors Ceresa IF, Savioli G ![]() , Angeli V, Novelli V, Muzzi A, Grugnetti G, Cobianchi L
, Angeli V, Novelli V, Muzzi A, Grugnetti G, Cobianchi L ![]() , Manzoni F
, Manzoni F ![]() , Klersy C
, Klersy C ![]() , Lago P, Marchese P, Marena C, Ricevuti G, Bressan MA
, Lago P, Marchese P, Marena C, Ricevuti G, Bressan MA
Received 16 June 2020
Accepted for publication 8 October 2020
Published 16 November 2020 Volume 2020:12 Pages 377—387
DOI https://doi.org/10.2147/OAEM.S267069
Checked for plagiarism Yes
Review by Single anonymous peer review
Peer reviewer comments 4
Editor who approved publication: Dr Hans-Christoph Pape
Iride Francesca Ceresa,1 Gabriele Savioli,1,2 Valentina Angeli,3 Viola Novelli,4 Alba Muzzi,4 Giuseppina Grugnetti,5 Lorenzo Cobianchi,6 Federica Manzoni,7 Catherine Klersy,7 Paolo Lago,8 Pierantonio Marchese,9 Carlo Marena,4 Giovanni Ricevuti,10 Maria Antonietta Bressan11
1Emergency Department, San Matteo IRCCS Hospital Foundation, Pavia 27100, Italy; 2Department of Clinical-Surgical, Diagnostic and Pediatric Sciences, PhD School in Experimental Medicine, University of Pavia, Pavia 27100, Italy; 3Emergency Department, Sant’Andrea Hospital, Vercelli, 13100, Italy; 4Direzione Medica di Presidio, San Matteo IRCCS Hospital Foundation, Pavia 27100, Italy; 5SITRA, San Matteo IRCCS Hospital Foundation, Pavia 27100, Italy; 6Surgery, University of Pavia, Pavia 27100, Italy; 7Clinical Epidemiology and Biometric Unit, Scientific Direction, San Matteo IRCCS Hospital Foundation, Pavia, Italy; 8Ingegneria Clinica, IRCCS Policlinico San Matteo, Pavia 27100, Italy; 9Servizio Prevenzione e Protezione, IRCCS Policlinico San Matteo, Pavia 27100, Italy; 10Department of Drug Science, University of Pavia, Saint Camillus International University of Health Sciences, Rome, Italy; 11Emergency Department, IRCCS Policlinico San Matteo, Pavia 27100, Italy
Correspondence: Gabriele Savioli
Emergency Department, Irccs Policlinico San Matteo, Piazza Botta, 2, Pavia 27100, Italy
Tel +39 340 9070001
Email [email protected]
Introduction: The sudden increase in the number of critically ill patients following a disaster can be overwhelming.
Study Objective: The main objective of this study was to assess the real number of available and readily freeable beds (“bed surge capacity”) and the availability of emergency operating rooms (OR) in a maximum emergency using a theoretical simulation.
Patients and Methods: The proportion of dismissible patients in four areas (Medical Area, Surgical Area, Sub-intensive Care Units, Intensive Care Units) and three emergency OR was assessed at 2 and 24 hours after a simulated maximum emergency. Four scenarios were modeled. Hospitalization and surgical capacities were assessed on weekdays and holidays. The creation of new beds was presumed by the possibility of moving patients to a lower level of care than that provided at the time of detection, of dislocation of patients to a discharge room, with care transferred to lower-intensity hospitals, rehabilitation, or discharge facilities. The Phase 1 table-top simulations were conducted during the weekday morning hours. In particular, the 24-hour table-top simulations of a hypothetical event lasted about 150 minutes compared to those conducted at 2 hours, which were found to be longer (about 195 minutes). Phase 2 was conducted on two public holidays and a quick response time was observed within the first 40 minutes of the start of the test (about 45% of departments).
Results: The availability of simulated beds was greater than that indicated in the maximum emergency plans (which was based solely on the census of beds). Patients admitted to Intensive Care and The Sub-Intensive Area may be more difficult to move than those in low-intensity care. The availability of emergency OR was not problematic. Age influenced the possibility of remitting/transferring patients.
Conclusion: Simulation in advance of a maximum emergency is helpful in designing an efficient response plan.
Keywords: simulation, maximum emergency, table-top simulation, bed surge capacity, disaster medicine, maxiemergency
Introduction
Natural disasters may strike a population, simultaneously producing casualties and incapacitating even a well-developed health-care system.1,2 The sudden increase in the number of critically ill patients following a disaster can be overwhelming, and caregivers in this setting face major challenges in establishing a critical care capability.3
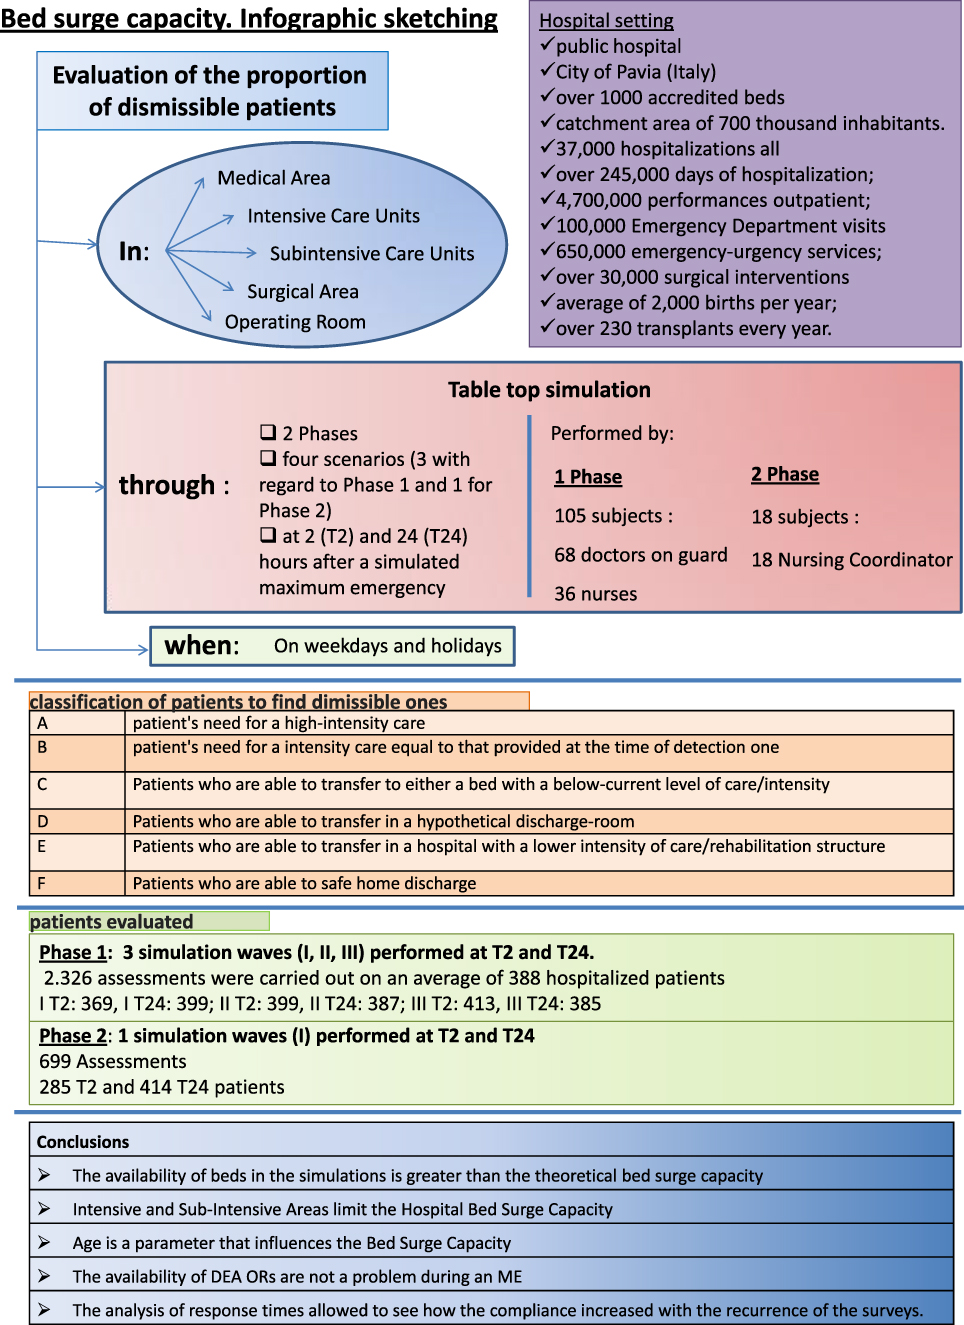 |
Figure 1 Infographic sketching. |
At the same time, it is necessary to create a hospital protocol to manage admission ED patients, because during a maximum emergency (ME) the problem of the ED crowding could be worse for the high number of the victims who add to the daily visits. (reference 1 revisore)31
A key parameter is the capacity to receive the injured presenting to hospital in a short time.1–16.
In Italy, under the Emergency Plan for Mass Influx of Casualties (PEIMAF), there is a legal obligation to declare the maximum number of injuries that a hospital can accommodate, with a color code for every hour in the first three hours.14,15 However, the hospital’s task is also to identify the capacity of available beds (bed surge capacity) that it can put in place during the maximum influx of patients. In Italy, there are no precise data on the capacity of available beds. In Israel, every hospital must make available at least 20% of the beds in a maximum emergency. Within the plan of response to a maximum emergency, bed surge capacity may be forgotten as a result. Usually, the declared number turns out to be purely theoretical, simply based on the number of single rooms that could potentially be turned into doubles, on barrier beds and insulation, or on a retrospective estimate of routine discharges.17–25 With this study, we look at the contribution of simulation to assess bed surge capacity and a contribution for the creation of a simplified model to measure the hospital resilience to natural disasters or any other emergency.32,33
At the same time, the study looked for to raise awareness the hospital staff to PEIMAF, because many studies highlighted the critical level of the disaster preparedness knowledge in Italian hospitals between emergency physicians and among different specialties regarding basic disaster planning and procedures.34,35
Objectives
The primary objective of our study was to assess through a theoretical simulation the real number of available and readily freeable beds (“bed surge capacity”) and the ready availability of operating rooms (OR). Comparing the proportion of dismissible patients at 2 and 24 hours from orthopedic, surgical, pneumology, and intensive care units, and testing the influence of age and diagnoses were secondary objectives.
Patients and Methods
Hospital Setting
The study is carried out in a public hospital located in Pavia (Italy), which has over 1000 accredited beds (catchment area of 700 thousand inhabitants).
It counts a very remarkable health production: 37,000 hospitalizations all with over 245,000 days of hospitalization; 4,700,000 performances outpatient; 100,000 EmergencyDepartment visits with 650,000 emergency-urgency services; over 30,000 surgical interventions and an average of 2000 births per year; over 230 transplants (marrow, kidney, heart, lung) every year (Figure 1).
Study Design
The study analysed the Bed Surge Capacity in the hospital through a table-top test of hospital reaction mechanisms. It is detected on weekdays and on holidays. We compared the proportion of dismissible patients (identified by A, B, C, D, E, or F codes) in the four areas (Medical Area, Surgical Area, Sub-intensive Care Units, Intensive Care Units) at 2 and 24 hours after a simulated maximum emergency, using four scenarios (three with regard to Phase 1 and one for Phase 2). On weekdays and holidays, hospitalization capacity was assessed categorizing the free/readily free beds by type (Medicine, Surgery, Intensive Care and Sub-Intensive); surgical capacity was assessed by availability of OR.
At the time of the test, the creation of additional beds was presumed by the possibility of moving inpatients to a lower level of care – than that provided at the time of detection – dislocating them to a discharge room with nursing assistance, transferring them to lower-intensity hospitals and to rehabilitation facilities or discharging at home (the options are identified by A, B, C, D, E, or F categories, respectively; Figure 1).
The six Phase 1 table-top simulations were conducted during the weekday morning hours, starting at approximately 10.30 a.m. with the end of the assessment at around 2:30 p.m. In particular, the table-top simulations from24-hour of a hypothetical event lasted about 150 minutes compared to those conducted at 2 hours, which were found to be longer (about 195 minutes). The Phase 2 was conducted from noon to 2 p.m. on two days off and a quick response time was observed within the first 40 minutes of the start of the test (about 45% of departments; Figure 1).
All hospitalized patients were included in the study. Free hospital beds were counted. There were no criteria for excluding patients for greater adherence to a hypothetical real situation. The participants of the study were inpatients admitted to the Medical Area (Nephrology, Rheumatology, Cardiology, Pneumology, General Medicine, and Gynaecology), Surgical Area (General Surgery, Vascular Surgery, Urology, Neurosurgery, Paediatric Surgery, Orthopaedics, Otolaryngology), Intensive care (Resuscitation), Sub-intensive departments (CCU and Stroke Unit) and operating rooms (OR) – located within the Emergency Department (DEA) of the IRCCS Polyclinic Foundation “San Matteo” (Figure 1).
In the data collection of patients admitted to the facility, the Phase 1 provided for the alternate involvement of both the medical staff (Department Watch Physician) and the nursing staff (NC Nursing Coordinator or his replacement), while in the Phase 2 only the NC was questioned. Both Phase 1 and Phase 2 involved only the ORs DEA NC for filling out the forms relating to the present or possible availability of the operating rooms. In Phase 1, the health staff (doctor and nursing) of the departments were notified about how to carry out the simulation of a maximum emergency by email, with no information about the day of the test. Two teams of doctors, technical and nursing staff, and university students were formed from Emergency Department, Presidio Medical Directorate (DMP), Service Prevention and Protection of the IRCCS Polyclinic Foundation “San Matteo,” and those studying “Medicine and Surgery” at the University of Pavia. The departments and staff involved are shown in Table 1.
 |
Table 1 Subjects Involved in the Fase 1 of the Study Divided by Area |
During the test, the nursing or medical staff were asked to place each inpatient within one of the six categories based on the patient’s clinical condition at the time of the test – at 2 or 24 hours from the hypothetical Mass Casualty Incident – and to indicate the current presence of free beds (see Tables 2 and 3). The hospital staff had also to add name, family name, age, sex and admission diagnosis for every inpatient involved.
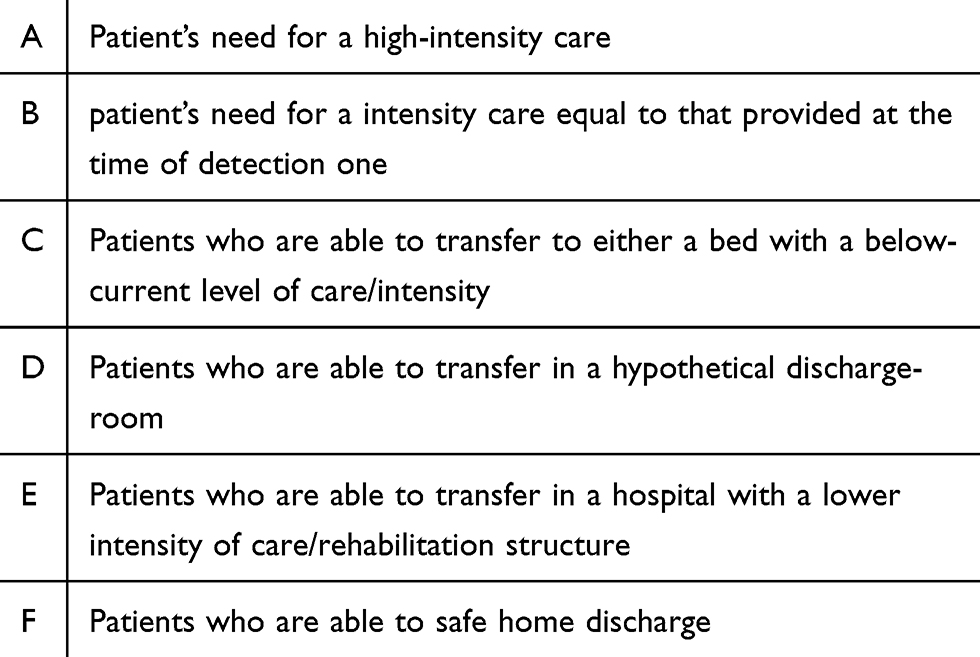 |
Table 2 The Six Categories A, B, C, D, E and F in Which Hospitalized Patients Have Been Stratified are Arranged in a Decreasing Order of Care Intensity in the Our Areas of Interest (Medical, Surgery, Bubintensive Care, Intensive Care) |
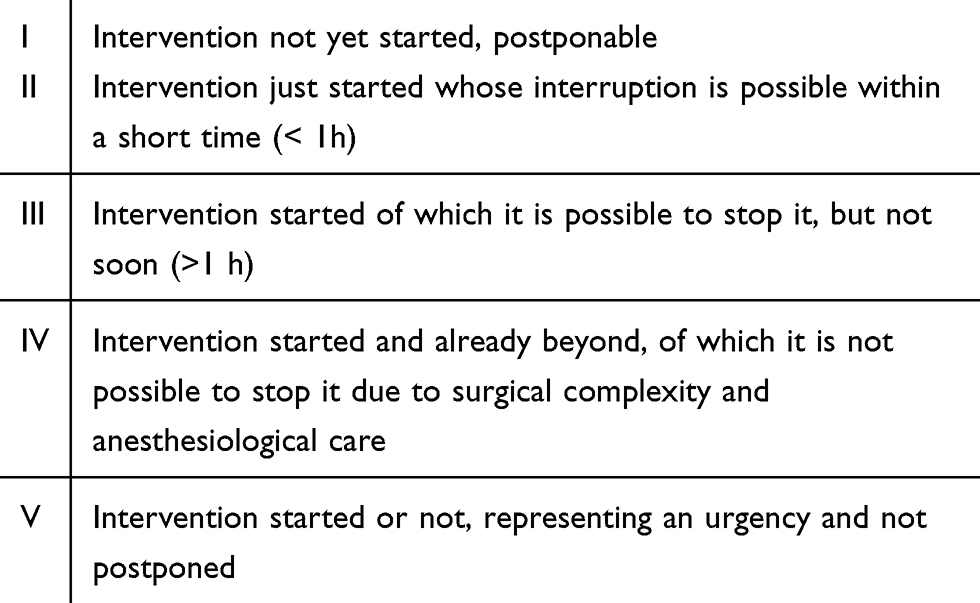 |
Table 3 The Five Categories I, II, III, IV, V in Which Patients Who Have to Undergo Surgery Have Been Stratified are Arranged in a Decreasing Order of the Possible Deferral of Surgery |
With regard to DEA ORs, the patients were stratified based on the possible postponement or interruption of the surgical procedure in one of the categories shown in Tables 2 and 3.
Data about name and surname of the patient and the kind and the urgent need of the surgical procedure are collected as shown in Table 4.
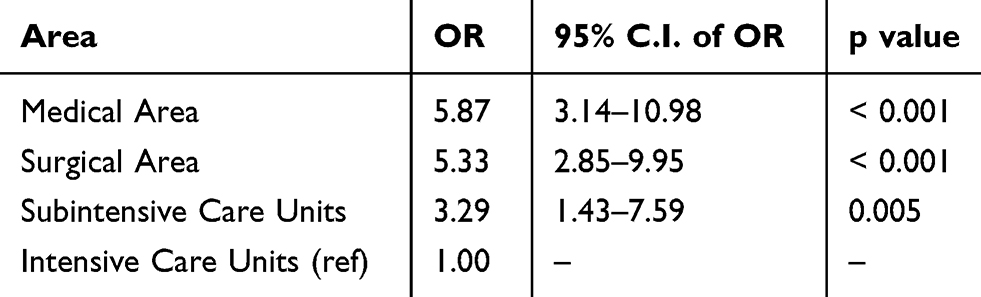 |
Table 4 Association Between the Proportion of Dismissible Beds and the Area: Results of the Logistic Regression Model (Intensive Care Units Set as the Reference), Globally for All the Simulation Waves |
The Phase 2 or the “Operational Phase” was carried out in a single simulation carried out on two weekdays (10 and 11 December 2018), with the two detection times at 2 and 24 hours from the occurrence of a hypothetical maximum emergency (T2 and T24). The departments and staff involved are shown in Table 5. At this stage, the NCs of the departments were asked for quantitative information in the required time slot about the availability of the department’s beds. And the number of patients could be stratified in one of the six categories shown in Tables 2 and 3 at 2 and 24 hours from an ME in the required time slot, and those present or reachable in a short period of time through the stratification of the patients in the six categories of discharge/discharge (see Tables 2 and 3) at 2 and 24 hours.
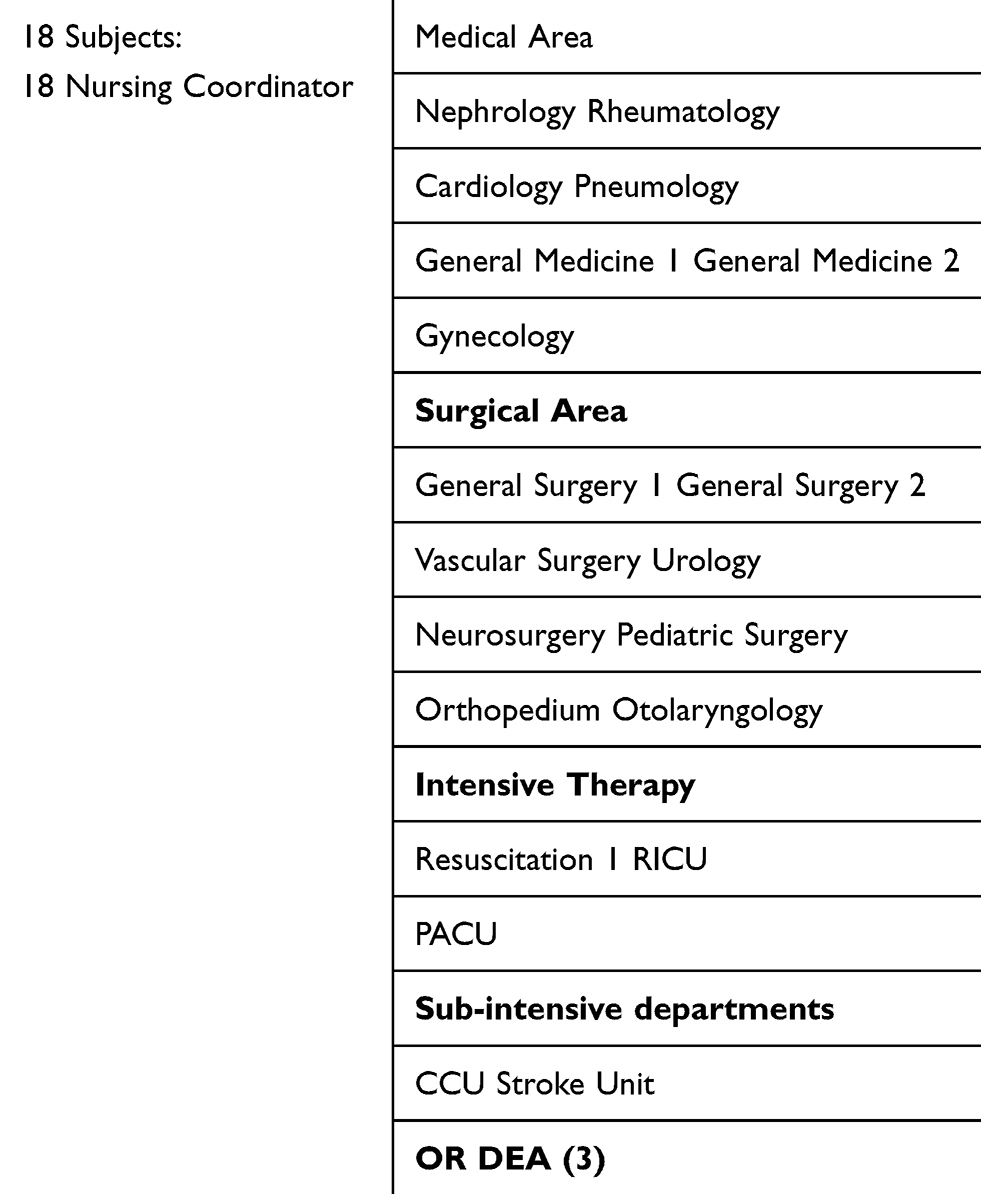 |
Table 5 Subjects Involved in the Fase 2 of the Study Divided by Area |
The project was submitted to the Ethics Committee of the Foundation that gave its clearance.
Statistical Analysis
Continuous variables were described with mean and standard deviation if normally distributed and median and interquartile range (iqr) if not normally distributed. Categorical variables were expressed with counts and percentages.
Primary Endpoint
The association between the proportion of dismissible patients (identified by A, B, C, or D codes) in the four areas (Medical Area, Surgical Area, Sub-Intensive Care Units, Intensive Care Units) was studied by means of logistic regressions models; the interaction between time of assessment (respectively 2 hours and 24 hours after a simulated maximum emergency) and area was tested. Pairwise comparisons across the levels of factor variables from the logistic models were performed. Opportune logistic regression models were drawn up distinctly for each simulation wave and a test for interaction between area and simulation wave was performed.
Secondary Endpoints
Logistic regression models were used to study the association between Unit (Orthopaedics, Surgery, Pneumology and Intensive Care Units) and the proportion of dismissible beds, with a test for interaction between time of assessment and area. Pairwise comparisons across the levels of factor variables from the logistic models were performed. Opportune logistic regression models were drawn up distinctly for each simulation wave and a test for interaction between Unit and simulation wave was performed.
The Chi-squared test was used to study the association between ICD-10 diagnostic chapter and the proportion of dismissible beds (coded as A, B, C, or D) at 2 hours after a simulated maximum emergency. By shifting from 2 to 24 hours after the maximum emergency, a binomial model was used in order to detect a potential increase in the proportion of dismissible beds.
The significance level was set at alpha = 0.05. Statistical analysis was performed with STATA statistical software version 14 (StataCorp, College Station, TX, USA).
Results
Study Population
Phase 1
A total of 2326 assessments were performed over the six detection times, carried out on an average of 388 hospitalized patients (I T2: 369, T24: 399; II T2 399, T24 387; III T2 413, T24 385), of whom 52% were over the age of 70 years, 54% were male, and 46% were female. In the six table-top simulations, 18% of patients were hospitalized for cardiovascular reasons (CV), 11% for respiratory reasons (R), 11% for musculoskeletal reasons (OM), 7% for cancer reasons (T), 7% for gastroenterology reasons (GE), 4% for urinary reasons (U), and 5% for neurological reasons (N). Forty-seven per cent of patients were admitted to the Surgical Area, and 45% to the Medical Area, while the Intensive Care and Sub-intensive wards comprised 4.5% of total admissions.
Bed Surge Capacity
In the case of a maximum emergency, the surveyed average number of hospital beds that could be freed was 252, considering the CDEF categories in the six simulations. This figure far exceeds the theoretical capacity of the hospital (53 based on the activated beds) on the basis of purely theoretical calculations, on the census of accredited standard beds, or on the basis of the available or readily recallable numbers.
The Impact of Care Intensity on Bed Surge Capacity
The association between the proportion of dismissible beds and the area (Medical Area, Surgical Area, Sub-intensive Care Units, Intensive Care Units) is not modified by the time of assessment (2 hours or 24 hours after the maximum emergency). So we focused on T2 assessment results, which are reported in Table 4. Compared to the Intensive Care Unit, in the Medical and in the Surgical Area the probability of detecting dismissible beds is more than five times higher (p < 0.001), and in the Sub-Intensive Care Unit is more than three times higher (p = 0.005). All the comparisons among the four areas analyzed are reported in Tables 4–7.
 |
Table 6 Association Between the Proportion of Dismissible Beds and the Area Globally for All the Simulation Waves: All the Comparisons Between the Four Areas Analyzed are Reported |
 |
Table 7 Association Between the Proportion of Dismissible Beds and the Area: Results of the Logistic Regression Model (Intensive Care Units Set as the Reference), Distinctly for Simulation Waves |
A significant interaction between area and simulation wave was reported, so we analyzed the association between the area and the possibility of discharge distinctly for simulation wave (see Table 7A–C)
The association between the proportion of dismissible beds and the four Units under study (Orthopaedics, Surgery, Pneumology, and Intensive Care Unit) is not modified by the time of assessment (2 hours or 24 hours after the maximum emergency), so we analyzed such association only at the 2-hour assessment. The results are reported in Table 8, while all the possible comparisons between the four areas are shown in Table 9.
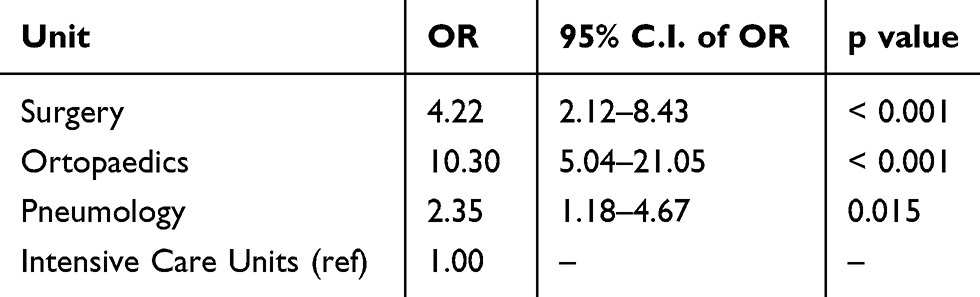 |
Table 8 Association Between Proportion of Dismissible Beds and Unit at 2 Hours After Simulated Maxiemergency Assessment: Results of the Logistic Regression Model (Intensive Care Units Set as the Reference), Globally for All the Simulation Waves |
 |
Table 9 Association Between the Proportion of Dismissible Beds and the Unit Globally for All the Simulation Waves: All the Comparisons are Reported |
We analyzed the association between the Unit and the possibility of discharge distinctly for each simulation wave (see Table 10), since a significant interaction between the Unit and the simulation wave was observed.
 |
Table 10 Association Between the Proportion of Dismissible Beds and the Unit Distinctly for Each Simulation Wave: Results of a Logistic Regression Models (Intensive Care Unit Set as Reference). a) First Simulation Wave; b) Second Simulation Wave; c) Third Simulation Wave |
A statistically significant association (p < 0.001) was reported between the proportion of dismissible beds and ICD-10 diagnostic chapter at two hours after a simulated maximum emergency (see Table 11). Table 1 shows the participants involved in the phases of the study divided by area.
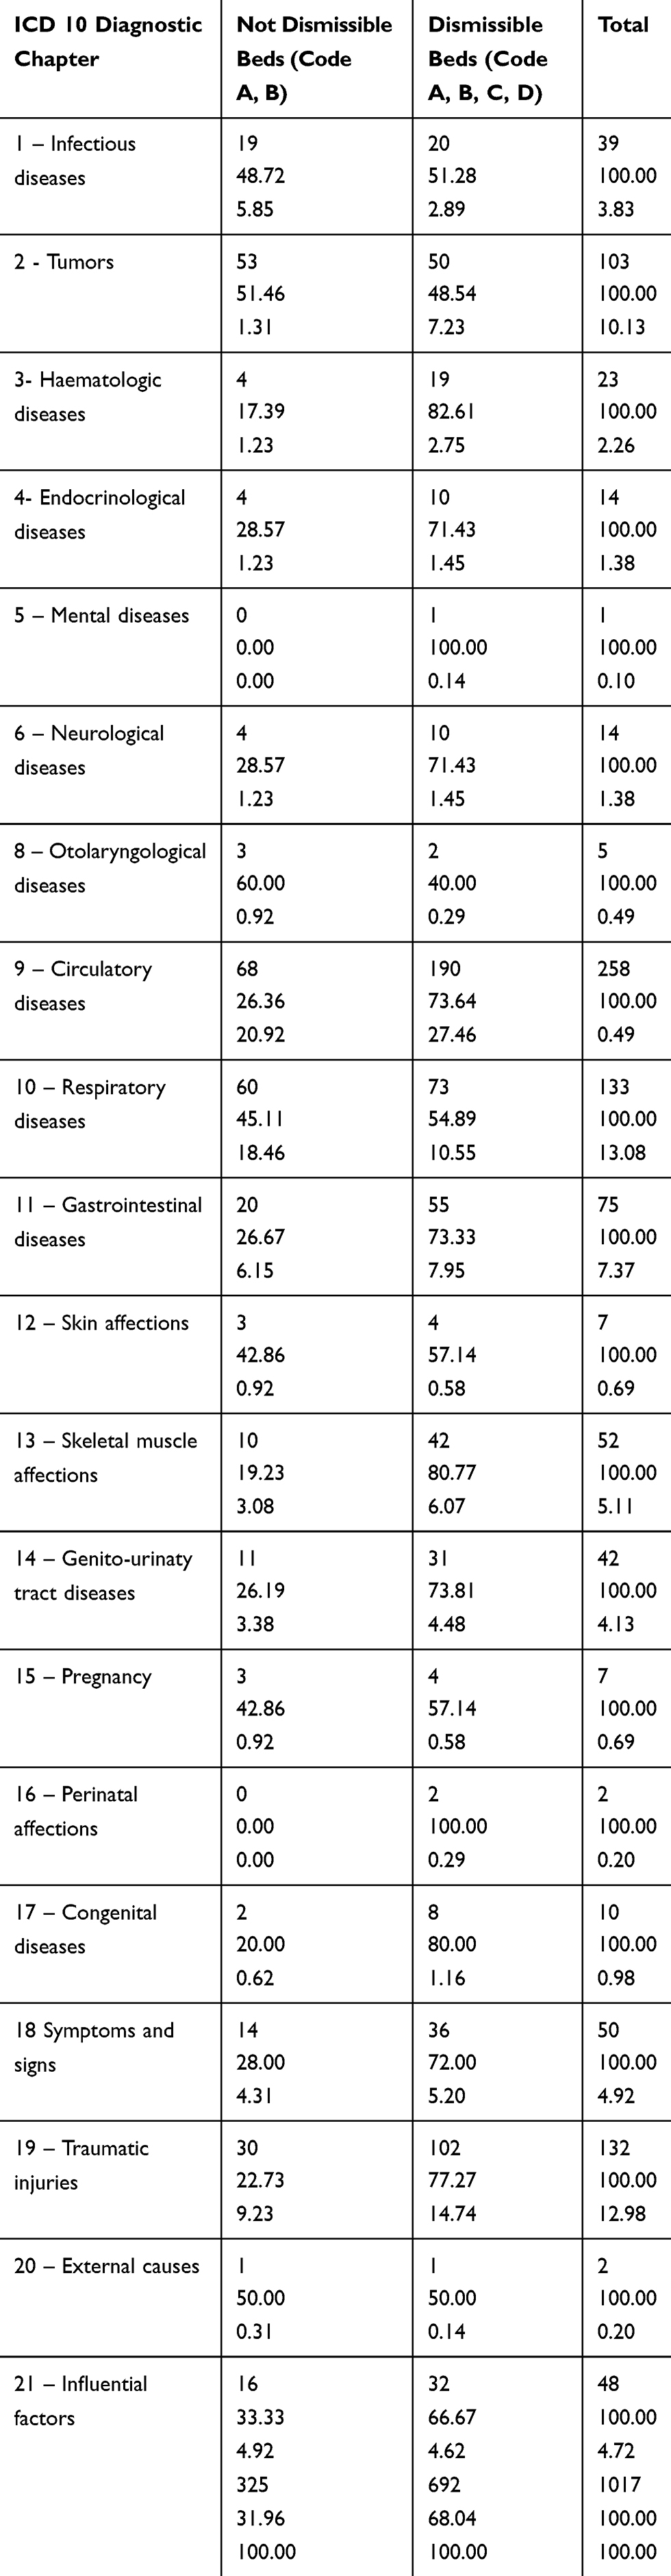 |
Table 11 Proportion of Not Dismissible and Dismissible Beds and ICD-10 Diagnostic Chapter |
Ready Availability of Operating Rooms
In the I simulation at T2, 70% of DEA OR were found to be available, while the other 30% were occupied by urgent interventions that could not be interrupted due to surgical and anesthesiological complexity (Class IV). At T24,70% of DEA OR were found to be available; 20% were occupied by two emergency interventions (class V), and 10% by elective procedures (class 1). In the II simulation at T2, 70% of DEA OR were found to be available, 10% were non-interruptible (class III), and 20% were not interrupted within a short period of time (CLASS II). At T24, 90% of DEA OR were found to be available, and 10% were occupied by an urgent operation with a break time of more than one hour.
Age of Patients
The parameters that most influenced the possibility of remitting/transferring patients were age and intensity of care. Median age for non-freeable beds was significantly higher (70 vs. 68 years; p = 0.014).
Phase 2
The Operational Phase saw the involvement of 18 subjects as indicated in Table 5. Assessments were performed on 285 T2 and 414 T24 patients, with an average of 350 patients evaluated. Free beds were found in 22% at T2 and 11% at T24, while free-free beds were about 57% in the first time of detection with a decrease to 47% detected in the second day. In the first day, 18% of patients were safely discharged, compared with 15% in T24, while the transfer to lower-intensity levels was 18% at T2 and 20% at T24. Transfer to a discharge room was 12% on the first day and 9% on the second day. Freeable beds were 46% in the sub-intensive wards and 50% in the Medical Area on the first and second days, but only 3% in Intensive care and 7% in the surgical area. Only 15% of OR DEAs were occupied, with 66% in category III, indicating surgery which it was possible to stop, but not within a short time (>1 h).
Employee Time and Compliance
Department compliance was evaluated on a scale of 1 to 10, taking the following four factors into account:
- Availability (maximum 3 points): the staff involved joined voluntarily.
- The compilation time in the required period (maximum 3 points): the response rate of the department and ROs was also assessed.
- Actual delivery of data (maximum 3 points): this included the completeness of the data delivered on sex, age, diagnosis, and data storage.
- Suggestions (maximum 1 point): suggestions, notes, or ideas regarding the management of patients transferred or hospitalized.
Discussion
Assessment of Bed Surge Capacity
The assessment of bed surge capacity is an enormously important datum as already highlighted in the literature and as in every scientific field of needs confirmation data performed in different scenarios to confirm the reproducibility of the data, in this case, made up of the various health organizations in the various states and regions.5–21
In our study, conducted in an Italian teaching hospital, we were able to see how where the availability of simulated beds was based solely on the census of beds, the availability of these beds is greater than that indicated in the maximum emergency plans. Due to the repeatability that has been found in simulations with regard to the stratification into categories of patients, mathematical models could be created which, based on clinical condition assessment scores of the patients could be applied to different hospitals grouped by type.
This data underlines, in our opinion, how it is very important for the management to perform simulations to estimate the bed surge capacity. It is likely that these simulations need to be repeated several times to get a realistic picture of the hospital’s actual ability to cope with a maxi-emergency. The data could also vary in the various periods of the year both for the different saturation of hospital beds at various times of the year and for the possible variations in the subpopulations admitted. For example, if the elderly hospitalized population increases during the winter. We will see in the dedicated paragraph how the age of hospitalized patients can be a factor that independently influences the bed surge capacity.
Intensive Care Beds Impact in Bed Surge Capacity
Intensive care is a strategic and high-saturation point, as also underlined by other studies.1,4,5,18 The main discriminator of bed surge capacity was not found to be the area of health care, but by the progressive decrease in the percentage of hospital beds freeable by moving from the lower-intensity departments in the medical and surgical field to the sub-intensive wards to end up in intensive care, as evidenced by the minimal difference between the free beds in the Medical Area and the Surgical Area in the various simulations. The calculation of receptivity is therefore constrained by the saturation rate of Intensive Therapies, despite the fewer patients admitted compared to the lower-intensity wards. The Company’s PEIMAF should therefore provide for a timely organization of how critical patients are transferred to intensive care therapies in neighboring hospitals or the possibility of organizing high-intensity treatment areas. This data is extremely important, as also highlighted by the maxi-emergency subsequently created by the COVID epidemic in our region.
Ready Availability of Operating Rooms
As there was a low rate of saturation and a high frequency of interventions that could be interrupted, the availability of OR DEAs was not problematic. This, in our opinion, is due to the fact that in a complex structure like ours, saturation depends more on the availability of the team in routine moments while there are always free rooms dedicated to urgent cases.
Age of Patients
One of the parameters that most influenced in our study the possibility of remitting/transferring patients was age. This in our opinion may be due to the fact that elderly patients had significant multi-morbidity, disability, instability of health, and social factors that required multidimensional assessment, diagnosis, and treatment.26–29 We also believe that this data should be carefully studied in Western states where the average age is high and the prevalence of the elderly and the elderly is high. In fact, these patients are often polypathological and require repeated hospitalizations for exacerbations of chronic diseases and therefore in some hospitals, they can cover a considerable percentage of hospitalized patients.26,27
Incremental Improvement in Case of Dual Assessment: Medical and Nursing
While the nurse coordinators were always involved in the Operational Phase and For The OR of Phase 1, both doctors and nurses were enrolled in the initial phase of the study, with greater involvement of the latter in the first table-top simulations, indicating the development of a greater attention by the medical staff to the simulation. Some qualitative differences were noted in the allocation of stratification categories, especially where there was an increase in the total percentage of patients who could be discharged home in the event of a maximum emergency (category F). The increase in the number of patients in this category during the study period is reflected by the fact that in the first and third assessments, which involved an equal number of doctors and nurses both on the first and second days, there was no change in percentage between the two detection times, but they are relevant if the average of the first and third simulations was taken into account (22% vs. 27%). Although this may reflect the different perspectives and priorities of doctors and nurses, it was not analyzed. We believe that this data is worthy of further studies, including multicentre studies.
Time of Evaluation and Staff Compliance
As regards the timing of the table-top simulations, they were almost stable in the six Phase 1 table-top simulations, as more knowledge of how the project was carried out by the staff was involved because it had already been sensitized the previous day. The repetition of simulations and the practical exercise carried out after a period of theoretical training are therefore valuable to make the healthcare staff faster and more effective in the decisions to be made during simulation of a maximum emergency. Respect for the time of data compilation, delivery of the detection material, and participation was good as assessed in terms of availability by simulation compliance, with an average of 7.5/10 out of 10. This data is in line with the literature data according to which the simulation and study of the actual response to a maxi-emergency occurred are the effective methods for studying bed surge capacity. In our opinion, starting from these data, periodic training is desirable not only in the emergency departments but in the entire hospital.2–21
Good results for close-knit staff, and after proper training, have already been highlighted in our research group.30,31
Policy Implications
The results of the study set the opportunity to redesign some aspects of the hospital organization. For example, the creation of a discharge room in the hospital could lay the opportunity to add this new arrangement not only during a ME, but in the routine life too. The implications of the idea of a discharge room could be better studied to understand what advantages could add in the hospital daily routine.
Indeed, the need of a simulation schedule in the hospital is another implication by the study as an important tool to exercise the preparedness and to track the improvement of the hospital personnel.
The role of a team composed by a medical doctor and a nurse to make decisions in the ward during an ME is an important conclusion of the study. The employment of these two figures lay to obtain a global view of the patient’s well-being.
Study Limitations
Our study has some limitations. First of all, our study has all the limitations of monocentric studies. Secondly, the object of the study (the discharge of some patients and the possibility of transferring others) does not have universally defined and recognized criteria and is a dependent operator.
Conclusions
The study show (Table 12, Figure 1) that:
- The availability of simulated beds is greater than that indicated in the maximum emergency plans, which was based solely on the census of beds. It can be derived that mathematical models could be created, due to the repeatability that has been found in simulations with regard to the stratification into categories of patients.
- Patients admitted to Intensive Care and The Sub-Intensive Area may be more difficult to move than low-intensity care patients, so the Foundation’s receptiveness depends primarily on the saturation rate of Intensive Therapies.
- The availability of OR DEAs was not problematic, as there was a low rate of saturation and a high frequency of interventions that could be interrupted.
- Age is a parameter that influences the possibility of remitting/transferring patients.
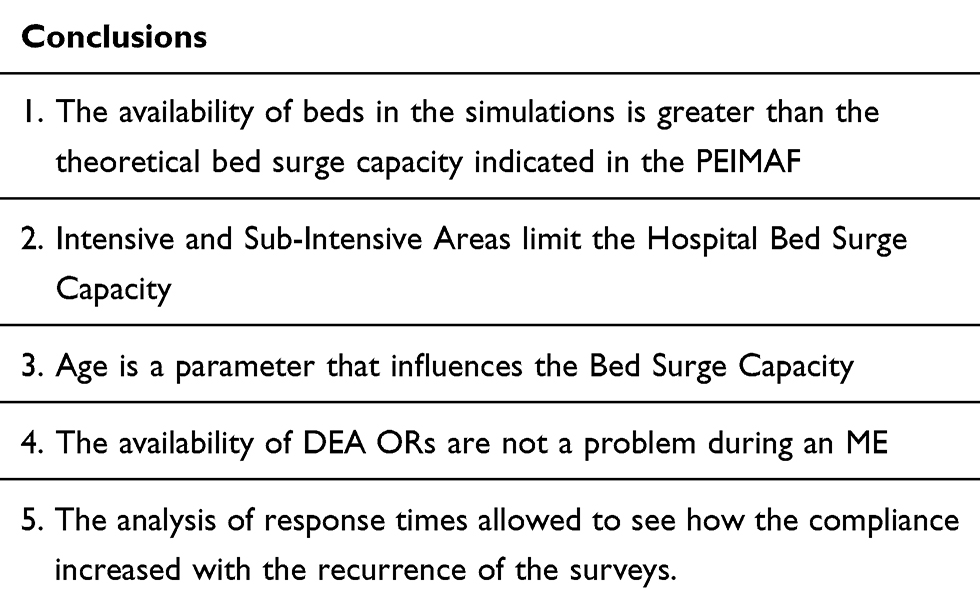 |
Table 12 Conclusions |
Abbreviations
DMP, Presidio Medical Direction; NC, Nursing Coordinator; OR, operating room; CCU, Coronary Care Unit; RICU, Respiratory Intensive Care Unit; PACU, Post Anesthesia Care Unit; ICU, Intensive Care Unit; D.E.A., teaching acute care hospital in Italy; ME, maximum emergency.
Disclosure
The authors report no conflicts of interest for this work.
References
1. Wedel S, Warren J, Harvey M, Biel MH, Dennis R. Guidelines for intensive care unit design. Crit Care Med. 1995;23:582–588. doi:10.1097/00003246-199503000-00026
2. Cocanour C, Allen S, Mazabob J, et al. Lessons learned from the evacuation of an urban teaching hospital. Arch Surg. 2002;137:1141–1145. doi:10.1001/archsurg.137.10.1141
3. Nates J. Combined external and internal hospital disaster: impact and response in a houston trauma center intensive care unit. Crit Care Med. 2004;32(3):686–690. doi:10.1097/01.CCM.0000114995.14120.6D
4. Rice DH
5. Pronovost P, Angus D, Dorman T, Robinson K, Dremsizov T, Young T. Physician staffing patterns and clinical outcomes in critically ill patients. JAMA. 2002;288(17):2151–2162. doi:10.1001/jama.288.17.2151
6. Barbisch D, Koenig K. Understanding surge capacity: essential elements. Acad Emerg Med. 2006;13(11):1098–1102. doi:10.1197/j.aem.2006.06.041
7. Hick J, Barbera JA, Kelen GD. Refining surge capacity: conventional, contingency, and crisis capacity. Disaster Med Public Health Prep. 2009;3(S1):S59–S67. doi:10.1097/DMP.0b013e31819f1ae2
8. Hick J, Chipman J, Loppnow G, et al. Hospital response to a major freeway bridge collapse. Disaster Med Public Health Prep. 2008a;2(S1):S11–S16. doi:10.1097/DMP.0b013e31817196bf
9. Kaji A, Koenig K, Bey T. Surge capacity for healthcare systems: a conceptual framework. Acad Emerg Med. 2006;13(11):1157–1159. doi:10.1197/j.aem.2006.06.032
10. Avery GH, Lawley M, Garret S, et al. Planning for pandemic influenza: lessons from the experiences of thirteen Indiana counties. J Homel Secur Emerg Manag. 2008;5(1):1–24. doi:10.2202/1547-7355.1430
11. Asplin BR, Flottemesch TJ, Gordon BD. Developing models for patient flow and daily surge capacity research. Acad Emerg Med. 2006;13(11):1109–1113. doi:10.1197/j.aem.2006.07.004
12. Bradt DA, Aitken P, FitzGerald G, Swift R, O’Reilly G, Bartley B. Emergency department surge capacity: recommendations of the Australasian Surge Strategy Working Group. Acad Emerg Med. 2009;16(12):1350–1358. doi:10.1111/j.1553-2712.2009.00501.x
13. Kelen GD, McCarthy ML. The science of surge. Acad Emerg Med. 2006;13(11):1089–1094. doi:10.1197/j.aem.2006.07.016
14. G. U. n. Legge n.225: istituzione del Servizio Nazional della Protezione civile. 1992.
15. Gazzetta Ufficiale.TESTO COORDINATO DEL DECRETO-LEGGE. n 343; 2001. Available from: https://www.gazzettaufficiale.it/atto/serie_generale/caricaDettaglioAtto/originario?atto.dataPubblicazioneGazzetta=2001-11-10&atto.codiceRedazionale=01A12270&elenco30giorni=false. Accessed November 5, 2020.
16. Farmer JC, Carlton PK
17. Dayton C, Ibrahim J, Augenbraun M, et al. Integrated plan to augment surge capacity. Prehosp Disaster Med. 2008;23(2):113–119. doi:10.1017/S1049023X00005719
18. Hick J, Christian MD, Sprung CL. Chapter 2. Surge capacity and infrastructure considerations for mass critical care. recommendations and standard operating procedures for intensive care unit and hospital preparations for an influenza epidemic or mass disaster. Intensive Care Med. 2010;36(suppl. S1):S11–S20. doi:10.1007/s00134-010-1761-4
19. Hick J, Hanfling D, Burstein JL, et al. Health care facility and community strategies for patient care surge capacity. Ann Emerg Med. 2004;44(3):253–261. doi:10.1016/j.annemergmed.2004.04.011
20. Hick J, Koenig KL, Barbisch D, Bey TA. Surge capacity concepts for health care facilities: the CO-S-TR model for initial incident assessment. Disaster Med Public Health Prep. 2008b;2(S1):S51–S57. doi:10.1097/DMP.0b013e31817fffe8
21. Welzel TB, Koenig KL, Bey T, Visser E. Effect of hospital staff surge capacity on preparedness for a conventional mass casualty event. West J Emerg Med. 2010;11(2):189–196.
22. Qureshi K, Gershon RR, Sherman MF, et al. Health care workers’ ability and willingness to report to duty during catastrophic disasters. J Urban Health. 2005;82(3):378–388. doi:10.1093/jurban/jti086
23. Schull MJ. Hospital surge capacity: if you can’t always get what you want, can you get what you need? Ann Emerg Med. 2006;48(4):389–390. doi:10.1016/j.annemergmed.2006.06.003
24. Bagust A, Place M, Posnett JW. Dynamics of bed use in accommodating emergency admissions: stochastic simulation model. BMJ. 1999;319(7203):155–158. doi:10.1136/bmj.319.7203.155
25. Barthel ER, Pierce JR, Goodhue CJ, Ford HR, Grikscheit TC, Upperman JS. Availability of a pediatric trauma center in a disaster surge decreases triage time of the pediatric surge population: a population kinetics model. Theor Biol Med Model. 2011;8:38. doi:10.1186/1742-4682-8-38
26. Makino T, Takenaka S, Sakai Y, Yoshikawa H, Kaito T. Factors related to length of hospital stay after two-stage corrective surgery for adult spinal deformity in elderly Japanese. J Orthop Sci. 2020;
27. Tabue-Teguo M
28. Carneiro JA
29. Carneiro JA, Lima CA, Costa FMD, Caldeira AP. Health care are associated with worsening of frailty in community older adults. Rev Saude Publica. 2019;53:32. doi:10.11606/S1518-8787.2019053000829
30. Savioli G, Ceresa IF, Macedonio S, et al. Trauma coagulopathy and its outcomes. Medicina. 2020;56(4):E205. doi:10.3390/medicina56040205
31. Savioli G, Ceresa IF, Manzoni F, Ricevuti G, Bressan MA, Oddone E. Role of a brief intensive observation area with a dedicated team of doctors in the management of acute heart failure patients: a retrospective observational study. Medicina. 2020;56(5):251. doi:10.3390/medicina56050251
32. Tabriz AA, Birken SA, Shea CM, Fried BJ, Viccellio P. What is full capacity protocol, and how is it implemented successfully? Implement Sci. 2019;14(1):73. doi:10.1186/s13012-019-0925-z
33. Cimellaro GP, Malavisi M, Mahin S. Using discrete event simulation models to evaluate resilience of an emergency department. J Earthq Eng. 2017;21(2):203–226. doi:10.1080/13632469.2016.1172373
34. Paganini M, Borrelli F, Cattani J, et al. Assessment of disaster preparedness among emergency departments in Italian hospitals: a cautious warning for disaster risk reduction and management capacity. Scand J Trauma Resusc Emerg Med. 2016;24(1):101. doi:10.1186/s13049-016-0292-6
35. Daniela D, Maria F, Cinzia B, Filomena P. State of emergency plans for massive influx of injured (PEMAF) in Italian hospitals. Pilot study. Ann Ig. 2012;24:229–239.
 © 2020 The Author(s). This work is published and licensed by Dove Medical Press Limited. The
full terms of this license are available at https://www.dovepress.com/terms
and incorporate the Creative Commons Attribution
- Non Commercial (unported, 3.0) License.
By accessing the work you hereby accept the Terms. Non-commercial uses of the work are permitted
without any further permission from Dove Medical Press Limited, provided the work is properly
attributed. For permission for commercial use of this work, please see paragraphs 4.2 and 5 of our Terms.
© 2020 The Author(s). This work is published and licensed by Dove Medical Press Limited. The
full terms of this license are available at https://www.dovepress.com/terms
and incorporate the Creative Commons Attribution
- Non Commercial (unported, 3.0) License.
By accessing the work you hereby accept the Terms. Non-commercial uses of the work are permitted
without any further permission from Dove Medical Press Limited, provided the work is properly
attributed. For permission for commercial use of this work, please see paragraphs 4.2 and 5 of our Terms.