Back to Journals » International Journal of Nanomedicine » Volume 13
Preparation of honokiol nanoparticles by liquid antisolvent precipitation technique, characterization, pharmacokinetics, and evaluation of inhibitory effect on HepG2 cells
Authors Wu W, Wang L, Wang L, Zu Y, Wang S, Liu P, Zhao X ![]()
Received 27 June 2018
Accepted for publication 24 July 2018
Published 17 September 2018 Volume 2018:13 Pages 5469—5483
DOI https://doi.org/10.2147/IJN.S178416
Checked for plagiarism Yes
Review by Single anonymous peer review
Peer reviewer comments 2
Editor who approved publication: Dr Linlin Sun
Weiwei Wu,1 Li Wang,2 Lingling Wang,2 Yuangang Zu,2 Siying Wang,2 Peiyan Liu,2 Xiuhua Zhao2
1Key Laboratory of Saline-Alkali Vegetation Ecology Restoration in Oil Field (SAVER), Northeast Forestry University, Harbin, China; 2Key Laboratory of Forest Plant Ecology, Northeast Forestry University, Ministry of Education, Harbin, Heilongjiang, China
Background: Honokiol is a bioactive lignanoid and has been utilized in traditional Chinese medicine for a long time. It exhibits several pharmacological properties, such as anticancer effects, anti-inflammatory effects, and antianxiety effects. However, the poor aqueous solubility of honokiol has impeded clinical applications.
Materials and methods: In the present study, we adopted the liquid antisolvent precipitation (LAP) technique to prepare nanoparticles of honokiol for enhancement of solubility and bioavailability. Moreover, the honokiol nanoparticles obtained were investigated and evaluated in terms of morphology, physicochemical properties, saturation solubility, dissolution in vitro, bioavailability in vivo, toxicity, and the inhibitory effect on growth of HepG2 cells.
Results: The obtained honokiol nanoparticles existed nearly in spherical shape and could be turned into amorphous structure by the LAP method. Moreover, the solubility of the honokiol nanoparticles was extremely higher than that of free honokiol, and the nanoparticle dissolution rate was also higher than that of free honokiol, which was about 20.41 times and 26.2 times than that of free honokiol in artificial gastric juice and in artificial intestinal juice. The area under the curve [AUC(0–t)] value of honokiol nanoparticles was about 6.52 times greater than that of free honokiol; therefore, the honokiol nanoparticles had a higher bioavailability than free honokiol but were innoxious to the organs of rats. Additionally, the honokiol nanoparticles exhibited a higher inhibition of HepG2 cells due to their lower IC50 compared to free honokiol.
Conclusion: Honokiol nanoparticles have high solubility and bioavailability, and can become a new oral drug formulation and produce a better response for its clinical applications.
Keywords: honokiol, honokiol nanoparticles, solubility, bioavailability
Introduction
Honokiol (Figure 1) is a bioactive lignanoid extracted from Magnolia officinalis (or other species of Magnoliaceae),1 and it possesses many pharmacological properties such as anticancer effects, anti-inflammatory effects, antioxidant actions, and antianxiety effects.2–5 Honokiol has been used for a long time in traditional Chinese medicine to treat many diseases, such as thrombotic stroke, gastrointestinal complaints, anxiety, and nervous disturbance.6,7 Furthermore, honokiol is extensively used in Japan.2,8 However, honokiol is poorly soluble in water, which may limit its wider development and application. Therefore, it is important to improve the solubility and bioavailability of honokiol.
 | Figure 1 Chemical structure of honokiol. |
In the past few decades, reducing the particle size of drugs has been found to be able to increase the solubility and dissolution of drugs.9,10 According to the Noyes–Whitney equation, a decrease in particle size can increase the specific surface area, which is beneficial to increasing the solubility and dissolution rate of the drugs, thereby improving bioavailability.11,12 Therefore, various nanoformulation strategies for improving the solubility and bioavailability of poorly water-soluble drugs have received extensive attention by many researchers in recent years. Moreover, some nanoformulation strategies, such as the use of polymeric nanoparticles,7 nanoparticles in thermosensitive hydrogel,13,14 self-assembled pectin nanoparticles,15 nanosuspensions,16 and nanomicelles,17 have been applied to enhance the solubility and dissolution of honokiol. Additionally, it has been reported that honokiol nanoparticles are prepared by emulsion solvent evaporation method.18 However, some of the preparation processes may have some disadvantages, such as low yield and degradation of heat-sensitive drugs. The liquid antisolvent precipitation (LAP) technique for production of ultrafine particles of poorly water-soluble drugs has been widely researched for the past few decades; it is a bottom–up technique and is believed to be an attractive alternative to most of the bottom–up methods. In the LAP process, precipitation of the solute is achieved by decreasing the solvent power for the solute dissolved in a solution. This is accomplished by addition of a nonsolvent for the solute, described as an antisolvent. The LAP process provides a more convenient procedure at ambient temperatures and atmospheric pressure without the requirement for expensive equipments, and it has great potential to be used in the pharmaceutical industry as compared to other bottom–up methods.19 Furthermore, the preparation of honokiol nanoparticles by the LAP method has not been reported until now. Therefore, the objective of the present study is to develop smaller and uniform-sized honokiol nanoparticles by using the LAP technique and to improve the solubility and dissolution of honokiol.
In the present investigation, the main factors influencing the mean particle size (MPS) of honokiol were optimized for the LAP process by the single-factor experiment. The honokiol nanoparticles obtained under optimal conditions were characterized in terms of various physicochemical properties using scanning electron microscopy (SEM), X-ray powder diffraction (XRD), differential scanning calorimetry (DSC), and thermogravimetry (TG). The saturation solubility, the dissolution in vitro, and the bioavailability in vivo, as well as the inhibitory effect on growth of HepG2 cells, were investigated and evaluated. Furthermore, toxicity and the residual solvent tests were also conducted and results were analyzed.
Materials and methods
Materials
Honokiol (purity =98.5%) was purchased from Baoji Haoxiang Biotechnology Co, Ltd; 2-hydroxypropyl-β-cyclodextrin (HP-β-CD), ethanol (AR grade), acetonitrile (HPLC grade), and methanol (HPLC grade) were purchased from J&K Scientific Ltd (Beijing, China). Hydroxypropyl methylcellulose (HPMC; viscosity: ~3 mPa·s) was obtained from Aladdin. Sprague Dawley rats (females, 180–240 g) were obtained from the Harbin Medical University, Heilongjiang, China. Animals were maintained at 25°C±2°C and 50%–60% relative humidity (RH) under natural light/dark conditions for 1 week before the experiment.
In this paper, all animal experiments were implemented according to the Guidelines for Care and Use of Laboratory Animals of Harbin Medical University and approved by the Ethics Committee of the Harbin Medical University.
Preparation of honokiol nanoparticles
Honokiol nanoparticles were prepared using the LAP method. The schematic diagram of the experimental processes is shown in Figure 2. Briefly, honokiol powder was dissolved in ethanol. This solution was introduced uniformly into an aqueous solution containing HPMC at a certain temperature under stirring with certain speed. After removing the organic solvent using a rotary evaporator R201BL (Senco, Shanghai, China) at 40°C, the resulting honokiol nanosuspension was mixed uniformly with a certain amount of HP-β-CD; finally, the honokiol nanoparticle powder was produced using a lyophilizer at −69°C for 62 hours.
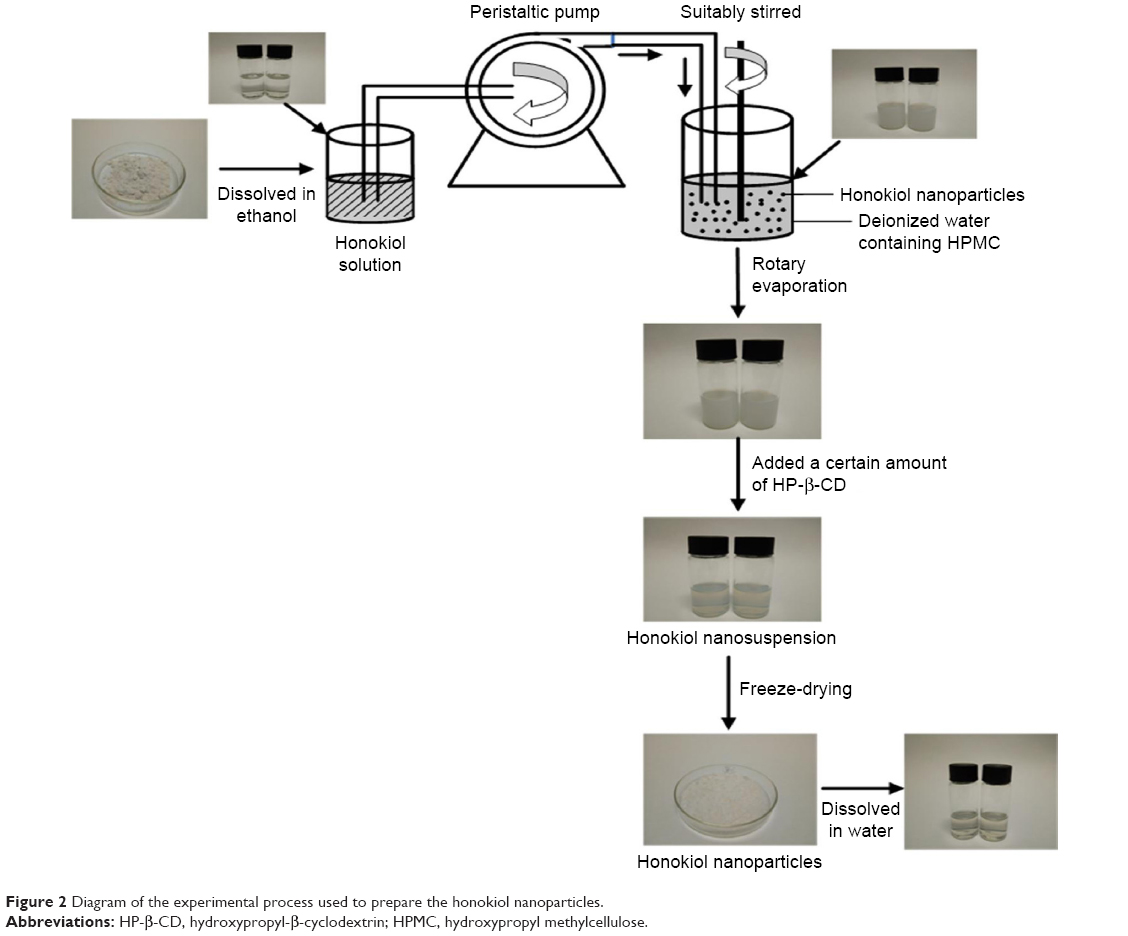 | Figure 2 Diagram of the experimental process used to prepare the honokiol nanoparticles. |
Optimization study on the processing technologies of honokiol nanoparticles
In this paper, the single-factor method was carried out to identify the optimal operating conditions for the LAP process. In this method, only one parameter was changed, while the other parameters remained constant. Several main factors, including the type and the added amount of surfactant, precipitation temperature, stirring speed and time, antisolvent/solvent volume ratio, dropping speed, and drug concentration, were examined regarding the implications for the MPS of drug nanoparticles. The value of each experimental parameter was confirmed by the preliminary experiments; the parameters used and their levels in this experiment are displayed in Table 1. Dynamic light scattering analyzer (ZetaPALS; Brookhaven Instruments Inc, Holtsville, NY, USA) was used to detect the MPS of the honokiol nanosuspension to obtain the best experimental conditions. Every experiment was repeated three more times. In addition, in order to prevent agglomeration of nanoparticles during the freeze-drying process, HP-β-CD was chosen as a cryoprotectant through the preexperimental stages, which not only was sufficiently coated on the surface of nanoparticles to prevent their aggregation but also improved the solubility of honokiol. Moreover, the nanoparticles with different ratios of honokiol–HP-β-CDs (1:0, 1:3, 1:4, 1:5, 1:6, 1:7, and 1:8 mg/mg) were prepared under the same experimental conditions, and then their solubility was analyzed by HPLC to obtain the optimal ratio of honokiol and HP-β-CD. Sample pretreatment process was as follows: each sample (the content of honokiol was in excess) was weighed and stored in plastic tubes containing 2 mL of deionized water, and then the samples were processed using an ultrasound machine. After 30 minutes, the samples were centrifuged at 12,000 revolutions per minute (rpm) for 10 minutes, and then the supernatant was used to determine honokiol concentration by HPLC. Finally, the best ratio of honokiol to HP-β-CD was chosen by comparing their solubility levels. Each sample was analyzed in triplicate.
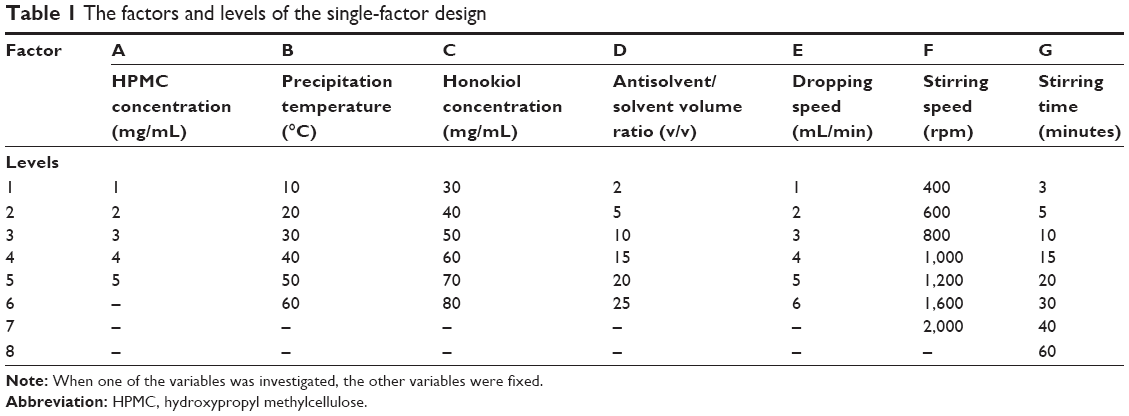 | Table 1 The factors and levels of the single-factor design |
Characterization of honokiol nanoparticles
Morphology and particle size of honokiol nanoparticles
External morphology of the free honokiol, the freeze-dried honokiol nanoparticles, and the processed honokiol nanoparticles was observed by SEM (Quanta 200; FEI, Thermo Fisher Scientific, Waltham, MA, USA). To further observe the morphology of honokiol nanoparticles, the freeze-dried honokiol nanoparticles were washed three to four times using deionized water for removing the HP-β-CD. Afterward, the processed honokiol nanoparticles were redispersed with deionized water, dropped on tin foil, and dried. All samples were fixed on SEM stubs using double-sided adhesive tape and coated with a thin layer of gold, and then the morphology and size of the samples were observed.
In addition, the MPS of the freeze-dried honokiol nanoparticles was also measured by dynamic light scattering technique (ZetaPALS). Before measurement, the freeze-dried honokiol nanoparticles were diluted appropriately using deionizer water. The measurements were done in triplicate.
XRD analysis
Crystal forms of free honokiol, honokiol nanoparticles, HP-β-CD, HPMC, and the physical mixtures of honokiol with excipients were analyzed using XRD (X’Pert Pro; PANalytical, Almelo, the Netherlands). The powder was placed in a glass sample holder. Cu-Kα radiation was generated at 35 mA and 40 kV. Samples were scanned over an angular range of 5°–60°, with a step size of 0.02°.
DSC analysis
Thermal characteristics of free honokiol, honokiol nanoparticles, HP-β-CD, HPMC, and physical mixtures of honokiol with excipients were investigated using DSC (model DSC 204; TA Instruments, New Castle, DE, USA). The samples were placed in aluminum pans, while an empty pan was used as reference. The DSC scans were recorded at a heating rate of 10°C/min from 40°C to 300°C.
TG analysis
TG analyses of free honokiol, honokiol nanoparticles, HP-β-CD, HPMC, and physical mixtures of honokiol with excipients were implemented using a TG analyzer (Diamond TG/DTA; Perkin–Elmer Inc, Waltham, MA, USA). The experiment was conducted using a nitrogen purge under a heating rate of 10°C/min, and the samples were weighed (~5 mg) in open aluminum pans. The percentage weight loss of the samples was monitored from 40°C to 600°C.
Gas chromatography (GC) analysis
Analysis of the residual solvents was carried out on an Agilent 7890A gas chromatograph (Agilent Technologies, Santa Clara, CA, USA) equipped with a HP-5 (5% phenyl methyl siloxane) capillary column (30.0 m×320 μm×0.25 μm, nominal) and a G1540N-210 flame ionization detector. Briefly, the samples were prepared in 25 mL vials filled with 10 mL of water in which 100 mg of drug was dispersed. Then the samples were centrifuged for 10 minutes at 10,000 rpm. The supernatant (2 μL) was injected manually in the split mode with a split ratio of 20:1 and was analyzed by the GC system. The detection conditions for GC analysis of ethanol were as follows: initial oven temperature of 40°C for 6 minutes, increasing to 240°C at a rate of 30°C/min, and maintaining the temperature for 4 minutes; detector temperature of 200°C; injector temperature of 200°C; the airflow rate was set to 400 mL/min; the H2 rate was set to 30 mL/min; and N2 was used as carrier gas at a rate of 2.2 mL/min.
Study of saturation solubility and dissolution
HPLC method for honokiol determination
The honokiol concentration was analyzed using the Waters HPLC system (Waters Corporation, Milford, MA, USA). The final composition of the mobile phase was methanol, acetonitrile, and water (55:20:25, v/v/v) at a flow rate of 1 mL/min. The detection wavelength was 294 nm. A Diamonsil C18 reversed-phase column (250×4.6 mm, 5 μm; Dikma Technologies, Shenyang, China) was used to separate the analytes. The injection volume was 10 μL.
Saturation solubility test
The equilibrium solubility studies of honokiol nanoparticles, free honokiol, and physical mixture of honokiol with excipients in different media (artificial intestinal juice [AIJ] and artificial gastric juice [AGJ] with 0.4% Tween-80) were carried out by adding an excess amount of the samples to 2 mL of media in 5 mL capped vials. These vials were then placed in a temperature-controlled shaking water bath (SHZ-B; Shanghai Boxun, Shanghai, China) at 100 rpm maintained at 37°C for 48 hours. After equilibrium was achieved, these samples were withdrawn and centrifuged at 12,000 rpm for 10 minutes to separate the excess honokiol. The supernatant obtained was suitably diluted with methanol and analyzed by HPLC, as described in the previous section. The measurements were repeated three times.
In vitro release behavior
The in vitro release of honokiol nanoparticles, free honokiol, and physical mixtures of honokiol with excipients was analyzed using dialysis bag diffusion in two release mediums, namely, AIJ (pH 6.8) and AGJ (pH 1.2) with 0.4% Tween-80. Accordingly, free honokiol (300 mg), physical mixture of free honokiol (300 mg) with excipients, and 2.1 g of honokiol nanoparticles containing 300 mg of honokiol were transferred into dialysis bags with the release medium (5 mL), respectively. The dialysis bags were then immersed in 200 mL of release medium at 37°C with constant shaking (100 rpm). Thus, the concentration of honokiol was maintained below its solubility in the release medium throughout the experiment. At 0.08, 0.17, 0.25, 0.33, 0.5, 1, 2, 3, 4, 6, 8, 12, and 24 hours, 1 mL of sample was withdrawn and replaced with equal amount of fresh medium to maintain sink conditions. The drug release was determined by HPLC, and cumulative drug release was calculated. The detection conditions were as described earlier. Each sample was analyzed in triplicate.
In vivo pharmacokinetic study
Twelve Sprague Dawley rats, weighing ~200±20 g, were used for pharmacokinetic analysis. The animals were maintained at 25°C±2°C and 50%–60% RH under natural light/dark conditions for 1 week before the experiment. They were randomly distributed into two groups (six rats per group). Before the study, both groups were fasted overnight for 12 hours, with free access to water. One group was administered free honokiol orally, a dose equivalent to 50 mg/kg body weight of honokiol, while the other group was administered honokiol nanoparticles orally, maintaining the same dose. Following drug administration, blood samples were collected from the retro-orbital plexus at 0.08, 0.17, 0.25, 0.33, 0.5, 1, 2, 3, 4, 6, 8, 12, and 24 hours. These samples were immediately centrifuged, and the plasma samples were stored at −40°C for further studies.
The plasma samples were used for extraction of the drug by the protein precipitation method, and the amount of honokiol present in the samples was quantified by HPLC. An aliquot of plasma (0.2 mL) was mixed with 0.4 mL of acetonitrile, vortexed for another 30 seconds to precipitate the protein, and centrifuged at 12,000 rpm for 10 minutes. Afterward, the supernatant was transferred to a tube that contained 50 mg of sodium chloride. After vortexing for 30 seconds, the suspensions were kept at 25°C for 10 minutes and then centrifuged at 12,000 rpm for 5 minutes. The supernatant (10 μL) was directly injected into the HPLC system for analysis.
Evaluation of inhibitory effect on HepG2 cells
In this paper, the inhibitory effect of honokiol nanoparticles on the growth of HepG2 cells was investigated by the MTT method. The human hepatocellular carcinoma cell line HepG2 was provided by Beina Chuanglian Biotechnology Research Institute (Beijing, China), and these were grown in DMEM supplemented with 10% FBS, 100 IU/mL penicillin, and 100 mg/mL streptomycin. The cells were kept in standard conditions (humidified atmosphere containing 5% CO2, 37°C). The cell suspension was seeded in 96-well plates at an initial density of 1×10⁴ cells per well and allowed to attach. Next, the old medium was removed, and the samples containing free honokiol and honokiol nanoparticles with different honokiol concentrations (honokiol: 1,200.0, 600.0, 300.0, 150.0, 75.0, 37.5, 18.75, and 9.375 μg/mL) were added to the plates. The samples with different honokiol concentrations were dissolved and properly diluted with cell culture medium. Drug-treated cells were incubated for 48 hours, with five replicate wells for each concentration. After 48 hours, 5 mg/mL MTT (10 μL) was added to the culture medium and incubated for 4 hours; subsequently, the medium was removed, and the formazan crystals were solubilized with 150 μL of dimethyl sulfoxide. After mild shaking for 15 minutes, the absorbance value (OD) was detected at detection wavelength of 490 nm (reference wavelength: 630 nm) and compared with the blank control group.
Toxicity experiment
Forty-eight Sprague Dawley rats (weight: 180±20 g) were randomly divided into four groups (12 rats per group), including control group, free honokiol group, 50 mg/kg honokiol nanoparticle-treated group, and 100 mg/kg honokiol nanoparticle-treated groups. The rats in the free honokiol group were orally administered honokiol at a dose of 50 mg/kg per day, the rats in the honokiol nanoparticles group were orally administered honokiol at two dose levels (50 and 100 mg/kg) per day, and the rats in the control group were given physiological saline per day. During the treatment, all rats were free to eat and drink. After 2 weeks, the rats were killed, and the heart, liver, spleen, lung, and kidney were taken out and weighed (accurate to 0.01). The index of the immune organs was calculated according to the following formula:
|
|
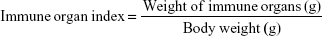
In addition, the liver is the most important organ for the metabolism of drugs in the body, and it is also the most vulnerable organ to damage by drug-induced effects. Therefore, after a period of administration, histological examination of the livers of the rats was carried out to observe the histopathological changes. The whole liver was removed and fixed in 10% formalin, dehydrated with varying grades of alcohol, embedded in paraffin, cut into standard thick sections, and stained with H–E dye for microscopic observation.
Statistical analysis
The significant difference between the honokiol nanoparticle-treated groups and the free honokiol group was analyzed by using the one-sample t-test in the Origin software, and the experimental data are expressed as mean ± SD. Statistical significance was accepted at P<0.05.
Results and discussion
Optimization result
HPMC concentration
Surfactant plays an important role in the precipitation of nanoparticles, which avoids agglomeration between particles, thus helping to control the size of nanoparticles. HPMC was chosen as a surfactant in the preliminary experiments. Figure 3A shows the effects of HPMC concentration in the range of 1–5 mg/mL on the MPS of honokiol. The MPS of honokiol was significantly reduced from 235.9 nm to 103.9 nm with increasing concentration of HPMC. The smallest MPS of 103.9 nm was obtained at 5 mg/mL. This might be because the HPMC could effectively adsorb on to the surface of the drug particles, prevent the growth of the particles, and be beneficial in decreasing the particle size of drugs with increase in its concentration.20,21 Therefore, the optimum HPMC concentration was 5 mg/mL.
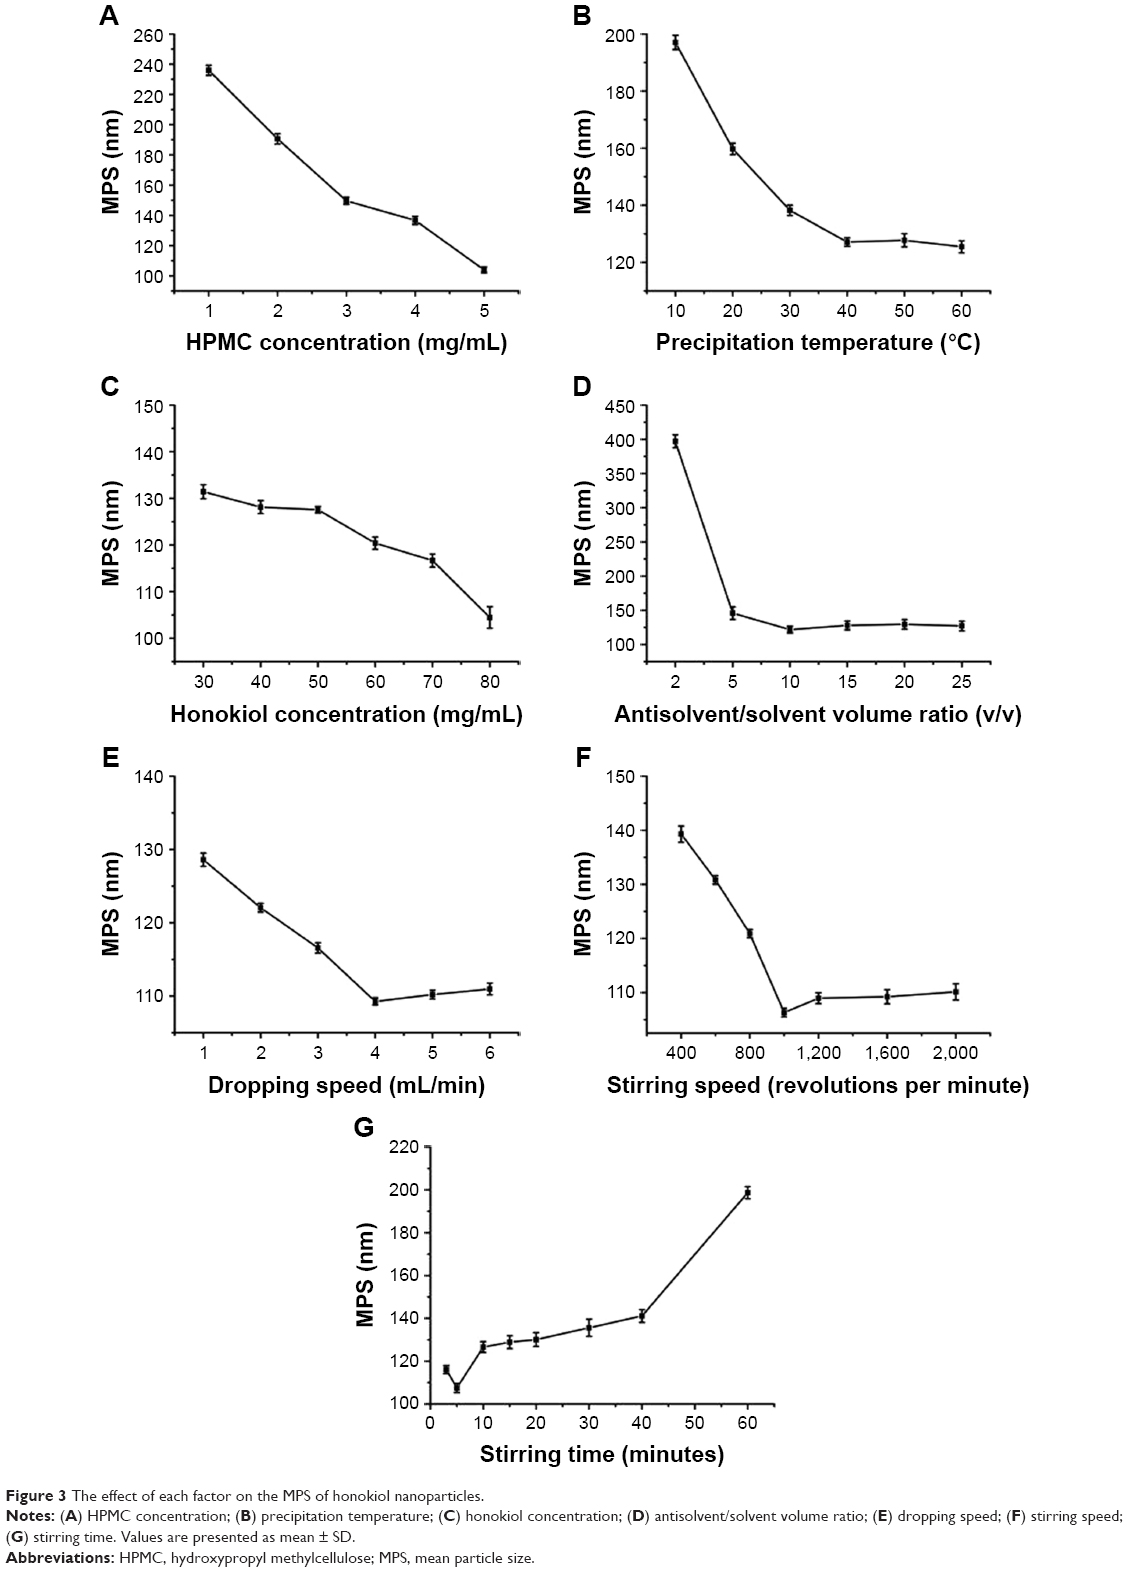 | Figure 3 The effect of each factor on the MPS of honokiol nanoparticles. |
Precipitation temperature
The changes in the MPS with different precipitation temperatures (10, 20, 30, 40, 50, and 60°C) is shown in Figure 3B. The MPS of honokiol decreased from 197.0 nm to 127.1 nm as the precipitation temperature increased from 10°C to 40°C. When the precipitation temperature was >40°C, the MPS of honokiol scarcely changed. This might be because the surfactant in the system had a certain viscosity (HPMC viscosity: ~3 mPa·s), and the viscosity increased with the decrease of the temperature, which affected the particle size of the drug particles. The viscosities at different temperatures were 2.4477, 1.6539, 1.2237, 0.9714, 0.7825, and 0.5935 cP at 10, 20, 30, 40, 50, and 60°C, respectively. When the precipitation temperature was low, the supersaturation of the system increased, which led to the production of many drug particles; moreover, the viscosity of the system was also very large, thereby making the drug particles form a paste in the LAP process. However, the viscosity of the solution decreased with the increase of the temperature, which could effectively limit the agglomeration of particles and was beneficial to the production of small drug particles, but when the precipitation temperature was further increased, the viscosity of the system had little effect on the particle size of the drug particles, so the change of particle size was not obvious. Hence, the optimum precipitation temperature was 40°C.
Honokiol concentration
The effects of different honokiol concentrations (30, 40, 50, 60, 70, and 80 mg/mL) on the MPS of honokiol were examined, and the results are shown in Figure 3C. When the honokiol concentration was increased from 30 mg/mL to 50 mg/mL, the MPS of honokiol scarcely changed. When the honokiol concentration was increased from 50 mg/mL to 80 mg/mL, the MPS of honokiol slightly decreased, but after a period of time, the drug particles began to agglomerate and precipitate. It might be because the increase of drug concentration would increase the supersaturation of the system, resulting in the crystal nucleation rate being larger than the growth rate, which was favorable for the generation of tiny particles. However, when the drug concentration was excessive, the higher supersaturation led to the formation of large amounts of small-sized nuclei at the interface, which created resistance to diffusion and thus enhanced their collision, which resulted in agglomeration.22 Therefore, the optimum honokiol concentration was 50 mg/mL.
Antisolvent/solvent volume ratio
Figure 3D shows the effects of the volume ratio of antisolvent to solvent (2, 5, 10, 15, 20, and 25) on the MPS of honokiol. It can be distinctly seen from the figure that the MPS of honokiol first decreased rapidly and then changed a little with increase of the volume ratio of antisolvent to solvent. The minimum MPS of 121.7 nm was obtained at the volume ratio of 10. Perhaps it was because the supersaturation of the system increased with the increase of the antisolvent ratio, which was conducive to the formation of small particles. However, with further increase of the antisolvent ratio, the degree of supersaturation of the system was almost unchanged, and the diffusion distance of particles would be increased, which could effectively limit the growth and agglomeration of particles,22 leading to the MPS of honokiol changing indistinctively. Therefore, the optimal volume ratio of antisolvent to solvent was selected as 10.
Dropping speed
The effects of different dropping speeds (1, 2, 3, 4, 5, and 6 mL/min) on the MPS of honokiol were examined, as shown in Figure 3E. The MPS of honokiol decreased from 128.6 nm to 109.2 nm as the dropping speed increased from 1 mL/min to 4 mL/min. The minimum MPS of 109.2 nm was obtained at dropping speed of 4 mL/min. This was because the honokiol solution was mixed more rapidly in the deionized water as the flow rate was increased. As the time was short for allowing particle growth, only smaller particles were formed.23 But when the dropping speed was >4 mL/min, the change in the MPS was not obvious; therefore, the optimum dropping speed was selected as 4 mL/min.
Stirring speed and stirring time
The influence of different stirring speeds and stirring times on the MPS of honokiol was examined, as shown in Figure 3F and G. From this figure, it can be seen distinctly that the MPS of honokiol decreased from 139.3 nm to 106.3 nm with increase in the stirring speed from 400 rpm to 1,000 rpm. There was no significant change in the MPS of honokiol when the stirring speed was >1,000 rpm. This illustrates that the proper stirring speed could effectively reduce the particle size of honokiol; but considering the conservation of energy, the optimal stirring speed was confirmed as 1,000 rpm in this paper. Moreover, when the stirring speed was fixed, the MPS of honokiol decreased first and then slightly increased (Figure 3G), with increasing stirring time. The minimum MPS of 107.5 nm was obtained at 5 minutes of stirring time. The results illustrate that when the stirring speed was fixed, longer stirring time might easily create too much energy and destroy the relative balance of the system, resulting in the growth and agglomeration of particles. So, the optimum stirring speed and stirring time were 1,000 rpm and 5 minutes, respectively.
Based on the above analysis, the optimum parameters were as follows: the precipitation temperature was 40°C; the HPMC concentration was 5 mg/mL; the stirring speed was 1,000 rpm; the honokiol concentration was 50 mg/mL; the dropping speed was 4 mL/min; the stirring time was 5 minutes; and the antisolvent/solvent volume ratio was 10. Honokiol nanosuspension with MPS of 107.5 nm was obtained under optimal conditions. Moreover, through HPLC detection, the solubility of the nanoparticles at different ratios of honokiol and HP-β-CD was determined to be 1.476743 mg/mL (1:0), 13.63961 mg/mL (1:3), 18.20911 mg/mL (1:4), 29.86142 mg/mL (1:5), 36.05228 mg/mL (1:6), 36.16034 mg/mL (1:7), and 36.47443 mg/mL (1:8). As seen from these results, the solubility of the corresponding nanoparticles increased with increase in the amount of HP-β-CD. When the mass ratio of HP-β-CD to honokiol was >6, the solubility of the corresponding nanoparticles did not change very much. Considering that honokiol could be used for producing oral drugs, the dosage of pharmaceutical excipients should be as little as possible. Therefore, the optimal ratio of honokiol to HP-β-CDs was considered to be 1/6. Finally, under these optimal conditions, the honokiol nanoparticles were obtained by freeze-drying.
Characterization of honokiol nanoparticles
Morphology and particle size of honokiol nanoparticles
SEM was used to confirm the size and morphology of the free honokiol, the freeze-dried honokiol nanoparticles, and the processed honokiol nanoparticles. The images obtained by SEM are shown in Figure 4A–C. The SEM images revealed that the free honokiol (Figure 4A) existed in a state of irregular blocks, and that its particle size was approximately between 12.9 μm and 30.4 μm. Figure 4B shows that the morphology of the freeze-dried honokiol nanoparticles was irregular lamellar and it was difficult to see the morphology of honokiol nanoparticles from the figure, which might be because the HP-β-CD was wrapped over the honokiol nanoparticle surface. Therefore, to further observe the morphology of honokiol nanoparticles, the freeze-dried honokiol nanoparticles were washed with deionized water 4–5 times to remove the HP-β-CD. Figure 4C reveals the surface of honokiol as observed by SEM for the freeze-dried honokiol nanoparticles. We can see that its morphology was nearly spherical and smooth and homogeneously distributed around 100–120 nm, and that it was significantly smaller and more uniform than free honokiol (Figure 4A). In addition, Figure 4D shows the normal size distribution curve of the freeze-dried honokiol nanoparticles. The MPS of the freeze-dried honokiol nanoparticles was about 108.9 nm, which was almost consistent with the MPS of the honokiol nanosuspension (107.5 nm) obtained under optimal conditions. The experimental results indicated that the honokiol nanoparticles retained good morphology and small particle size owing to the presence of HP-β-CD in the freeze-drying process.
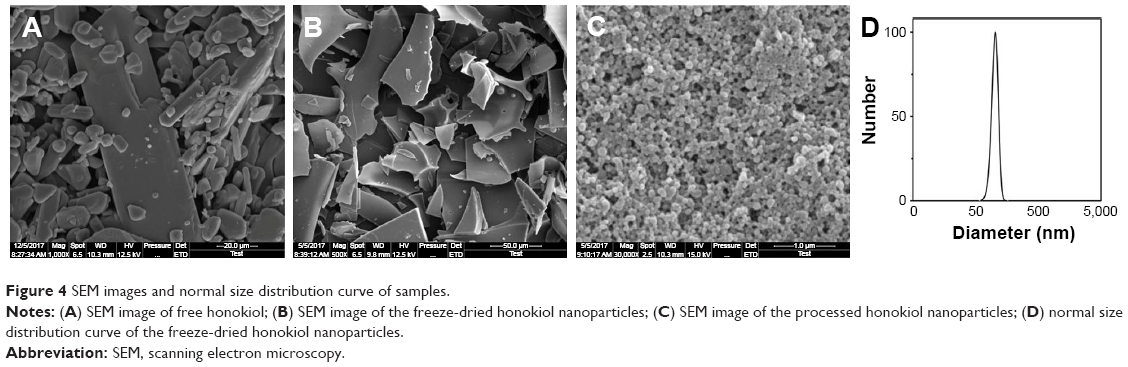 | Figure 4 SEM images and normal size distribution curve of samples. |
Characterization of physicochemical properties
The results of XRD and DSC of the samples, including free honokiol, honokiol nanoparticles, HP-β-CD, HPMC, and physical mixtures of honokiol with excipients, are displayed in Figure 5. As shown in Figure 5A-a, free honokiol showed a high degree of crystallinity and exhibited characteristic peaks between 5° and 40°, and its DSC curve (Figure 5B-a) showed one peak of melting point at 87.3°C, which indicated that the drug existed in nature in the form of crystals. Furthermore, the XRD patterns of HPMC (Figure 5A-b) and HP-β-CD (Figure 5A-c) showed small crystallization peaks, and from the DSC curves of HPMC and HP-β-CD shown in Figure 5B-b and c, the peak of melting point of HPMC was about 70.5°C and the peak of melting point of HP-β-CD was about 86.9°C, which indicated that HPMC and the HP-β-CD existed as crystals. The XRD spectrum of the physical mixture (Figure 5A-d) contained the superimposed figures of each of the pure components, with the peaks having a lower intensity, and some characteristic peaks of honokiol remained. Moreover, the DSC curve of the physical mixture (Figure 5B-d) showed one sharp endothermic peak at 87.1°C, corresponding to the melting peak of honokiol, which illustrated that honokiol existed as a crystal in the physical mixture, while the endothermic peak of HP-β-CD and HPMC almost disappeared; this might be because the melting point of honokiol was similar to that of HP-β-CD and the two endothermic peaks might coincide so that the endothermic peak of HP-β-CD was not obvious. Moreover, because the content of HPMC in the physical mixture was very small, its endothermic peak was also inconspicuous. From the Figure 5A-e, the characteristic peaks of the honokiol nanoparticles were less than that of the physical mixture and the free honokiol, indicating that the crystallinity of the honokiol nanoparticles reduced significantly, and the curve of honokiol nanoparticles (Figure 5B-e) mainly showed features of HP-β-CD, while the DSC characteristics of honokiol disappeared, suggesting that honokiol might be present in an amorphous state in honokiol nanoparticles, which was in conformance with XRD analysis results. Therefore, the honokiol nanoparticles might have better solubility and bioavailability.
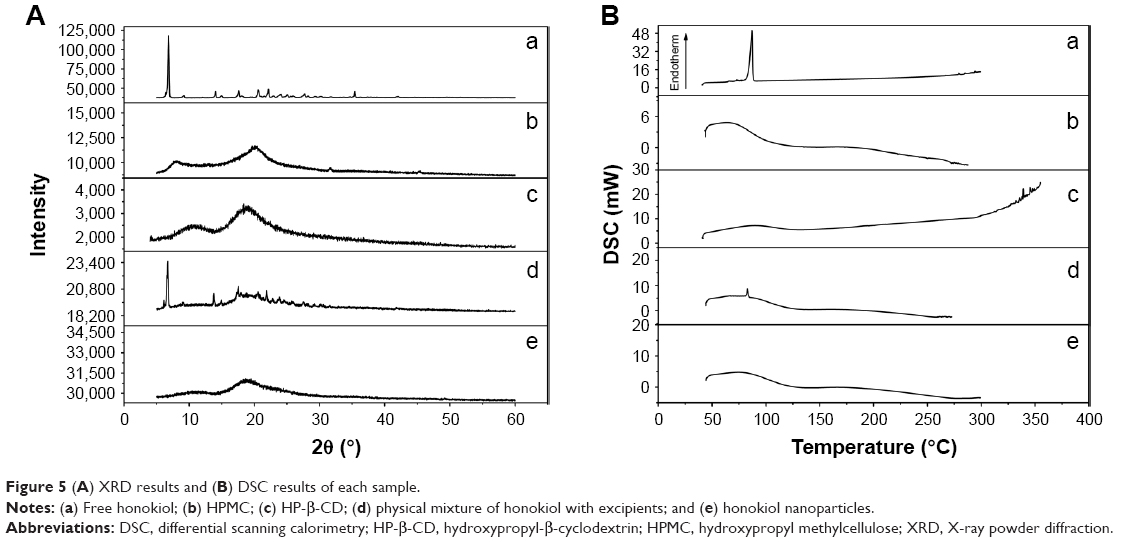 | Figure 5 (A) XRD results and (B) DSC results of each sample. |
The results of the TG analysis of the samples, including free honokiol, honokiol nanoparticles, HP-β-CD, HPMC, and physical mixtures of honokiol with excipients, are illustrated in Figure 6. The free honokiol (Figure 6-a) and the physical mixture (Figure 6-b) showed significant thermal weight losses from 226.7°C and 279.9°C, respectively. Moreover, HPMC (Figure 6-c) started to lose weight from about 307.7°C. HP-β-CD (Figure 6-d) started to lose weight from about 317.2°C. The honokiol nanoparticles (Figure 6-e) started to lose weight from 307.2°C and were more stable than free honokiol, probably because the HP-β-CD wrapped the honokiol nanoparticle surface and protected the honokiol nanoparticles.
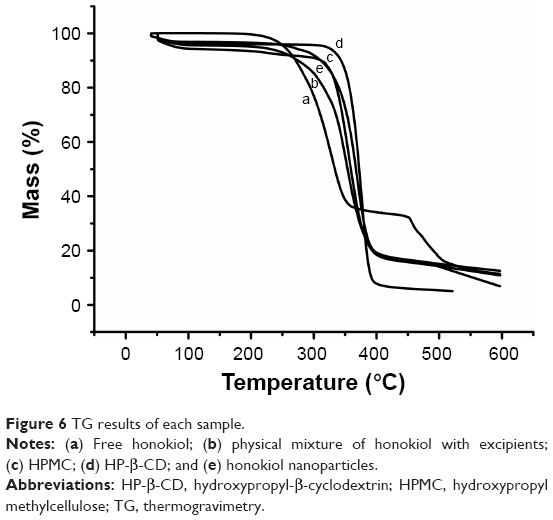 | Figure 6 TG results of each sample. |
Equilibrium solubility and dissolution
The equilibrium solubility of free honokiol, the physical mixture of honokiol with excipients, and the honokiol nanoparticles by HPLC detection was about 0.08, 9.77, and 46.52 mg/mL in AGJ, respectively, and about 0.04, 10.05, and 60.19 mg/mL in AIJ, respectively. From these results, the equilibrium solubility of the physical mixture was determined to be higher in AGJ and AIJ than the equilibrium solubility of free honokiol, which showed that the excipients could increase the solubility of honokiol to some extent. But, the equilibrium solubility of the honokiol nanoparticles with small particle size was significantly higher than that of the others, which illustrated that reducing the particle size down to the nanometer range can increase the saturation solubility of honokiol.
The release behaviors of honokiol nanoparticles were investigated, with the free honokiol and the physical mixture of honokiol with excipients as the control samples. As shown in Figure 7, 3.79% and 3.52% of the free honokiol was dissolved in AGJ and AIJ in 24 hours. The physical mixture attained a cumulative dissolution of about 38.12% in AGJ and 25.57% in AIJ in 24 hours, which was slightly higher than that of free honokiol. During the same period, the honokiol nanoparticles reached a dissolution percentage of 77.37% in AGJ and 92.23% in AIJ, which was noticeably faster than that of both the physical mixture and the free honokiol, being 20.41 times and 26.2 times that of free honokiol in AGJ and AIJ, respectively. These results illustrated that the excipients were useful in improving the solubility of honokiol but were not the main reason. The increased dissolution rate of the honokiol nanoparticles was mainly attributed to the significant reduction of the particle size and the corresponding increase of the specific surface area. Moreover, a previous document reported that honokiol nanosuspensions with MPS of 116.2 nm (±2 nm) were prepared using the precipitation–ultrasonication method.16 In the in vitro dissolution study, the dissolution of honokiol nanosuspensions was about 78% within 24 hours in the release medium (buffer of pH 7.4 containing 0.5% [v/v] SDS), and the highest cumulative release (98%) was after 60 hours. It could be seen from the results that the dissolution rate of the honokiol nanoparticles in this study was similar to or faster than that of the honokiol nanosuspensions obtained by the precipitation–ultrasonication method during the same period. In addition, the dissolution rate of honokiol nanosuspensions obtained by the precipitation–ultrasonication method was slightly faster than that of free honokiol and was about 2.5–3.5 times that of free honokiol in the dissolution medium (free honokiol achieved the maximum dissolution of about 32% at 75 hours). The dissolution rate of the honokiol nanoparticles in this study was significantly faster than that of free honokiol and was 20.41 times and 26.2 times that of free honokiol in AGJ and AIJ, respectively. Therefore, under the same treatment conditions, the honokiol nanoparticles in this study might have a faster dissolution rate compared with the honokiol nanosuspensions obtained by the precipitation–ultrasonication method, and the honokiol nanoparticles were more stable and easy to store than the honokiol nanosuspensions.
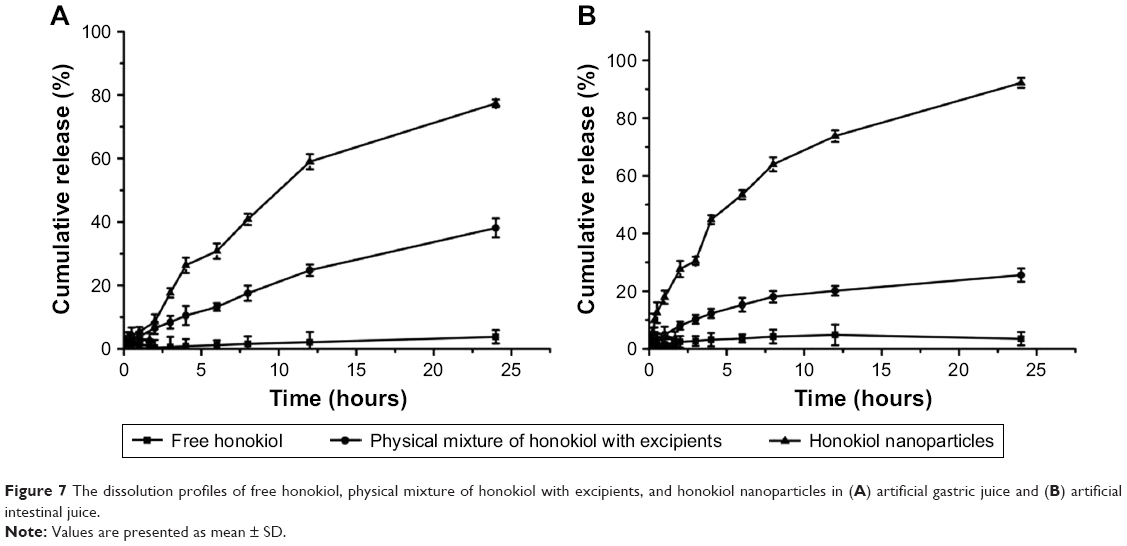 | Figure 7 The dissolution profiles of free honokiol, physical mixture of honokiol with excipients, and honokiol nanoparticles in (A) artificial gastric juice and (B) artificial intestinal juice. |
Pharmacokinetic analysis and bioavailability
Mean plasma concentration–time profiles of honokiol in rats after a single dose (50 mg/kg) of free honokiol and honokiol nanoparticles are represented in Figure 8. As shown in Figure 8, the honokiol concentration in the rat plasma of the honokiol nanoparticle-treated group was consistently higher than that of the free honokiol-treated group at the same dosage, which might be because the amorphous nature and small particle size (nanoscale) of the drugs allow for higher apparent solubility, thus increasing the dissolution rate and increasing the concentration of drug available for absorption.24,25 In addition, the results illustrated that the concentration–time curves of both free honokiol and honokiol nanoparticles could be fitted to the two-compartment model, and the mean pharmacokinetic parameters of honokiol nanoparticles were significantly different from those of free honokiol (Table 2). The maximum serum concentration (Cmax) of honokiol nanoparticles (2,302.69 ng/mL) was obviously higher than that of free honokiol (302.36 ng/mL). The time taken to achieve Cmax, namely, Tmax, in rats treated with honokiol nanoparticles was also significantly shorter than the same for rats treated with free honokiol. Moreover, the area under the curve [AUC(0–t)] of honokiol (10,197.20 ng/mL·h) in the case of honokiol nanoparticles was significantly increased, which was 6.52 times that of free honokiol (1,564.03 ng/mL·h). Thus, it could be concluded that the oral bioavailability of the honokiol nanoparticles with small particle size was improved significantly compared with that of free honokiol. In addition, previous research showed that the Cmax and AUC(0–t) values of the honokiol nanosuspensions obtained by the precipitation–ultrasonication method were ~3.94 and 2.2 folds greater than those of coarse suspensions of bulk honokiol powder dispersed in 0.8% (w/v) carboxymethylcellulose (CMC-Na) solution.16 However, the Cmax and AUC(0–t) values of the honokiol nanoparticles prepared in this study were ~7.62 and 6.52 folds greater than those of free honokiol, which illustrated that the honokiol nanoparticles could be better absorbed than the honokiol nanosuspensions obtained by the precipitation–ultrasonication method. Therefore, the honokiol nanoparticles obtained in this study were remarkably effective in improving the rate and extent of absorption of honokiol; in addition, they exhibited potential for development as a new oral drug formulation for clinical applications.
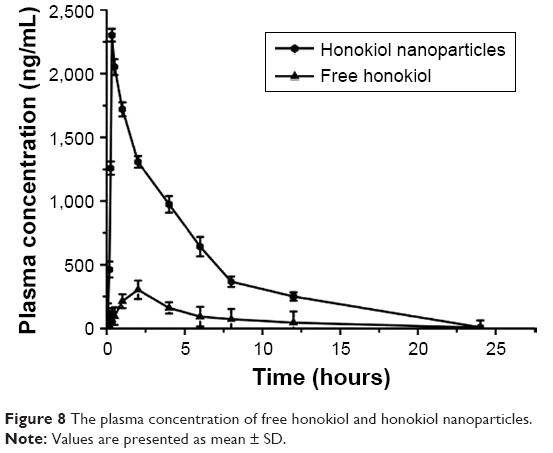 | Figure 8 The plasma concentration of free honokiol and honokiol nanoparticles. |
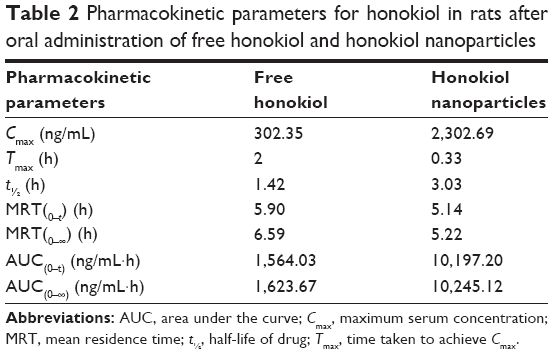 | Table 2 Pharmacokinetic parameters for honokiol in rats after oral administration of free honokiol and honokiol nanoparticles |
Evaluation of inhibitory effect on HepG2 cells
In this paper, the inhibitory effect of honokiol nanoparticles was assessed in HepG2 cells using the MTT assay. The inhibitory rates of the samples (free honokiol and honokiol nanoparticles) on HepG2 cells are shown in Figure 9. As can be seen from the figure, the capability to inhibit the growth of HepG2 cells significantly improved with the increase of drug concentration, but the honokiol nanoparticles could more effectively inhibit the cell proliferation, in contrast with the inhibitory effect of free honokiol, and the difference between the groups was statistically significant (P<0.05). Moreover, the IC50 values of free honokiol and honokiol nanoparticles were 98.14 and 19.37 μg/mL, respectively, which also demonstrated that the honokiol nanoparticles with small particle size had a higher inhibitory effect on the growth of HepG2 cells, compared to free honokiol, due to their lower IC50.
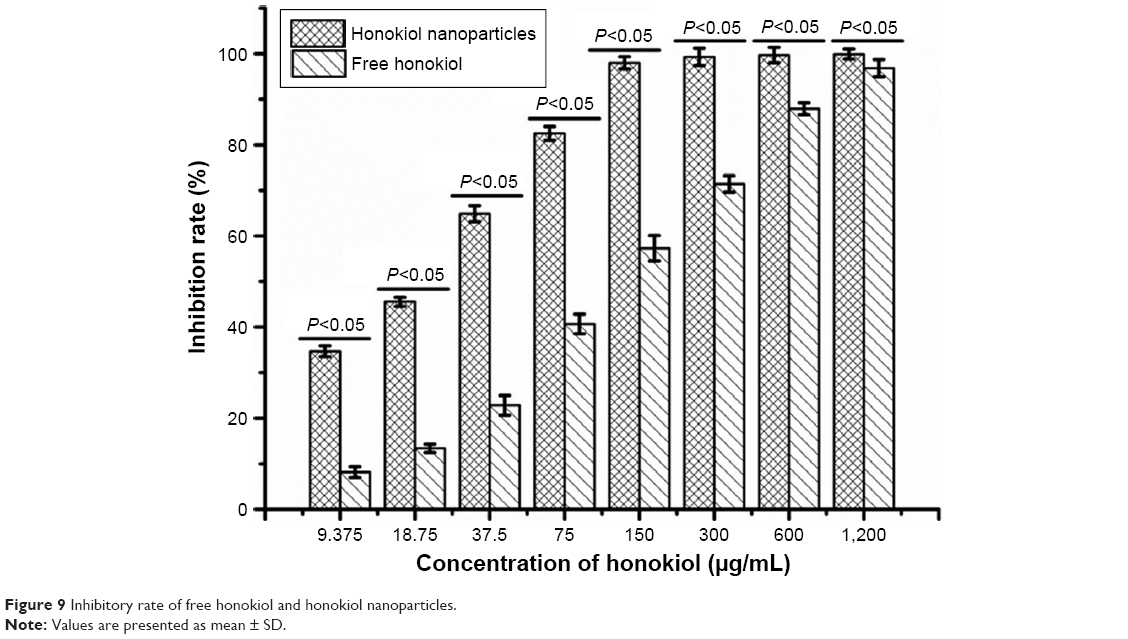 | Figure 9 Inhibitory rate of free honokiol and honokiol nanoparticles. |
Toxicity experiment
The weight gain and the immune organ index of rats in the three groups are shown in Table 3. As can be seen from the table, the body weight of the rats in all groups increased with time. The weight gain of rats was about 28.95±4.89 g in the control group, about 34.13±2.35 g in the free honokiol group, and about 31.12±2.16 and 35.60±2.16 g in the 50 and 100 mg/kg honokiol nanoparticle-treated groups, respectively; moreover, none of the rats had any abnormal behavior during the experimental process. These results showed that the rats in the experimental group did not show any signs of toxicity, such as altered behavior and weight loss during the experiments. In addition, the experimental groups had no significant difference in immune organ index compared with the control group, and the liver showed no pathological changes (Figure 10) in the experimental groups as observed when viewed under a light microscope after H–E staining. Moreover, honokiol is an effective ingredient in magnolia bark extract (MBE), which has been used for thousands of years in traditional Chinese medicine. It had been reported that the no-observed-adverse-effect-level for concentrated MBE (containing about 7.5% of honokiol) was 240 mg/kg body weight per day as an oral dose.26 Considering the content of honokiol in concentrated MBE, the oral dose of honokiol was about 18 mg/kg. However, the dosage of honokiol nanoparticles (100 mg/kg) in the present study was far higher than 18 mg/kg. Therefore, it was concluded that the safety profile of honokiol nanoparticles was good at oral doses as high as 100 mg/kg, and the synthesis method also ensured the safety of honokiol nanoparticle formulation.
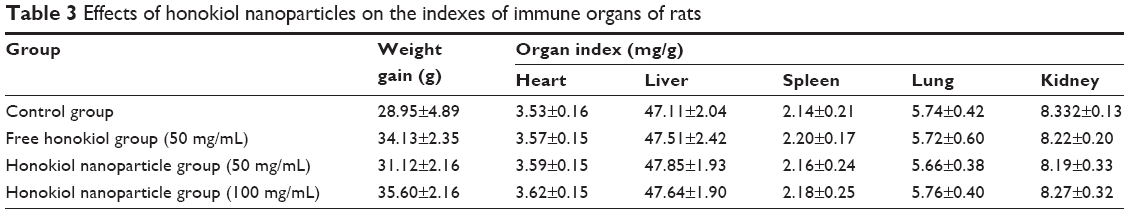 | Table 3 Effects of honokiol nanoparticles on the indexes of immune organs of rats |
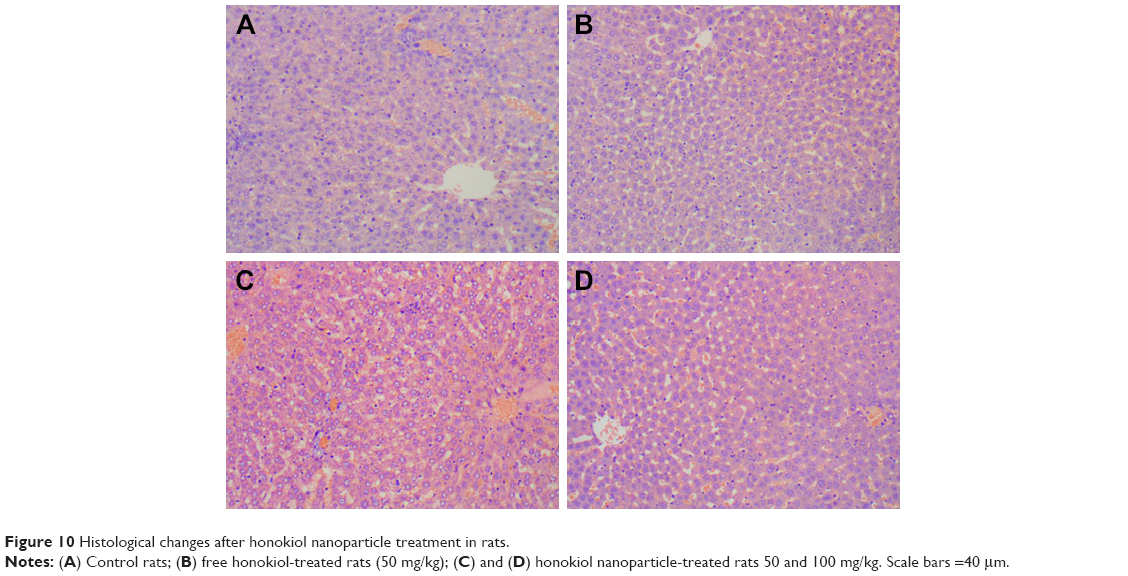 | Figure 10 Histological changes after honokiol nanoparticle treatment in rats. |
Residual solvent determination
Ethanol, a Class III solvent with low toxicity in humans, was used to prepare honokiol nanoparticles through the LAP process. Figure 11 shows the GC analysis results of residual ethanol and a standard curve represented by Y=77,726X+216.3 (R2=0.999) over the range of 0.0782–100 μg/mL, where X is the ethanol concentration and Y is the peak area. Based on the equation, the amount of residual ethanol in honokiol nanoparticles was about 1,557 ppm, which was much lower than the limit prescribed by the International Council for Harmonization of Technical Requirements for Pharmaceuticals for Human Use (ICH) (<5,000 ppm) and was acceptable for pharmaceutical use.
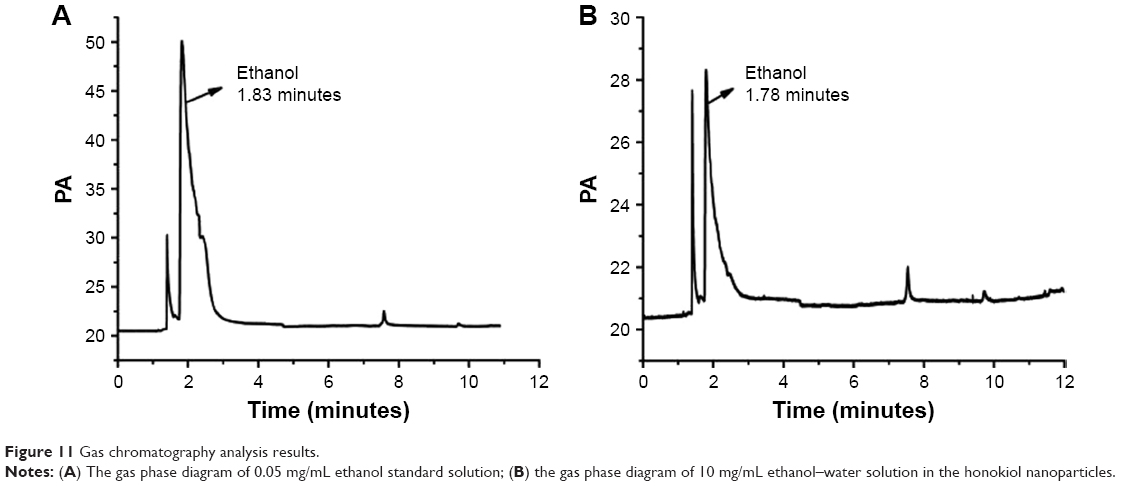 | Figure 11 Gas chromatography analysis results. |
Conclusion
In the present study, honokiol nanoparticles with high water solubility were successfully prepared by the LAP technology. Several main factors that had effects on the particle size of honokiol were evaluated by the single-factor experiments, and the optimum conditions obtained were as follows: precipitation temperature 40°C, HPMC concentration 5 mg/mL, honokiol concentration 50 mg/mL, stirring speed 1,000 rpm, antisolvent/solvent volume ratio 10, stirring time 5 minutes, and dropping speed 4 mL/min. Under these optimal conditions, the honokiol nanosuspension with MPS of 107.5 nm was obtained. Then, the honokiol nanoparticles were obtained by the vacuum freeze-drying method and HP-β-CD was used as cryoprotectant (the mass ratio of honokiol to HP-β-CD was 1:6). The characteristics of the honokiol nanoparticles were analyzed by SEM, XRD, DSC, and TG, the results of which imply that the honokiol nanoparticles existed nearly in spherical shape and could be turned into amorphous structure. The residual ethanol of the honokiol nanoparticles was also less than the ICH limits of 0.5% for Class III solvents and, hence, these could be used for pharmaceutical applications. Meanwhile, the solubility of the honokiol nanoparticles was greatly higher than that of free honokiol: about 46.52 mg/mL (solubility of free honokiol was about 0.08 mg/mL) in AGJ and about 60.19 mg/mL (that of free honokiol was about 0.04 mg/mL) in AIJ. The in vitro release study revealed that the percentage of drug released from the honokiol nanoparticles markedly increased due to the amorphous nature and reduced size of the particles as compared to the same for free honokiol; the release percentage was about 20.41 times and 26.2 times than that of free honokiol in AGJ and in AIJ, respectively. In vivo pharmacokinetics showed that the Cmax and the AUC(0–t) values of honokiol nanoparticles were ~7.62 and 6.52 folds greater than the same for free honokiol; therefore, honokiol nanoparticles had a higher bioavailability than free honokiol and were innoxious to the organs of rats. Moreover, the honokiol nanoparticles exhibited a higher inhibition of HepG2 cells due to their lower IC50 compared to free honokiol. Therefore, the present study has provided a rapid, inexpensive, and better method to enhance the solubility and bioavailability of honokiol.
Acknowledgment
The authors acknowledge the financial support from the National Key Research and Development Program (2017YFD060070601).
Disclosure
The authors report no conflicts of interest in this work.
References
Zhang Y, Chen T, Yuan P, et al. Encapsulation of honokiol into self-assembled pectin nanoparticles for drug delivery to HepG2 cells. Carbohydr Polym. 2015;133:31–38. | ||
Xu C, Tang Y, Hu W, et al. Investigation of inclusion complex of honokiol with sulfobutyl ether-β-cyclodextrin. Carbohydr Polym. 2014;113:9–15. | ||
Han M, Yu X, Guo Y, Wang Y, Kuang H, Wang X. Honokiol nanosuspensions: Preparation, increased oral bioavailability and dramatically enhanced biodistribution in the cardio-cerebro-vascular system. Colloids Surf B Biointerfaces. 2014;116:114–120. | ||
Ding W, Hou X, Cong S, et al. Co-delivery of honokiol, a constituent of Magnolia species, in a self-microemulsifying drug delivery system for improved oral transport of lipophilic sirolimus. Drug Deliv. 2016;23(7):1–11. | ||
Wang XH, Cai LL, Zhang XY, et al. Improved solubility and pharmacokinetics of PEGylated liposomal honokiol and human plasma protein binding ability of honokiol. Int J Pharm. 2011;410(1–2):169–174. | ||
Cheng Z. Comparative studies on the interactions of honokiol and magnolol with human serum albumin. J Pharm Biomed Anal. 2012;66:240–251. | ||
Yang B, Ni X, Chen L, et al. Honokiol-loaded polymeric nanoparticles: an active targeting drug delivery system for the treatment of nasopharyngeal carcinoma. Drug Deliv. 2017;24(1):660–669. | ||
Lee YJ, Lee YM, Lee CK, Jung JK, Han SB, Hong JT. Therapeutic applications of compounds in the Magnolia family. Pharmacol Ther. 2011;130(2):157–176. | ||
Kesisoglou F, Panmai S, Wu Y. Nanosizing – oral formulation development and biopharmaceutical evaluation. Adv Drug Deliv Rev. 2007;59(7):631–644. | ||
Dong Y, Ng WK, Hu J, Shen S, Tan RB. A continuous and highly effective static mixing process for antisolvent precipitation of nanoparticles of poorly water-soluble drugs. Int J Pharm. 2010;386(1–2):256–261. | ||
Zu Y, Li N, Zhao X, et al. In vitro dissolution enhancement of micronized l-nimodipine by antisolvent re-crystallization from its crystal form H. Int J Pharm. 2014;464(1–2):1–9. | ||
Gao L, Zhang D, Chen M. Drug nanocrystals for the formulation of poorly soluble drugs and its application as a potential drug delivery system. Journal of Nanoparticle Research. 2008;10(5):845–862. | ||
Gou M, Li X, Dai M, et al. A novel injectable local hydrophobic drug delivery system: Biodegradable nanoparticles in thermo-sensitive hydrogel. Int J Pharm. 2008;359(1–2):228–233. | ||
Fang F, Gong C, Qian Z, et al. Honokiol nanoparticles in thermosensitive hydrogel: therapeutic effects on malignant pleural effusion. ACS Nano. 2009;3(12):4080–4088. | ||
Zhang Y, Chen T, Yuan P, et al. Encapsulation of honokiol into self-assembled pectin nanoparticles for drug delivery to HepG2 cells. Carbohydr Polym. 2015;133:31–38. | ||
Han M, Yu X, Guo Y, Wang Y, Kuang H, Wang X. Honokiol nanosuspensions: preparation, increased oral bioavailability and dramatically enhanced biodistribution in the cardio-cerebro-vascular system. Colloids Surf B Biointerfaces. 2014;116:114–120. | ||
Godugu C, Doddapaneni R, Singh M. Honokiol nanomicellar formulation produced increased oral bioavailability and anticancer effects in triple negative breast cancer (TNBC). Colloids Surf B Biointerfaces. 2017;153:208–219. | ||
Gou ML, Dai M, Li XY, Xy L, et al. Preparation and characterization of honokiol nanoparticles. J Mater Sci Mater Med. 2008;19(7):2605–2608. | ||
Thorat AA, Dalvi SV. Liquid antisolvent precipitation and stabilization of nanoparticles of poorly water soluble drugs in aqueous suspensions: Recent developments and future perspective. Chem Eng J. 2012;181–182:11–34. | ||
Hecq J, Deleers M, Fanara D, Vranckx H, Amighi K. Preparation and characterization of nanocrystals for solubility and dissolution rate enhancement of nifedipine. Int J Pharm. 2005;299(1–2):167–177. | ||
Terayama H, Inada K, Nakayama H, Yasueda S, Esumi K. Preparation of stable aqueous suspension of a hydrophobic drug with polymers. Colloids Surf B Biointerfaces. 2004;39(4):159–164. | ||
Kakran M, Sahoo NG, Tan I-L, Li L. Preparation of nanoparticles of poorly water-soluble antioxidant curcumin by antisolvent precipitation methods. Journal of Nanoparticle Research. 2012;14(3):1–11. | ||
Zhang Z-B, Xie M-L, Kuang Y-Y, et al. Preparation of amorphous drug nanoparticles by high-gravity reactive precipitation technique. Chem Eng Process. 2016;104:253–261. | ||
Kim MS, Jin SJ, Kim JS, et al. Preparation, characterization and in vivo evaluation of amorphous atorvastatin calcium nanoparticles using supercritical antisolvent (SAS) process. Eur J Pharm Biopharm. 2008;69(2):454–465. | ||
Vaughn JM, Mcconville JT, Crisp MT, Johnston KP, Williams RO. Supersaturation produces high bioavailability of amorphous danazol particles formed by evaporative precipitation into aqueous solution and spray freezing into liquid technologies. Drug Dev Ind Pharm. 2006;32(5):559–567. | ||
Sarrica A, Kirika N, Romeo M, Salmona M, Diomede L. Safety and Toxicology of Magnolol and Honokiol. Planta Med. 2018. |
 © 2018 The Author(s). This work is published and licensed by Dove Medical Press Limited. The
full terms of this license are available at https://www.dovepress.com/terms
and incorporate the Creative Commons Attribution
- Non Commercial (unported, 3.0) License.
By accessing the work you hereby accept the Terms. Non-commercial uses of the work are permitted
without any further permission from Dove Medical Press Limited, provided the work is properly
attributed. For permission for commercial use of this work, please see paragraphs 4.2 and 5 of our Terms.
© 2018 The Author(s). This work is published and licensed by Dove Medical Press Limited. The
full terms of this license are available at https://www.dovepress.com/terms
and incorporate the Creative Commons Attribution
- Non Commercial (unported, 3.0) License.
By accessing the work you hereby accept the Terms. Non-commercial uses of the work are permitted
without any further permission from Dove Medical Press Limited, provided the work is properly
attributed. For permission for commercial use of this work, please see paragraphs 4.2 and 5 of our Terms.