Back to Journals » Patient Preference and Adherence » Volume 15
Preliminary Study on Reference Interval of Serum Pepsinogen in Healthy Subjects
Authors Zhang L, Niu Y, Lv YJ, Wu LF, Hu QL, Huang R, Xu RJ
Received 22 July 2021
Accepted for publication 2 November 2021
Published 9 December 2021 Volume 2021:15 Pages 2725—2730
DOI https://doi.org/10.2147/PPA.S330656
Checked for plagiarism Yes
Review by Single anonymous peer review
Peer reviewer comments 3
Editor who approved publication: Dr Naifeng Liu
Liang Zhang, Ye Niu, Yin-Jiang Lv, Li-Feng Wu, Qi-Lei Hu, Rong Huang, Ru-Jin Xu
Department of Clinical Laboratory, First People’s Hospital of Linping District, Hangzhou, Zhejiang, 311100, People’s Republic of China
Correspondence: Ru-Jin Xu
Department of Clinical Laboratory, First People’s Hospital of Linping District, No. 369 Yingbin Road of Nanyuan Street, Linping District, Hangzhou, Zhejiang, 311100, People’s Republic of China
Tel +86 571 89369407
Email [email protected]
Objective: This study determined the reference interval of pepsinogen (PG) of healthy people in the local region to provide a basis for early screening of gastric cancer.
Methods: Among the healthy people who underwent a physical examination in our hospital from January 2020 to December 2020, 2568 subjects were selected based on the relevant screening criteria. Their serum PG I and II levels and PG I:PG II ratio were determined by chemiluminescent microparticle immunoassay (CIMA), and the results were statistically analyzed. Finally, according to document CLSI-C28-A3, the PG reference interval of the local region was determined.
Results: The PG I and II levels of the males in all age groups were higher than those of the females in the corresponding age groups, and the differences were statistically significant (P < 0.05). However, the differences in the PG I:PG II ratio between the genders in the different age groups were not statistically significant (P > 0.05). The PG I and II levels increased with age in both men and women, while the PG I:PG II ratio was not correlated with age in either gender.
Conclusion: The PG reference interval of the local region was initially determined as providing a reliable reference basis for clinical treatment.
Keywords: pepsinogen, reference interval, chemiluminescent microparticle immunoassay, CLSI-C28-A3
Introduction
Gastric cancer is one of the most common malignant tumors in China. The five-year survival rate of early gastric cancer is above 90%, but that of advanced gastric cancer is approximately 20%. Therefore, early diagnosis of gastric cancer plays a vital role in its diagnosis and treatment.1,2 About half of all patients with early gastric cancer have no symptoms or signs, making diagnosis more difficult. At present, the diagnosis of gastritis or gastric cancer mainly depends on endoscopy and biopsy. However, these methods are invasive, consume copious human and material resources, and are not easily accepted by patients.3,4 Pepsinogen (PG) is the precursor of pepsin, considered the “serological biopsy” of the gastric mucosal state. The serum PG can directly reflect the functional state and morphology of the gastric mucosa as well as the number of glands and cells and is an important serum marker for the diagnosis of atrophic gastritis and monitoring of early gastric cancer.5–7 Some studies have shown that there are obvious differences in PG among healthy subjects in different countries and regions. It may be due to the different detection methods and reagents, the differences in the HP infection situation of the population in each region, gender, age composition and other factors.8,9 At present, there are various methods for detecting PG, including ELISA, radioimmunoassay, time-resolved fluorescence immunoassay, immunoturbidimetry, etc. However, the levels of PG detected by different laboratory testing methods are quite different. In addition, most previous studies only used normal gastric mucosa as healthy subjects, and the effects of smoking, alcohol abuse, Helicobacter pylori infection, and other infectious factors (such as inflammation, infection and other related diseases) have not been excluded, and most of the literature reports failed to refine the reference interval according to different genders and different age groups.
As the serum PG level may be affected by geographical, ethnic, and lifestyle factors, the optimal reference interval for gastric cancer screening has not yet been determined, so the clinical application value of PG is low. In view of this objective reality, it is imperative to determine the PG reference interval of the local region.
Subjects and Methods
Subjects
A total of 2568 healthy people examined in our hospital from January 2020 to December 2020 were included in this study. Their ages ranged from 17 to 90 years old, with a median age of 48 years. The ages of the 1368 male subjects ranged from 17 to 90 years old, with a median age of 46 years, while the ages of the 1200 female subjects ranged from 18 to 88 years old, with a median age of 49 years. The difference in age between the genders was not statistically significant (P > 0.05). According to the literature,10 these subjects were divided into six groups: the 17–30 years old group, 31–40 years old group, 41–50 years old group, 51–60 years old group, 61–70 years old group and ≥71 years old group. None of the subjects had a history of digestive system diseases and proton pump inhibitors (PPIs) medication. The disease history of the cardiovascular, blood, endocrine, urinary systems, smoking, alcohol abuse, Helicobacter pylori infection and other infectious factors (such as inflammation, infection and other related diseases) was excluded.
Instruments and Reagents
An Abbott ARCHITECT i2000 automatic chemical analyzer and matching reagents, standards, and quality controls were used to detect the PG. This study had stable internal quality control and good external quality assessment as a guarantee of accuracy.
Methods
The subjects lived regularly for three days without performing strenuous exercise. After the subjects rested for 30 minutes, the fasting (>12 h) serum was collected, placed at room temperature for 30 min, and centrifuged at 1200 g for 10 min; 1 mL was reserved and detected by the automatic chemical analyzer.
Statistical Analysis
The statistical analysis was conducted using statistical software SPSS 19.0. Normally distributed measurement data were compared between two groups using the t-test and compared among multiple groups using the analysis of variance. Pairwise comparison was conducted using the SNK-q test. Non-normally distributed measurement data were compared among multiple groups using the Kruskal–Wallis H-test and compared between two groups using the Mann–Whitney U-test. A P-value <0.05 was considered statistically significant. The 95% reference interval was determined according to CLSI-C28-A3.11
Results
Test of Normality of PG I and II Levels and PG I:PG II Ratio and Comparison Between Genders
The subjects’ PG I and II levels and PG I:PG II ratio were tested by the Kolmogorov–Smirnov test. The results revealed that the PG I and II levels were normally distributed and that the PG I:PG II ratio was non-normally distributed. The PG I and II levels of the males in all age groups were higher than those of the females in the corresponding age groups, and the differences were statistically significant (P < 0.05). Meanwhile, the differences in the PG I:PG II ratio between the genders in the different age groups were not statistically significant (P > 0.05, Table 1).
 |
Table 1 Results of PGI, PGII, PGI:PGII Ratio in Each Age Group |
Correlation Between PG I and PG II Levels and PG I:PG II Ratio and Age
According to the statistical analysis of the PG I and II levels and PG I:PG II ratio in the different male age groups, the differences in the PG I and II levels between the 17–30 years old group and 31–40 years old group were not statistically significant (P > 0.05). The differences among the 41–50, 51–60 and 61–70 years old groups were also not statistically significant (P > 0.05). However, the levels of any of the 41–50, 51–60 and 61–70 years old groups were higher than those of the 17–30 and 31–40 years old groups (P < 0.05). The levels of the ≥71 years old group were also higher than those of the other five age groups (P < 0.05). There was no difference in the PG I:PG II ratio among the different age groups of either gender (P > 0.05, Table 1). The results of the PG I and II levels and PG I:PG II ratio in the different female age groups were the same as those in the corresponding male age groups.
Reference Interval
According to the results in Table 1, the age groups without differences were combined, and the male and female subjects were respectively divided into the 17-40 years old group, 41–70 years old group and ≥71 years old group according to their PG I and II levels. Since the differences in the PG I:PG II ratio between the genders and among the age groups were not statistically significant, the subjects were assigned to one group according to the PG I:PG II ratio. According to CLSI-C28-A3, the 95% distribution range of the PG I and II levels was calculated with ±1.96 standard deviation, and the 95% distribution range of the PG I:PG II ratio was calculated with the percentile. The 95th percentile (P95) was regarded as the upper limit of the reference interval, and the P5 was regarded as the lower limit of the reference interval. The results are presented in Table 2.
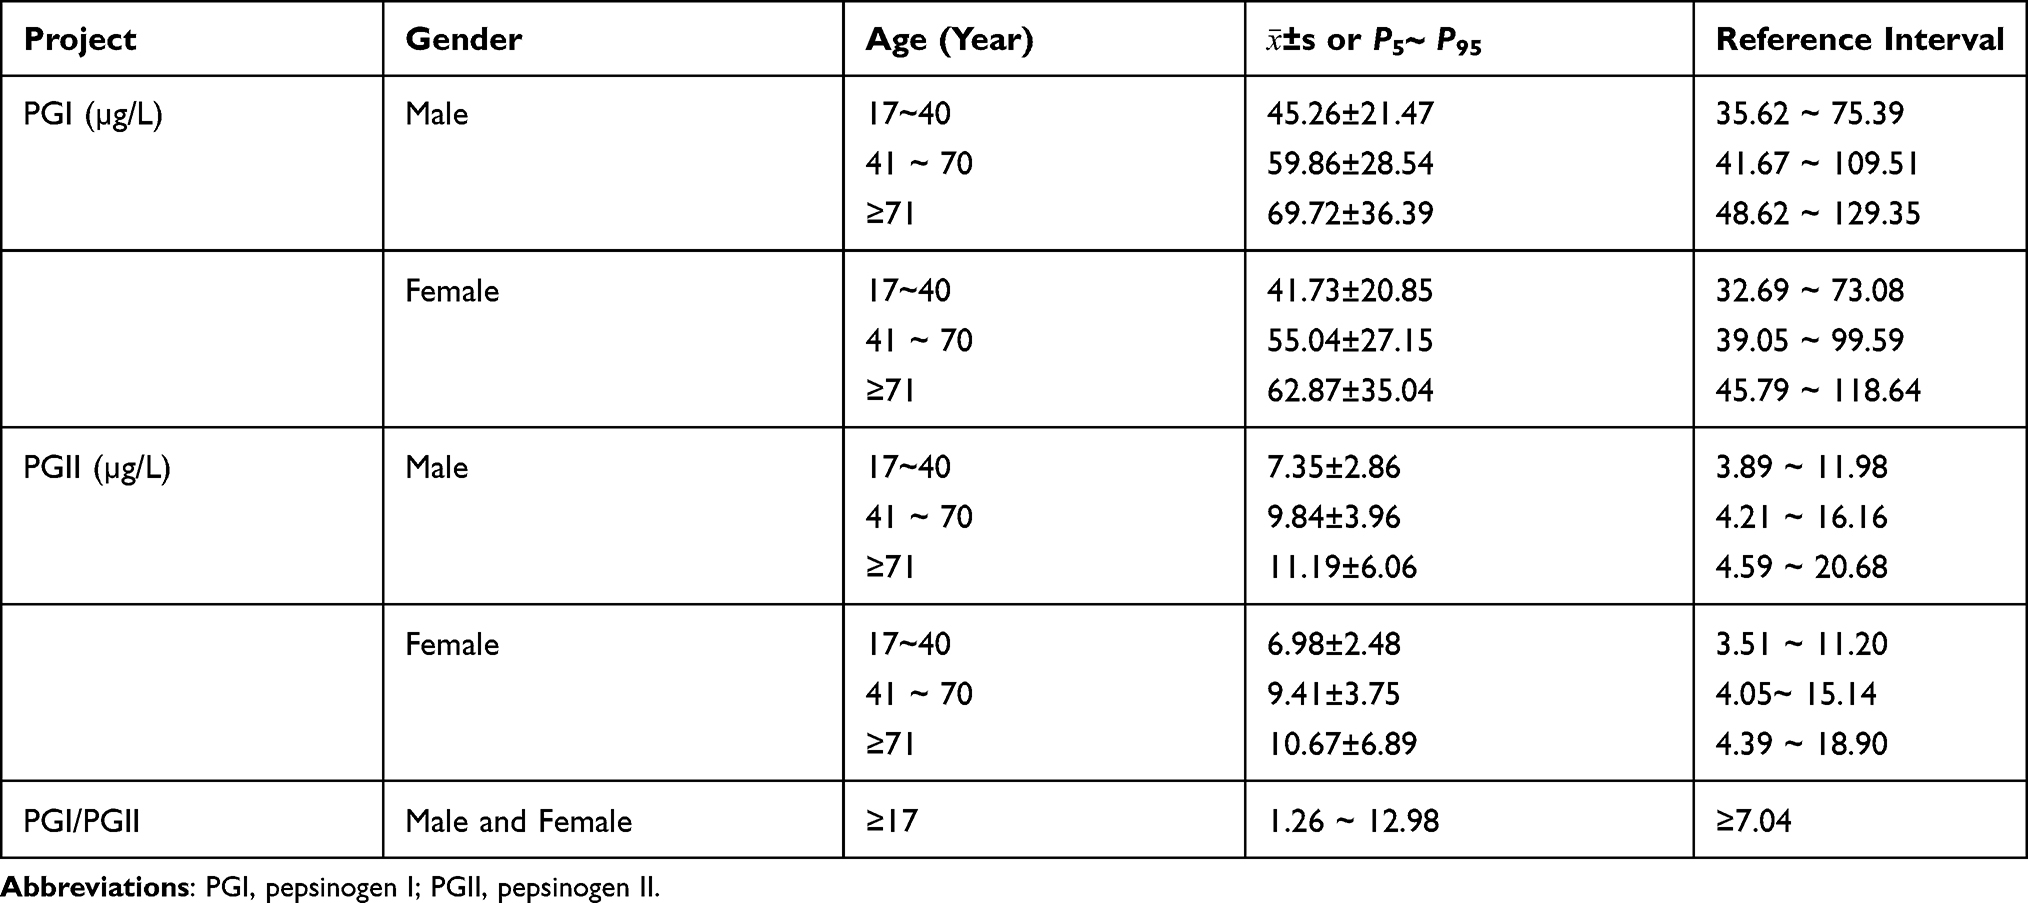 |
Table 2 Reference Interval of PGI, PGII and PGI/PGII Ratio in Healthy Subjects |
Discussion
At present, PG remains a useful serological marker for the diagnosis of atrophic gastritis, with the advantages of high sensitivity, non-invasiveness, and low cost. Many countries have listed it as one of the indicators for monitoring gastric cancer. To accurately evaluate test results, the PG reference interval should be determined scientifically.12,13 However, the detection method used and gender, age, race, and eating habits of the subjects directly affect the PG level, resulting in a certain deviation in the PG evaluation of gastric mucosal function. Currently, there are few authoritative reports on the reference interval of PG detection by chemiluminescent microparticle immunoassay (CMIA) in healthy Chinese people.9 Although CMIA detection of PG has been proven to be reliable, due to the lack of systematic large-sample studies, there is no credible PG reference interval, which limits the clinical application of PG. Therefore, it is necessary to determine the PG reference interval in CMIA detection. Moreover, the grading reference interval should be established according to gender and age to provide evaluation criteria for the diagnosis, treatment, and prevention of atrophic gastritis, gastric ulcer, and gastric cancer as well as accumulate abundant data for large-sample studies in China.
At present, most studies only use normal gastric mucosa as the standard for healthy people, which is inappropriate. The 2568 subjects investigated in this study were chosen based on reasonable exclusion criteria to eliminate the impacts of smoking, alcohol abuse, Helicobacter pylori (HP) infection, proton pump inhibitors (PPIs) medication, and other infectious factors, such as inflammation and other related diseases. This ensured the true reflection of the relationship between PG and several medical indicators in the normal state. This study revealed that as the age increased, the PG level also increased. Moreover, the PG level in men was higher than that in women of the same age, as confirmed in previous studies. However, the PG I:PG II ratio had no correlation with age or gender, differing from the results reported by Yiming Zhong.19 This may have been related to the facts that the subjects in the previous studies were not healthy and different detection methods were used. This study demonstrated that PG I and PG II maintain a certain balance in the normal physiological state that is not affected by age or gender.
The incidence of gastric cancer differs between the genders and among different age groups (eg, the incidence of gastric cancer in people ≤40 years old is significantly different from that in people >40 years old). Therefore, gender and age should be considered when PG is used to detect gastric cancer. Although the decrease of the PG I:PG II ratio can better reflect the state of atrophic gastric mucosa than the PG I level, this level is also increased in some patients with non-atrophic gastritis, HP infection, and gastric ulcer infection.14,15 Thus, the appropriate reference interval of PG I could be used for the differential diagnosis of atrophic gastritis. In this study, the PG I and PG II levels and PG I:PG II ratio of different age groups were statistically analyzed; the age groups without significant differences were combined, and, finally, the reference intervals of the different gender and age groups were established. At present, in most studies, subjects are roughly grouped according to the age standard recommended by the World Health Organization.16 However, in this study, the subjects were grouped based on a statistical analysis of their age and gender differences, so the reference intervals were more detailed. This could improve the level of laboratory diagnosis and quality of medical care and large-scale screening. In addition, the PG reference intervals reported in different countries also differ. For example, in Japan, the reference intervals of PG detection by radioimmunoassay are PG I ≤70 ng/mL and PG I:PG II ≤3.0.17,18 Moreover, in the Republic of Korea, the reference intervals of PG I and II in 521 HP-negative healthy subjects studied by Kim were lower than those in the present study.9 Currently, PG I >70 ng/mL and PG I:PG II >3.0 are the most commonly used reference intervals reported in Japanese studies, but these values were far different in the present study. The reference interval determined here could alleviate patient concerns caused by false abnormal test results (not within the reference interval provided by the manufacturer), effectively improve the level of diagnosis and treatment, and reduce patients’ economic and psychological burden. There were also several differences between the reference intervals determined in this study and those determined by Xin Wang, Yiming Zhong, and Meng Huang, possibly due to the different geographical locations, climatic conditions, and lifestyles of the investigated populations. In addition, the different methodology used may have been another reason. As this is a single-center study, the statistical results may differ from those of other regions. In the next step, we plan to add more centers to enrich clinical data and develop a more scientific and reasonable PG reference interval to make up for the shortcomings of this study.
In summary, this is the first systematic study on the PG level (CMIA) of the healthy population in the local region according to the CLSI-C28-A3 standard. The reference intervals of the different genders and age groups determined in this study are useful and reliable and can be used in clinics and laboratories. It is believed that these reference intervals have significant clinical value.
Ethics Approval and Consent to Participate
This study was conducted with approval from the Ethics Committee of First People’s Hospital of Linping District, Hangzhou. This study was conducted in accordance with the declaration of Helsinki. Written informed consent was obtained from all participants. And the patient guardians under 18 years of age provided informed consent.
Acknowledgments
We would like to acknowledge the hard and dedicated work of all the staff that implemented the intervention and evaluation components of the study.
Funding
There is no funding to report.
Disclosure
The authors declare that they have no competing interests.
References
1. Zuo TT, Zheng RT, Zeng HM, Zhang SW, Chen WQ. Epidemiology of stomach cancer in China. Chin J Clin Oncol. 2017;44(1):52–58.
2. National Clinical Research Center for digestive diseases, Digestive endoscopy branch of Chinese Medical Association, Health Management Branch of Chinese Medical Association, Digestive endoscopy Committee of endoscopists branch of Chinese Medical Association, Digestive endoscopy health management and physical examination committee of endoscopists branch of Chinese Medical Association, National Center for quality control of digestive endoscopy, Cancer endoscopy Committee of China Anti Cancer Association. Expert consensus on early gastric cancer screening process in China (Draft) (Shanghai, 2017). Chin J Gastroenterol. 2018;23(2):92–97. [in Chinese].
3. Wu R, Yang C, Ji L, et al. Prevalence of gastric cancer precursors in gastroscopy-screened adults by family history of gastric cancer and of cancers other than gastric. BMC Cancer. 2020;20(1):1110. doi:10.1186/s12885-020-07612-8
4. Leung WK, Ho HJ, Lin JT, et al. Prior gastroscopy and mortality in patients with gastric cancer: a matched retrospective cohort study. Gastrointest Endosc. 2018;87(1):119–127.e3. doi:10.1016/j.gie.2017.06.013
5. Chen XZ, Huang CZ, Hu WX, et al. Gastric cancer screening by combined determination of serum Helicobacter pylori antibody and pepsinogen concentrations: ABC method for gastric cancer screening. Chin Med J. 2018;131(10):1232–1239. doi:10.4103/0366-6999.231512
6. Miftahussurur M, Waskito LA, Aftab H, et al. Serum pepsinogens as a gastric cancer and gastritis biomarker in South and Southeast Asian populations. PLoS One. 2020;15(4):e0230064. doi:10.1371/journal.pone.0230064
7. Yu G, Wang GX, Wang HG, et al. The value of detecting pepsinogen and gastrin-17 levels in serum for pre-cancerous lesion screening in gastric cancer. Neoplasma. 2019;66(04):637–640. doi:10.4149/neo_2018_180825N647
8. Tu H, Sun L, Dong X, et al. A serological biopsy using five stomach-specific circulating biomarkers for gastric cancer risk assessment: a multi-phase study. Am J Gastroenterol. 2017;112(5):704–715. doi:10.1038/ajg.2017.55
9. Huang M, Tang AG, Mu S, et al. Serum pepsinogen reference intervals in apparently healthy Chinese population with latex enhanced turbidimetric immunoassay. J Clin Pathol. 2014;67(4):350–354. doi:10.1136/jclinpath-2013-201942
10. Shafaghi A, Mansour-Ghanaei F, Joukar F, et al. Serum gastrin and the pepsinogen I/II ratio as markers for diagnosis of premalignant gastric lesions. Asian Pac J Cancer Prev. 2013;14(6):3931–3936. doi:10.7314/APJCP.2013.14.6.3931
11. CLSI C28-A3. Defining, establishing and verifying reference intervals in the clinical laboratory; proposed guideline-third edition[S]. CLSI; 2008.
12. Kim EH, Kang H, Park CH, et al. The optimal serum pepsinogen cut-off value for predicting histologically confirmed atrophic gastritis. Dig Liver Dis. 2015;47(8):663–668. doi:10.1016/j.dld.2015.05.014
13. Tong Y, Wang H, Zhao Y, et al. Serum pepsinogen levels in different regions of China and its influencing factors: a multicenter cross-sectional study. BMC Gastroenterol. 2021;21(1):264. doi:10.1186/s12876-021-01794-6
14. Lee SP, Lee SY, Kim JH, et al. Link between serum pepsinogen concentrations and upper gastrointestinal endoscopic findings. J Korean Med Sci. 2017;32(5):796–802. doi:10.3346/jkms.2017.32.5.796
15. Yuan L, Zhao JB, Zhou YL, et al. Type I and type II Helicobacter pylori infection status and their impact on gastrin and pepsinogen level in a gastric cancer prevalent area. World J Gastroenterol. 2020;26(25):3673–3685. doi:10.3748/wjg.v26.i25.3673
16. Zhong YM, Liu WE, Li YH, et al. Establishment of serum pepsinogen reference interval for healthy adults in Changsha. Chin J Clin Lab Sci. 2013;31(7):550–551.
17. Watabe H, Mitsushima T, Yamaji Y, et al. Predicting the development of gastric cancer from combining Helicobacter pylori antibodies and serum pepsinogen status: a prospective endoscopic cohort study. Gut. 2005;54(6):764–768. doi:10.1136/gut.2004.055400
18. Miki K, Morita M, Sasajima M, et al. Usefulness of gastric cancer screening using the serum pepsinogen test method. Am J Gastroenterol. 2003;98(4):735–739. doi:10.1111/j.1572-0241.2003.07410.x
19. Zhong YM, Liu WE, Li YH, et al. Preliminary establishment of serum pepsinogen reference interval in healthy adults in Changsha area. Chinese Journal of Clinical Laboratory Science. 2013;31(7):550–551.
 © 2021 The Author(s). This work is published and licensed by Dove Medical Press Limited. The
full terms of this license are available at https://www.dovepress.com/terms
and incorporate the Creative Commons Attribution
- Non Commercial (unported, 3.0) License.
By accessing the work you hereby accept the Terms. Non-commercial uses of the work are permitted
without any further permission from Dove Medical Press Limited, provided the work is properly
attributed. For permission for commercial use of this work, please see paragraphs 4.2 and 5 of our Terms.
© 2021 The Author(s). This work is published and licensed by Dove Medical Press Limited. The
full terms of this license are available at https://www.dovepress.com/terms
and incorporate the Creative Commons Attribution
- Non Commercial (unported, 3.0) License.
By accessing the work you hereby accept the Terms. Non-commercial uses of the work are permitted
without any further permission from Dove Medical Press Limited, provided the work is properly
attributed. For permission for commercial use of this work, please see paragraphs 4.2 and 5 of our Terms.