Back to Journals » Clinical Ophthalmology » Volume 10
Preliminary analysis of the relationship between serum lutein and zeaxanthin levels and macular pigment optical density
Authors Fujimura S, Ueda K, Nomura Y, Yanagi Y
Received 8 August 2016
Accepted for publication 13 September 2016
Published 31 October 2016 Volume 2016:10 Pages 2149—2155
DOI https://doi.org/10.2147/OPTH.S119251
Checked for plagiarism Yes
Review by Single anonymous peer review
Peer reviewer comments 2
Editor who approved publication: Dr Scott Fraser
Shigeto Fujimura,1,2 Kohei Ueda,1 Yoko Nomura,1 Yasuo Yanagi3,4
1Department of Ophthalmology, University of Tokyo School of Medicine, Tokyo, 2Department of Ophthalmology, Kanazawa University School of Medicine, Ishikawa, Japan; 3Singapore Eye Research Institute, 4Medical Retina Department, Singapore National Eye Centre, Singapore
Purpose: To assess the relationship between combined serum lutein and zeaxanthin (L+Z) concentration and macular pigment optical density (MPOD), and to investigate the effect of L+Z+docosahexaenoic acid (DHA) dietary supplementation on the spatial distribution of MPOD.
Methods: Twenty healthy fellow eyes with unilateral wet age-related macular degeneration or chronic central serous chorioretinopathy were included. All participants received a dietary supplement for 6 months that contained 20 mg L, 1 mg Z, and 200 mg DHA. The best-corrected visual acuity and contrast sensitivity (CS) were measured at baseline and at 1, 3, and 6 months. Serum L+Z concentrations were measured at baseline and at 3 months. MPOD was calculated at each time point using fundus autofluorescent images.
Results: Serum L+Z concentration was correlated with MPOD at 1°–2° eccentricity at baseline (r=0.63, P=0.003) and 3 months (r=0.53, P=0.015). Serum L+Z concentration increased by a factor of 2.3±1.0 (P<0.0001). At 6 months, MPOD was significantly higher compared to the baseline level at 0°–0.25° (P=0.034) and 0.25°–0.5° (P=0.032) eccentricity. CS improved after 3 or 6 months of L+Z+DHA supplementation (P<0.05).
Conclusion: Juxtafoveal MPOD was associated with serum L+Z concentration. Foveal MPOD was increased by L+Z+DHA dietary supplementation.
Keywords: fundus autofluorescence, supplement, spatial distribution
Introduction
The human eye contains a macular pigment concentrated at the center of the retina, which is thought to protect the retinal photoreceptors and retinal pigment epithelium (RPE) from photo-oxidative stress and optimize central vision by pre-receptoral filtration of blue light.1 The macular pigment is composed of hydroxyl carotenoids lutein (L), zeaxanthin (Z), and meso-zeaxanthin (MZ).2 L and Z are obtained from dietary intake of certain fruits and vegetables, egg yolks, or supplements,3,4 whereas MZ is converted from L. This conversion takes place in the retina.5 Docosahexaenoic acid (DHA) is a phospholipid found within the membranes of the outer segments of the retinal photoreceptors, and is considered to affect membrane permeability and fluidity, as well as properties of the lipid phase.6 Dietary supplements containing hydroxyl carotenoids showed significantly positive effects on both macular pigment optical density (MPOD) and visual function, and DHA was found to enhance the augmentation of MPOD.7–9 Despite evidence that supplementation with L+Z successfully increases both the L+Z serum concentration and MPOD,10,11 it is still being debated whether there is an association between MPOD and serum L+Z.12–15 Some observational studies using heterochromatic flicker photometry (HFP) have suggested a positive correlation between L+Z serum concentrations and MPOD.13,16,17 HFP is a psychophysical method to estimate MPOD, which involves “subjective matching” of a flicker target with alternating blue and green light stimuli.
Aside from HFP, one potential objective method for estimating MPOD is quantification of the fundus autofluorescence (FAF).18 A previous study showed poor agreement between the MPOD measured with HFP and FAF.19 Using FAF, a previous study had shown no correlation between serum L+Z and central peak MPOD; however, juxtafoveal/perifoveal MPOD was not mentioned in the study.15 To the best of our knowledge, no study has yet investigated the spatial distribution of MPOD in relation to L+Z serum concentration.
Accordingly, the main aim of this study was to: 1) provide preliminary data on the potential relationship between L+Z serum concentration and the MPOD spatial distribution using FAF; 2) determine the effect of L+Z+DHA supplementation on MPOD. In the current analysis, we used the fellow eyes of patients with unilateral wet age-related macular degeneration (AMD) or chronic central serous chorioretinapathy (cCSC) because they are at high risk of developing wet AMD.20
Materials and methods
Subjects
Subjects were selected among elderly patients (>56 years) with unilateral wet AMD or cCSC who were followed up at the retina clinic of the University of Tokyo Hospital. A total of 17 patients with unilateral wet AMD and 3 patients with unilateral cCSC (with no other ocular disease except for early AMD in the fellow eye) were enrolled in the study. Only healthy fellow eye was used in the current study and included for examinations after classification into AMD category 1, 2, or 3 according to the criteria of the Age-Related Eye Disease Study Group.21 Exclusion criteria were as follows: 1) eyes showing other ocular diseases such as high myopia (with a refractive error >−7.0 diopter), glaucoma, diabetic retinopathy, significant cataract that could interfere with the FAF images, and any other ocular diseases that might confound assessment of the ocular outcome measurements; 2) individuals who had undergone intraocular surgery; 3) individuals with serious systemic disease such as heart failure, severe diabetes (hemoglobin A1c >8.0%), renal failure, symptomatic brain infarction, lipid metabolic diseases, and any neoplastic disease; 4) individuals taking supplements containing L and/or Z in the 3 months prior to the study; 5) individuals who were unable to understand the details of the study and those for whom appropriate informed consent could not be obtained. The study was approved by the Institutional Review Board and the medical ethics committee of the University of Tokyo Hospital, and adhered to the tenets of the Declaration of Helsinki. All subjects provided written informed consent prior to enrollment.
All participants received a daily supplement of 20 mg L, 1 mg Z, and 200 mg DHA for 6 months. This supplement is available commercially under the name Sante Lutax 20 plus DHA (Santen Pharmaceutical, Osaka, Japan). The supplement included both DHA and L+Z because previous studies have indicated that supplements containing omega-3 fatty acids such as DHA conferred a benefit of increasing MPOD or preventing wet AMD.7,9 The supplement does not contain MZ. Best-corrected visual acuity (BCVA), contrast sensitivity (CS), and MPOD in the study eye were measured at baseline and at 1, 3, and 6 months after the initiation of daily supplement intake. Serum concentrations of combined L+Z were measured at baseline and at 3 months after initiation. We could not measure serum L and Z levels separately because the high-performance liquid chromatography (HPLC) system could only measure their combined concentration. Supplement intake compliance was confirmed by counting the empty supplement packages at each visit.
Measurement of MPOD
MPOD was estimated by analyzing the FAF images. The macular pigment absorbs light at wavelengths <550 nm, with peak absorption at 460 nm.22 In FAF imaging, the blue excitation light is partially absorbed by the macular pigment, reaching the RPE where it excites lipofuscin, resulting in emitted green light. Thus, eyes with more macular pigment will show a lower intensity of emitted autofluorescence light.
FAF images were recorded using a confocal scanning laser ophthalmoscope (Heidelberg Retinal Angiograph, HRA2; Heidelberg Engineering, Heidelberg, Germany). The optical and technical principles of the HRA2 ophthalmoscope have been described previously.23 This instrument uses blue laser light at 488 nm for excitation and a barrier filter wavelength of 500 nm to record the emitted light precisely. For quantification, a 6,000×6,000 μm2 area of the obtained FAF image centered on the fovea was processed on a 324×324-pixel square grayscale bitmap image, and the gray values were measured for each pixel. Commercially available numerical computing software (MATLAB R2009a, MathWorks, Natick, MA, USA) was used for image analysis.
Details of the principles and methods used to calculate MPOD using the FAF method are described elsewhere.18,24 We used the one-wavelength method, which employs blue excitation light only, rather than the two-wavelength method, which requires both blue and green excitations. We chose this method because green excitation light was not available with the instrument used in this study; a previous report comparing one- and two-wavelength methods showed good agreement between the results and high repeatability.24 In brief, the upper and lower limits of the gray values were defined from all 324×324 pixels of each FAF image. Next, we stretched the pixel values between these limits to standardize the FAF intensities for comparison. The lower limit was determined by the gray value of the darkest pixel of the entire image. These pixels were localized over a retinal blood vessel in all cases. The upper limit was determined by the gray value of the brightest pixel. We then subtracted the lower limit value from all pixels because the autofluorescent intensity of the blood vessels should be zero. The subtracted gray values inside the circle of 0.25° eccentricity, and those of the annular zone within 0.25°–0.5°, 0.5°–1°, 1°–2°, and 7° eccentricity were averaged, and the mean gray value (I) was calculated separately for each zone as I0.25°, I0.5°, I1°, I2°, and I7°, respectively (Figure 1). Here, I7° was used as a reference in MPOD calculations because it was previously shown that the macular pigment spatial profile generally reaches a plateau at eccentricities >4°, and 6° or 7° eccentricity was used as a reference in previous studies.24,25
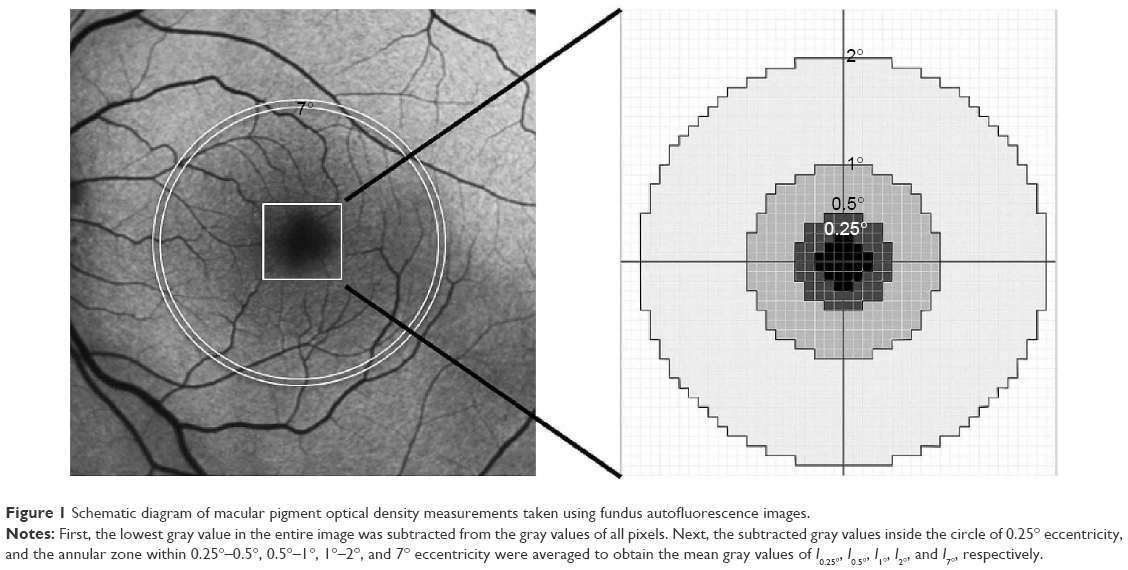 | Figure 1 Schematic diagram of macular pigment optical density measurements taken using fundus autofluorescence images. |
MPOD in each area was defined as follows, according to Trieschmann et al:24
|
|
|
|

where K(488) is the known extinction coefficient of the macular pigment at 488 nm relative to the extinction coefficient at 460 nm22 and is reportedly equal to 0.781.24 Therefore, each MPOD value at each eccentricity was generated based on the ratio calculated within one eye.
Contrast sensitivity
CS was measured with a CSV-1000E Contrast Testing Instrument (Vector Vision, Greenville, OH, USA) at a distance of 2.4 m under standard brightness (85 cd/m2). This test consisted of the following four spatial frequencies: 3, 6, 12, and 18 cycles per degree (cpd). If the eye showed refractive error, refractive correction was performed during the CS test.
Measurement of serum L+Z levels
Peripheral blood samples were collected from each patient at baseline and at 3 months after initiation of supplement intake. The samples were collected in 6-mL serum separator tubes and protected from direct light exposure during processing. Shortly afterward, the serum was separated by centrifugation at 1,500× g for 15 min at room temperature, distributed among cryovials, and shipped on dry ice to a commercial clinical laboratory testing company (SRL, Tokyo, Japan). HPLC was used to quantify the combined serum concentration of L and Z. The principles and details of HPLC have been described elsewhere.11,26
Statistical analyses
The paired t-test was used to compare differences in MPOD at baseline and at each time point after initiation of the study. The Wilcoxon signed-rank test was used to compare differences in non-parametric values such as CS at baseline and at each time point. The Pearson product-moment correlation coefficient was used to quantify the correlation between L+Z serum concentrations and MPOD values at each eccentricity.
Results
Baseline characteristics
The mean age ± SD of the subjects (14 men, 6 women) was 66±4 years, ranging from 57 to 71 years. The study eye was the right eye in 10 cases and the left eye in 10 cases; 12 were fellow eyes of cases with unilateral polypoidal choroidal vasculopathy, 5 were fellow eyes of unilateral typical AMD, and 3 were fellow eyes of cCSC. Ten (50%), 8 (40%), and 2 (10%) of all study eyes were classified as AMD categories 1, 2, and 3, respectively. No geographic atrophy was observed in any of the study eyes. The mean spherical equivalent of all study eyes was −0.21±2.39 diopter, and the mean logMAR of BCVA was −0.06±0.04 (Snellen equivalent: 20/17).
Correlation between serum L+Z and MPOD
There was no significant correlation between the combined L+Z serum concentration and MPOD0.25°, MPOD0.5°, or MPOD1°; however, there was a significant positive correlation between the serum L+Z concentration and MPOD2°, both at baseline and at 3 months after supplement initiation (r=0.63, P=0.003; and r=0.53, P=0.015, respectively) (Figure 2).
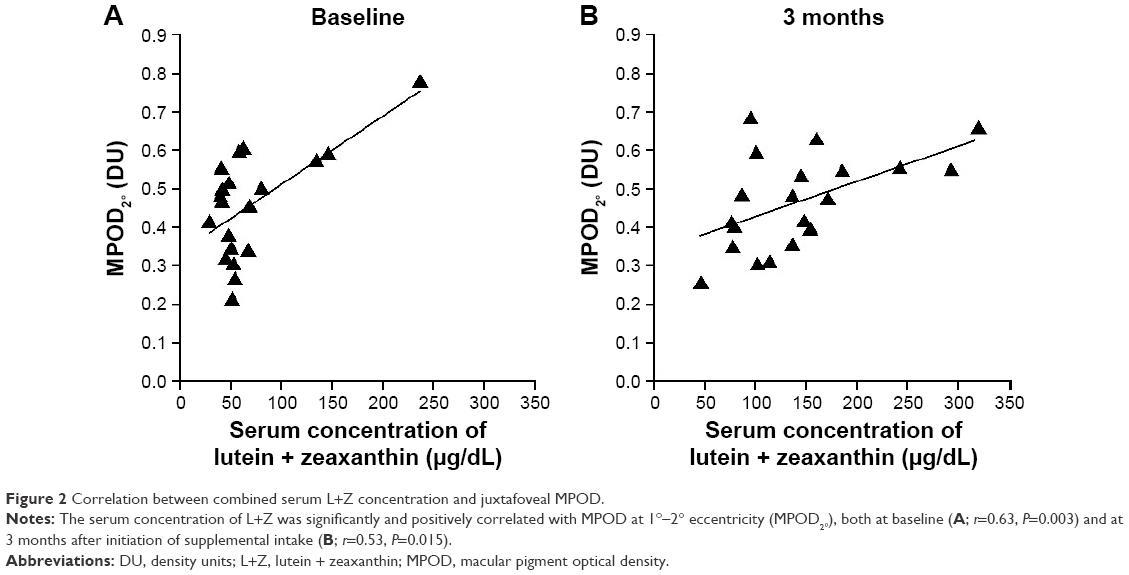 | Figure 2 Correlation between combined serum L+Z concentration and juxtafoveal MPOD. |
Effect of L+Z+DHA supplementation
No subject dropped out during the 6-month study period, and the absolute supplemental intake compliance was 92%. Although the BCVA remained unchanged throughout the study (mean ± standard deviation (SD) of logMAR was −0.06±0.04, −0.08±0.04, and −0.07±0.06 at 1, 3, and 6 months, respectively), CS at 6 cpd was significantly elevated at 3 and 6 months after initiation (P=0.005 and 0.02, respectively), and CS at 18 cpd was significantly elevated at 6 months after initiation (P=0.038) (Figure 3). The mean ± SD of combined serum L+Z concentration at 3 months after initiation (142±72 μg/dL) significantly increased compared with the baseline level (70±49 μg/dL), representing an increase of 2.3±1.0 fold (P<0.0001). MPOD0.25° and MPOD0.5° were significantly increased at 6 months after initiation (P=0.034 and 0.032, respectively). However, there was no change observed at any time point compared with the baseline at >0.5° eccentricity (MPOD1° and MPOD2°) (Figure 4).
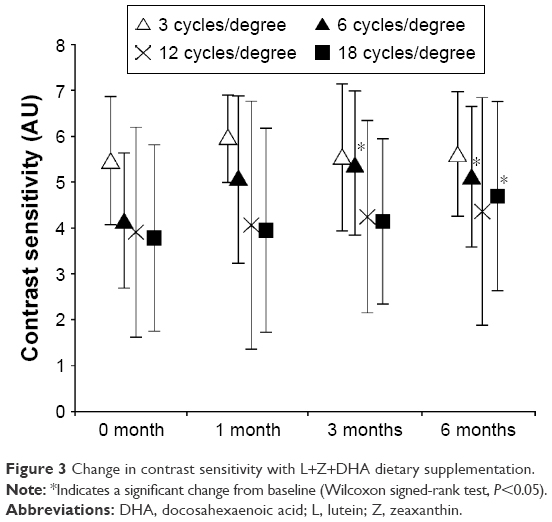 | Figure 3 Change in contrast sensitivity with L+Z+DHA dietary supplementation. |
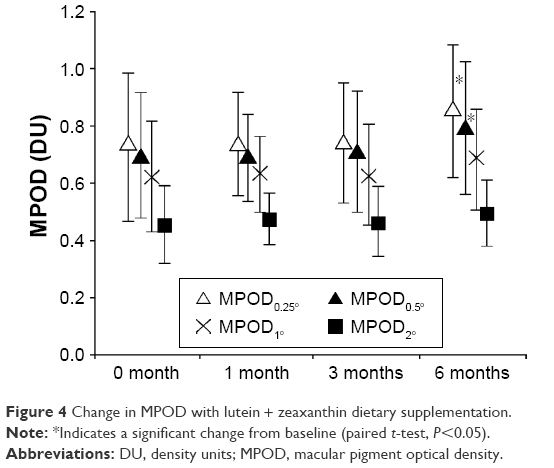 | Figure 4 Change in MPOD with lutein + zeaxanthin dietary supplementation. |
Discussion
In this study, we have provided the first report of a significant positive correlation between serum L+Z and juxtafoveal MPOD (MPOD2°), but not central foveal MPOD (ie, MPOD0.25°, MPOD0.5°, or MPOD1°) in the fellow eyes of unilateral AMD or cCSC patients, confirming previous reports.14,15 Although intraretinal L+Z is transported to the foveal center through systemic circulation, MZ is not present in human serum.2 On the other hand, retinal MZ is produced primarily by isomerization of retinal L, as demonstrated by an experiment using primate retinas.5 Of all the carotenoids that make up the macular pigment, Z and MZ are predominant in the foveal region, with L predominant in the parafoveal region.27,28 Therefore, the results of the current study may indicate that interindividual variation in the serum combined L+Z level is largely correlated with the juxtafoveal L concentration.
In contrast, MPOD in the central fovea (MPOD0.25° and MPOD0.5°), but not the juxtafoveal MPOD (MPOD1° and MPOD2°), was found to increase following oral supplementation of L+Z+DHA. Of note, the supplement we used in the current study did not contain MZ. Thus, the observed change in the macular pigment might indicate that increasing the combined serum L+Z level by supplementation could induce accumulation of foveal MZ, whereas concentration of parafoveal L remains relatively stable. We speculate that parafoveal or juxtafoveal L might change much more slowly in response to the serum L+Z concentration compared to foveal MZ, although longer follow-up study is needed to prove this hypothesis.
Variations in the spatial profiles of MPOD obtained by the FAF method have been investigated in previous studies and were generally classified into two patterns.18,29 The first is characterized by the typical single central peak of MPOD, and the other shows an atypical ring-like pericentral peak. A study demonstrated that 8 weeks after subjects with an atypical spatial profile were provided with macular carotenoid supplementation, only central, and not pericentral, MPOD showed a statistically significant increase after supplementation.30 Although this atypical ring-like pattern was not observed in this study, our results are generally compatible with their results.
The macular pigment is considered to enhance good visual performance, including CS, by reducing chromatic aberrations and the “blue haze” caused by small particles in the atmosphere.31 In the current study, significant increases in CS were observed at spatial frequencies of 6 and 18 cpd after L+Z+DHA supplementation, consistent with previous studies showing positive effects of L+Z or L+Z+MZ supplementation on CS.10,32–34 These findings have potentially important implications with respect to the preservation of visual performance in individuals with AMD because low CS is highly predictive of poor vision.32 Scattered light mainly due to short-wavelength light is a primary cause of glare vision. It is generally considered that a significant amount of short-wavelength light, with a peak absorbance at 460 nm, is screened out by the macular pigment before the incoming light reaches the foveal photoreceptors, and increased macular pigment is associated with reduced scattering. This study also supports this hypothesis by showing improvement in CS with concomitant increase in central foveal MPOD.
The L+Z supplement used in the current study also contained 200 mg DHA, an ingredient deemed important not only for normal metabolism of the photoreceptor outer segments but also for increasing MPOD. A previous study of DHA supplementation showed that DHA intake could increase the high- and low-density lipoprotein subfractions in the serum.35 Given that the transport of carotenoids is carried out by lipids such as high-density lipoprotein,36 DHA supplementation could increase transport to the retina, subsequently increasing MPOD.
Limitation
One of the limitations of our current study is that the effects of L, Z, and DHA on changes in MPOD and CS were not identified separately. To evaluate the effects of each component, additional studies using L and Z supplements alone and a combined L+Z supplement compared with DHA would be desirable. In addition, use of a more specific experimental device to measure the serum concentration of L and Z separately would also be recommended. The relatively small number of participants in the current study is another limitation worth mentioning; however, this was conducted as a pilot study to preliminarily examine the relationship between serum L+Z and MPOD and the effect of dietary L+Z+DHA supplementation on MPOD and CS improvement in the elderly population. It might be difficult to conclude a definite association between the serum L+Z and juxtafoveal MPOD due to the presence of an outlier (with highest concentration of serum L+Z) at baseline; however, a significant correlation between serum L+Z and juxtafoveal MPOD was also shown at the time point of 3 months after the supplement intake. Therefore, we assume that interindividual variability of serum L+Z correlates with juxtafoveal MPOD. Nevertheless, the study protocol was well planned and compliance with supplemental intake was good (>90% overall). Furthermore, no subjects were lost to follow-up during the 6-month study period.
Conclusion
In conclusion, this study showed positive effects of L+Z+DHA supplementation on MPOD and CS, and a positive correlation between serum concentrations of L+Z and juxtafoveal MPOD. Only foveal MPOD changed in response to supplementation.
Acknowledgments
This work was supported in part by Santen Pharmaceutical Co, Ltd. All supplements containing L, Z, and DHA were supplied by Santen. All costs of measuring the serum L+Z concentration were paid by Santen.
Disclosure
The current study was supported by Santen Pharmaceuticals, but they had no role in the design or conduct of this research. The authors report no conflicts of interest in this work.
References
Howells O, Eperjesi F, Bartlett H. Measuring macular pigment optical density in vivo: a review of techniques. Graefes Arch Clin Exp Ophthalmol. 2011;249(3):315–347. | ||
Bone RA, Landrum JT, Hime GW, Cains A, Zamor J. Stereochemistry of the human macular carotenoids. Invest Ophthalmol Vis Sci. 1993;34(6):2033–2040. | ||
Malinow MR, Feeney-Burns L, Peterson LH, Klein ML, Neuringer M. Diet-related macular anomalies in monkeys. Invest Ophthalmol Vis Sci. 1980;19(8):857–863. | ||
Neuringer M, Sandstrom MM, Johnson EJ, Snodderly DM. Nutritional manipulation of primate retinas, I: effects of lutein or zeaxanthin supplements on serum and macular pigment in xanthophyll-free rhesus monkeys. Invest Ophthalmol Vis Sci. 2004;45(9):3234–3243. | ||
Johnson EJ, Neuringer M, Russell RM, Schalch W, Snodderly DM. Nutritional manipulation of primate retinas, III: Effects of lutein or zeaxanthin supplementation on adipose tissue and retina of xanthophyll-free monkeys. Invest Ophthalmol Vis Sci. 2005;46(2):692–702. | ||
SanGiovanni JP, Chew EY, Clemons TE, et al; Age-related eye disease study research group. The relationship of dietary lipid intake and age-related macular degeneration in a case-control study: AREDS Report No. 20. Arch Ophthalmol. 2007;125(5):671–679. | ||
Arnold C, Winter L, Frohlich K, et al. Macular xanthophylls and omega-3 long-chain polyunsaturated fatty acids in age-related macular degeneration: a randomized trial. JAMA Ophthalmol. 2013;131(5):564–572. | ||
Garcia-Layana A, Recalde S, Alaman AS, Robredo PF. Effects of lutein and docosahexaenoic Acid supplementation on macular pigment optical density in a randomized controlled trial. Nutrients. 2013;5(2):543–551. | ||
Dawczynski J, Jentsch S, Schweitzer D, Hammer M, Lang GE, Strobel J. Long term effects of lutein, zeaxanthin and omega-3-LCPUFAs supplementation on optical density of macular pigment in AMD patients: the LUTEGA study. Graefes Arch Clin Exp Ophthalmol. 2013;251(12):2711–2723. | ||
Beatty S, Chakravarthy U, Nolan JM, et al. Secondary outcomes in a clinical trial of carotenoids with coantioxidants versus placebo in early age-related macular degeneration. Ophthalmology. 2013;120(3):600–606. | ||
Murray IJ, Makridaki M, van der Veen RL, Carden D, Parry NR, Berendschot TT. Lutein supplementation over a one-year period in early AMD might have a mild beneficial effect on visual acuity: the CLEAR study. Invest Ophthalmol Vis Sci. 2013;54(3):1781–1788. | ||
Nolan JM, Stack J, O’Connell E, Beatty S. The relationships between macular pigment optical density and its constituent carotenoids in diet and serum. Invest Ophthalmol Vis Sci. 2007;48(2):571–582. | ||
Curran-Celentano J, Hammond BR Jr, Ciulla TA, Cooper DA, Pratt LM, Danis RB. Relation between dietary intake, serum concentrations, and retinal concentrations of lutein and zeaxanthin in adults in a Midwest population. Am J Clin Nutr. 2001;74(6):796–802. | ||
Obana A, Hiramitsu T, Gohto Y, et al. Macular carotenoid levels of normal subjects and age-related maculopathy patients in a Japanese population. Ophthalmology. 2008;115(1):147–157. | ||
Bernstein PS, Ahmed F, Liu A, et al. Macular pigment imaging in AREDS2 participants: an ancillary study of AREDS2 subjects enrolled at the Moran Eye Center. Invest Ophthalmol Vis Sci. 2012;53(10):6178–6186. | ||
Hammond BR Jr, Fletcher LM, Elliott JG. Glare disability, photostress recovery, and chromatic contrast: relation to macular pigment and serum lutein and zeaxanthin. Invest Ophthalmol Vis Sci. 2013;54(1):476–481. | ||
Olmedilla-Alonso B, Beltran-de-Miguel B, Estevez-Santiago R, Cuadrado-Vives C. Markers of lutein and zeaxanthin status in two age groups of men and women: dietary intake, serum concentrations, lipid profile and macular pigment optical density. Nutr J. 2014;13:52. | ||
Trieschmann M, Spital G, Lommatzsch A, et al. Macular pigment: quantitative analysis on autofluorescence images. Graefes Arch Clin Exp Ophthalmol. 2003;241(12):1006–1012. | ||
Akuffo KO, Beatty S, Stack J, et al. Concordance of macular pigment measurement using customized heterochromatic flicker photometry and fundus autofluorescence in age-related macular degeneration. Invest Ophthalmol Vis Sci. 2015;56(13):8207–8214. | ||
Ueta T, Iriyama A, Francis J, et al. Development of typical age-related macular degeneration and polypoidal choroidal vasculopathy in fellow eyes of Japanese patients with exudative age-related macular degeneration. Am J Ophthalmol. 2008;146(1):96–101. | ||
Age-related eye disease study research group. The Age-Related Eye Disease Study (AREDS): design implications. AREDS report no. 1. Control Clin Trials. 1999;20(6):573–600. | ||
Stockman A, Sharpe LT, Merbs S, Nathans J. Spectral sensitivities of human cone visual pigments determined in vivo and in vitro. Methods Enzymol. 2000;316:626–650. | ||
Jorzik JJ, Bindewald A, Dithmar S, Holz FG. Digital simultaneous fluorescein and indocyanine green angiography, autofluorescence, and red-free imaging with a solid-state laser-based confocal scanning laser ophthalmoscope. Retina. 2005;25(4):405–416. | ||
Trieschmann M, Heimes B, Hense HW, Pauleikhoff D. Macular pigment optical density measurement in autofluorescence imaging: comparison of one- and two-wavelength methods. Graefes Arch Clin Exp Ophthalmol. 2006;244(12):1565–1574. | ||
Delori FC. Autofluorescence method to measure macular pigment optical densities fluorometry and autofluorescence imaging. Arch Biochem Biophys. 2004;430(2):156–162. | ||
Craft NE. Carotenoid reversed-phase high-performance liquid chromatography methods: reference compendium. Methods Enzymol. 1992;213:185–205. | ||
Bone RA, Landrum JT, Fernandez L, Tarsis SL. Analysis of the macular pigment by HPLC: retinal distribution and age study. Invest Ophthalmol Vis Sci. 1988;29(6):843–849. | ||
Snodderly DM, Handelman GJ, Adler AJ. Distribution of individual macular pigment carotenoids in central retina of macaque and squirrel monkeys. Invest Ophthalmol Vis Sci. 1991;32(2):268–279. | ||
Robson AG, Moreland JD, Pauleikhoff D, et al. Macular pigment density and distribution: comparison of fundus autofluorescence with minimum motion photometry. Vision Res. 2003;43(16):1765–1775. | ||
Nolan JM, Akkali MC, Loughman J, Howard AN, Beatty S. Macular carotenoid supplementation in subjects with atypical spatial profiles of macular pigment. Exp Eye Res. 2012;101:9–15. | ||
Wooten BR, Hammond BR. Macular pigment: influences on visual acuity and visibility. Prog Retin Eye Res. 2002;21(2):225–240. | ||
Kijlstra A, Tian Y, Kelly ER, Berendschot TT. Lutein: more than just a filter for blue light. Prog Retin Eye Res. 2012;31(4):303–315. | ||
Loughman J, Nolan JM, Howard AN, Connolly E, Meagher K, Beatty S. The impact of macular pigment augmentation on visual performance using different carotenoid formulations. Invest Ophthalmol Vis Sci. 2012;53(12):7871–7880. | ||
Nolan JM, Power R, Stringham J, et al. Enrichment of macular pigment enhances contrast sensitivity in subjects free of retinal disease: central retinal enrichment supplementation trials – report 1. Invest Ophthalmol Vis Sci. 2016;57(7):3429–3439. | ||
Thomas TR, Smith BK, Donahue OM, Altena TS, James-Kracke M, Sun GY. Effects of omega-3 fatty acid supplementation and exercise on low-density lipoprotein and high-density lipoprotein subfractions. Metabolism. 2004;53(6):749–754. | ||
Parker RS. Absorption, metabolism, and transport of carotenoids. FASEB J. 1996;10(5):542–551. |
 © 2016 The Author(s). This work is published and licensed by Dove Medical Press Limited. The
full terms of this license are available at https://www.dovepress.com/terms
and incorporate the Creative Commons Attribution
- Non Commercial (unported, 3.0) License.
By accessing the work you hereby accept the Terms. Non-commercial uses of the work are permitted
without any further permission from Dove Medical Press Limited, provided the work is properly
attributed. For permission for commercial use of this work, please see paragraphs 4.2 and 5 of our Terms.
© 2016 The Author(s). This work is published and licensed by Dove Medical Press Limited. The
full terms of this license are available at https://www.dovepress.com/terms
and incorporate the Creative Commons Attribution
- Non Commercial (unported, 3.0) License.
By accessing the work you hereby accept the Terms. Non-commercial uses of the work are permitted
without any further permission from Dove Medical Press Limited, provided the work is properly
attributed. For permission for commercial use of this work, please see paragraphs 4.2 and 5 of our Terms.