Back to Journals » Risk Management and Healthcare Policy » Volume 13
Predictors Associated with COVID-19 Deaths in Ethiopia
Authors Alemu Y ![]()
Received 9 September 2020
Accepted for publication 10 November 2020
Published 27 November 2020 Volume 2020:13 Pages 2769—2772
DOI https://doi.org/10.2147/RMHP.S279695
Checked for plagiarism Yes
Review by Single anonymous peer review
Peer reviewer comments 3
Editor who approved publication: Professor Marco Carotenuto
Video abstract presented by Yenew Alemu.
Views: 872
Yenew Alemu
Department of Statistics, College of Natural and Computational Science, Injibara University, Injibara, Ethiopia
Correspondence: Yenew Alemu
College of Natural and Computational Science, Injibara University, P.O. Box 40, Injibara, Ethiopia
Tel +251 920255871
Email [email protected]
Abstract: Coronavirus disease is an infectious disease that causes a newly discovered coronavirus. Ethiopia is one of the most impacted countries relative to the proportion of COVID-19 case growth and infection. The purpose of this investigation was to identify the determinants of COVID-19 deaths in Ethiopia. The source of the data for this study was the 2020 Ethiopian Ministry of Health from March up to July using multiple linear regression models. Among 468,814 total tests, 9,027 were recovered, 20,900 were confirmed cases, and 365 were deaths from coronavirus diseases in Ethiopia. Critical cases (β= 0.570, p= 0.006) and average temperature (β= − 35.061, p= 0.003) variables were statistically significant. Critical or serious cases significantly and positively affected the deaths from this pandemic disease, while the average temperature significantly and negatively affected the deaths from COVID-19 disease in Ethiopia.
Keywords: COVID-19, predictors, multiple linear regression, Ethiopia
Introduction
Coronavirus disease (COVID-19) is a global disaster, with speedy dispersion, that has affected death worldwide. It is a breathing infection that can spread from individual to the individual causing virus-like indicators and, in severe cases, death. It was first reported in China and the World Health Organization affirmed the occurrence of a pandemic1 although it has now spread throughout the globe.2
COVID-19 impurity is rumored to spread through breathing large droplets, contact with bodily fluids, and with contaminated surfaces.3 The COVID-19 epidemic is transmitted individual to individual through infected air precipitation, people making contact with fingers or faces that contain the virus and then touching their eyes, nose, or mouth with unclean hands.
Africa recorded 23,209 coronavirus deaths and the confirmed cases have risen to 1,045,234 . Ethiopia is currently one of the most impacted nations relative to the proportion of COVID-19 case development and contagion. A state of emergency lasting five months has been imposed by the Prime Minister. All land borders have since been shut as a virus control measure with several restrictions and implementation of physical distancing and mask-wearing measures. But the pandemic is rising due to a temperature change (summer season) and the public ignoring Ministry of Health rules for controlling the COVID-19 pandemic. Ethiopia recorded 407 coronavirus deaths since the epidemic began, according to Ethiopia’s Ministry of Health (9 August 2020). In addition, Ethiopia reported 22,818 coronavirus cases.
The main restriction to silence the matter is the lack of potential injections to treat or control the disease. This investigation aimed to assess the risk factors of COVID-19 deaths in Ethiopia using multiple linear regression models.
Materials and Methods
Source of the Data
The source of the data for this study was the 2020 Ethiopian Ministry of Health’s monthly reports from March up to July. The data accessed from the Ethiopian Ministry of Health is freely available. The data from the case records were handled with strong responsibility and confidentiality. The study was started after the approval statement was obtained from the Injibara University research committee.
Variables in the Study
The response variable for this study was the number of deaths from COVID-19 per month. The predictor variables were the number of new confirmed cases, recovered, serious or critical cases, total tests, and average temperature.
Methods of Data Analysis
The multiple linear regression model is a regression model with one response or regressed variable and two or more than two explanatory or predictor variables. The general form of multiple linear regression models is as follows:

Where, Y is the response variable, X1, X2, …, Xp are the explanatory variables, p is the number of explanatory variables, and  is the stochastic disturbance term.
Model Assumptions
A test of model adequacy is accomplished by testing the null hypothesis:
H0: β1 = β2 = … … = βp= 0
HA: H0 is not true.
We say that the linear model is adequate in explaining the relationship between the response variable and one or more of the predictor variables if the P-value of ANOVA < the critical value.
Tests on the Regression Coefficients
To test whether each of the coefficients is significant or not, the null and alternative hypotheses are given by:
H0: βj =0
HA: βj ≠ 0 for j=1,2, …., p.

Decision rule:
If | tj | > tα/2 (n-pi1), we reject H0 and conclude that βj is significant, that is, the regressor variable Xj, j = 1, 2, …., p, significantly affects the dependent variable Y.
Results
As shown in Table 1, among 468,814 total tests, 9,027 were recovered, 20,900 were confirmed cases and 365 were deaths from coronavirus disease in Ethiopia.
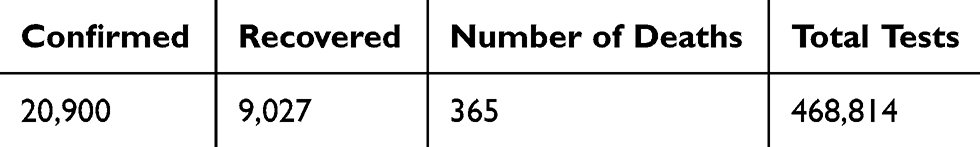 |
Table 1 Descriptive Statistics of COVID-19 in Ethiopia from March to July |
Table 2 shows that the average temperature in March, April, May, June, and July are 25 °C, 25 °C, 25 °C, 23 °C, and 21 °C, respectively. The incidence of analysis is an effect of the average monthly temperature on the monthly number of deaths. All five predictor variables are not significant for the response variable. By using the backward selection method, temperature, total tests, and critical or serious cases were the most important variables.
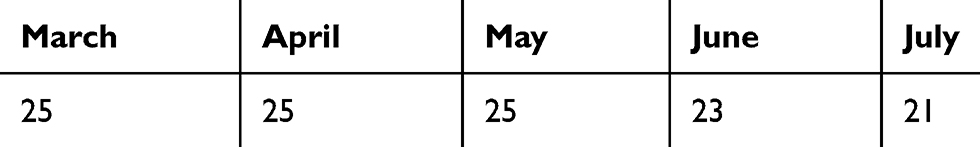 |
Table 2 Average Temperature (in °C) |
Based on Table 3, p-value (0.002) < 0.05 (5% level of significance). Thus, the linear regression model is adequate.
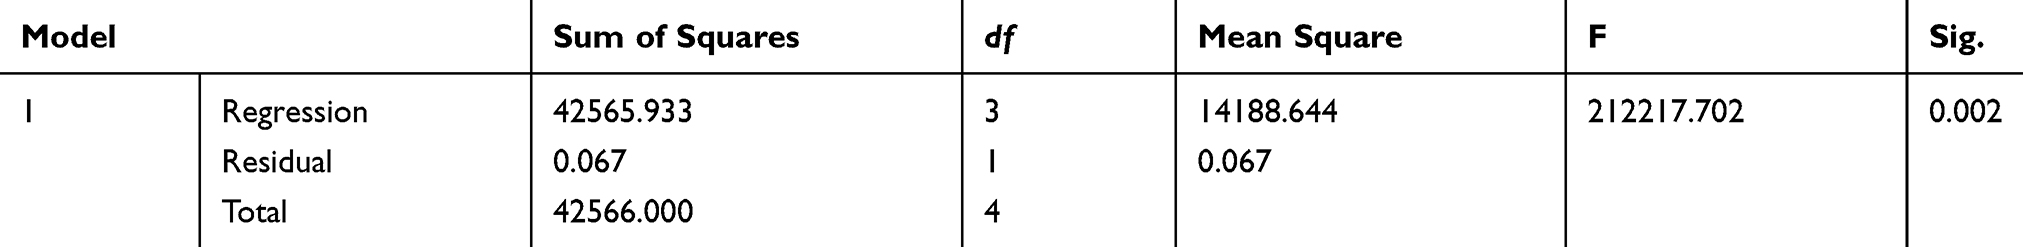 |
Table 3 ANOVA |
Based on Table 4, there is no multicollinearity problem because tolerance is greater than 0.1 and VIF is less than 10. R-squared value is 0.67 which is 67% of the variation in the dependent variable that is explained by the variation of the independent variables.
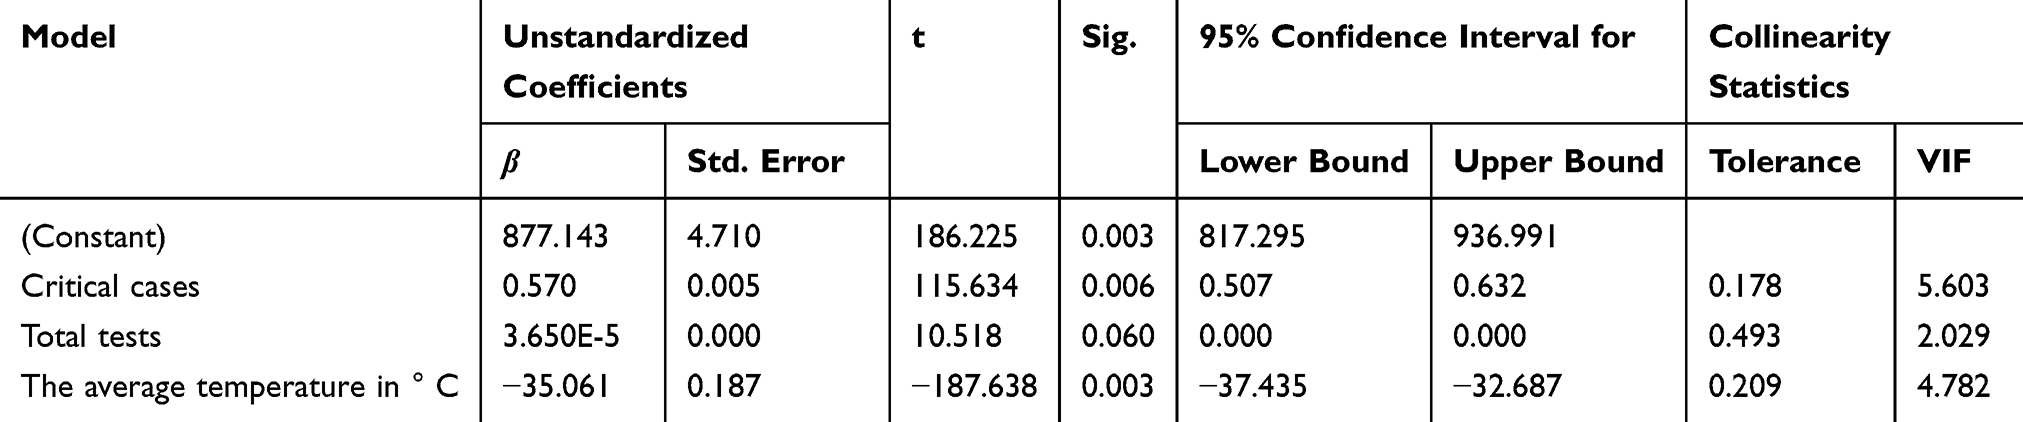 |
Table 4 Coefficients |
The null hypothesis in the Breusch-Pagan test is homoscedasticity is that the data are homoscedastic and the alternative hypothesis is that the data are heteroscedastic. Reject the null hypothesis if the p-value is less than the critical value (α=0.05). P-value = 0.56 > 0.05, we accept the null hypothesis, i.e. the data are homoscedastic.
As shown below in Table 4, critical cases and average temperature per month significantly affected the number of deaths at the 5% level of significance. Critical or serious cases significantly and positively affected the number of deaths per month, while the average temperature significantly and negatively affected the number of deaths from COVID-19. The estimated coefficient of the critical cases is 0.570. Holding average temperature and total tests constant, a one-person increase in critical cases results in a 0.57 unit increase in the number of deaths. The estimated value of deaths decreases by 35.1 units for each increase of 1 degree Celsius of average temperature, holding critical cases and total tests constant.
Discussion
The principal purpose of this research was to identify the risk factors of COVID-19 deaths monthly in Ethiopia based on the 2020 Ministry of Health data. As the results revealed, the average temperature per month was found to be an important predictor for the deaths of COVID-19 in Ethiopia. Based on the data, from dry season to summer season, COVID-19 deaths increased. That means the average temperature in June and July was cold (low) as compared to other months and high death rates occurred in the summer season. This study revealed that the low average temperature was safe (not harmful) to the virus. This result is in line with other studies.4–9
According to the results, the critical case was a significant determinant of COVID-19 deaths. Anyone who has progressed to a serious cases was in old age or living with other infected diseases such as hypertension, HIV/AIDS, sugar diseases, people who have breathing problems, and so on. The findings of this study indicate that as the number of critical cases increases the number of people passing away from the COVID-19 virus also rises. A high level of critical cases elevated the COVID-19 deaths. This result is consistent with others’ findings.10–12
Conclusion
The aim of this investigation was to assess the factors of COVID-19 deaths. The study was based on secondary data obtained from the Ministry of Health (Ethiopia). The current study indicated that critical cases and average temperature were the risk factors that influence COVID-19 deaths in Ethiopia. To minimize deaths from COVID, we should be able to clean hands regularly with soap and water, wear facemasks, follow instructions from public and global health institutions, especially keeping social distance from critical cases, and stay at home mainly in the summer season.
Abbreviations
COVID-19, coronavirus disease 2019.
Acknowledgments
The author acknowledges the Ministry of Health of Ethiopia and the National Meteorology Agency.
Disclosure
The author reports no conflicts of interest for this work.
References
1. Chang MC, Seo WS, Park D, Hur J. Analysis of SARS-CoV-2 Screening Clinic (Including Drive-Through System) Data at a Single University Hospital in South Korea from 27 January 2020 to 31 March 2020 during the COVID-19 Outbreak. In: Healthcare. Vol. 8. No. 2. Multidisciplinary Digital Publishing Institute; Jun 2020:145
2. Cascella M, Rajnik M, Cuomo A, Dulebohn SC, Di Napoli R. Features, evaluation and treatment coronavirus (COVID-19). In: Statpearls [Internet]. StatPearls Publishing; March 8, 2020
3. Li Q, Guan X, Wu P, et al. Early transmission dynamics in Wuhan, China, of novel coronavirus–infected pneumonia. N Engl J Med. 2020;382(13):1199–1207. doi:10.1056/NEJMoa2001316
4. Bi P, Wang J, Hiller JE. Weather: driving force behind the transmission of severe acute respiratory syndrome in China? Intern Med J. 2007;37(8):550–554. doi:10.1111/j.1445-5994.2007.01358.x
5. Casanova LM, Jeon S, Rutala WA, Weber DJ, Sobsey MD. Effects of air temperature and relative humidity on coronavirus survival on surfaces. Appl Environ Microbiol. 2010;76(9):2712–2717. doi:10.1128/AEM.02291-09
6. Chan KH, Peiris JM, Lam SY, Poon LL, Yuen KY, Seto WH. The effects of temperature and relative humidity on the viability of the SARS coronavirus. Adv Virol. 2011;2011:1–7. doi:10.1155/2011/734690
7. Van Doremalen N, Bushmaker T, Munster VJ. Stability of Middle East respiratory syndrome coronavirus (MERS-CoV) under different environmental conditions. Eurosurveillance. 2013;18(38):20590. doi:10.2807/1560-7917.ES2013.18.38.20590
8. Prata DN, Rodrigues W, Bermejo PH. Temperature significantly changes COVID-19 transmission in (sub) tropical cities of Brazil. Sci Total Environ. 2020;25:138862. doi:10.1016/j.scitotenv.2020.138862
9. Bannister-Tyrrell M, Meyer A, Faverjon C, Cameron A. Preliminary evidence that higher temperatures are associated with a lower incidence of COVID-19, for cases reported globally up to 29th February 2020. medRxiv. 2020.
10. Liang LL, Tseng CH, Ho HJ, Wu CY. COVID-19 mortality is negatively associated with test numbers and government effectiveness. Sci Rep. 2020;10(1):1–7. doi:10.1038/s41598-020-68862-x
11. Chaudhry R, Dranitsaris G, Mubashir T, Bartoszko J, Riazi S. A country-level analysis measuring the impact of government actions, country preparedness, and socioeconomic factors on COVID-19 mortality and related health outcomes. E Clin Med. 2020:100464.
12. Assessment RR. Coronavirus disease 2019 (COVID-19) in the EU/EEA and the UK–ninth update.
 © 2020 The Author(s). This work is published and licensed by Dove Medical Press Limited. The
full terms of this license are available at https://www.dovepress.com/terms
and incorporate the Creative Commons Attribution
- Non Commercial (unported, 3.0) License.
By accessing the work you hereby accept the Terms. Non-commercial uses of the work are permitted
without any further permission from Dove Medical Press Limited, provided the work is properly
attributed. For permission for commercial use of this work, please see paragraphs 4.2 and 5 of our Terms.
© 2020 The Author(s). This work is published and licensed by Dove Medical Press Limited. The
full terms of this license are available at https://www.dovepress.com/terms
and incorporate the Creative Commons Attribution
- Non Commercial (unported, 3.0) License.
By accessing the work you hereby accept the Terms. Non-commercial uses of the work are permitted
without any further permission from Dove Medical Press Limited, provided the work is properly
attributed. For permission for commercial use of this work, please see paragraphs 4.2 and 5 of our Terms.