Back to Journals » OncoTargets and Therapy » Volume 11
Predictive value of positron emission tomography for the prognosis of molecularly targeted therapy in solid tumors
Authors Xie X, Chen H, Yang H, Lin H, Zhou S, Shen R, Lu C, Ling L, Lin W, Liao Z
Received 23 June 2018
Accepted for publication 7 November 2018
Published 7 December 2018 Volume 2018:11 Pages 8885—8899
DOI https://doi.org/10.2147/OTT.S178076
Checked for plagiarism Yes
Review by Single anonymous peer review
Peer reviewer comments 2
Editor who approved publication: Prof. Dr. Geoffrey Pietersz
Xianhe Xie,1,* Huijuan Chen,1,* Haitao Yang,1 Heng Lin,2 Sijing Zhou,1 Ruifen Shen,1 Cuiping Lu,3 Liting Ling,1 Wanzun Lin,1 Ziyuan Liao1
1Department of Chemotherapy, The First Affiliated Hospital of Fujian Medical University, Fuzhou, Fujian, People’s Republic of China; 2Department of Oncology, Fuzhou Pulmonary Hospital, Fuzhou, Fujian, People’s Republic of China; 3Department of Medical Oncology, Longyan First Hospital Affiliated to Fujian Medical University, Longyan, Fujian, People’s Republic of China
*These authors contributed equally to this work
Objective: This study aimed at comprehensively exploring the value applying positron emission tomography (PET) to predict the effect of molecularly targeted therapy in solid tumors.
Materials and methods: A systematic search was performed for potentially relevant studies from the time of inception to February 2017. The primary endpoints were progression-free survival (PFS), overall survival (OS), and time to progression (TTP). The results were analyzed by Review Manager version 5.3 (RevMan 5.3) statistical software. Subgroup analyses were implemented based on the type of molecularly targeted agents (monoclonal antibodies arm and small molecular targeted agents arm), mechanism (erlotinib/gefitinib arm and bevacizumab arm), radioactive tracers, type of tumor, and reevaluated PET timing.
Results: Twenty-six studies incorporating 865 individuals were eligible. Compared with PET nonresponse group, PET response group displayed a decrease in maximal standard uptake value (SUVmax), which was associated with a significantly prolonged PFS (HR =0.41, 95% CI [0.29, 0.59]; P<0.00001), OS (HR =0.52, 95% CI [0.40, 0.67]; P<0.00001), and TTP (HR =0.30, 95% CI [0.14, 0.66]; P=0.003). Similar results were obtained in the subgroup analyses of PFS in erlotinib/gefitinib arm and small molecular targeted agents arm; and OS in lung cancer arm, erlotinib/gefitinib arm, bevacizumab arm, small molecular targeted agents arm, monoclonal antibodies arm, 18F-fluorodeoxythymidine (18F-FLT) arm, 18F-fluorodeoxyglucose (18F-FDG) arm, and early PET timing arm.
Conclusion: Our study demonstrated that PET was a favorable approach to predict the prognosis of molecularly targeted therapy for solid tumors. PET assessment within 2 weeks could be useful to predict clinical outcome.
Keywords: positron emission tomography, PET, molecularly targeted therapy, monoclonal antibody, malignancy, solid tumor
Introduction
It is well known that early prediction of the treatment response is critical for patients with malignancies to optimize effective therapeutic regimen, avoid adverse effects, and save cost.
Classical imaging tools, such as computed tomography (CT) and magnetic resonance imaging (MRI), are widely used for response assessment. Nevertheless, the limitations of these morphologic imaging techniques can hardly be neglected, for they barely distinguishes posttreatment fibrosis, scar, and necrosis from residual or recurrent disease1 and only provides information on tumor anatomy by assessing volume change. Moreover, tumor shrinkage usually scarcely occurs until after several cycles of therapy,2 which hinders an early estimating response.
Recently, molecularly targeted therapy, with its high specificity, efficacy, and fewer toxicities in managing malignant tumor, has been rapidly put into a routine clinical practice. They are designed to block pathological cellular pathways related to cancer cell survival, proliferation, and metastasis,3 and to decrease vascular permeability, microvascular density, and cell density.4 However, response monitoring in malignant tumor treated with molecularly targeted therapy is challenging. Individuals frequently benefit from targeted agents without volumetric change.5–8 Thus, with the evolution of treatment regimens and availability of molecularly targeted therapies, a novel imaging approach for supervising therapeutic efficacy focusing more on the biochemistry of the tumor is imperative.
Fortunately, positron emission tomography (PET) has been increasingly noted for its metabolic tumor response assessment, especially in targeted therapy. It was exerting a fascination on predicting long-term outcome via monitoring the metabolism of tissues even in the absence of tumor shrinkage,9–11 and was potentially providing an early assessment of the response of targeted therapy3 but was inconsistent in various tumors and evaluating time points. Therefore, the goal of this study was to investigate whether the early tumor uptake change in PET was associated with clinical outcomes, and to identify whether PET could be a candidate for measuring response in malignancies treated with molecularly targeted agents.
Materials and methods
Literature search
Researches were identified by a systematic electronic literature search for abstracts of relevant studies in the published literature. MEDLINE/PubMed, Google Scholar, EMBASE, and Cochrane Library were scrutinized and updated from July 1, 2016 to February 9, 2017. The following basic search terms were used: “positron emission tomography,” “PET,” “targeted therapies,” “bevacizumab,” “cetuximab,” “Erbitux,” “trastuzumab,” “Herceptin,” “erlotinib,” “Tarceva,” “gefitinib,” “Iressa,” “sorafenib,” “Nexavar,” “axitinib,” “lapatinib,” “rituximab,” “tyrosine kinase inhibitor,” “antiangiogenic treatment,” “solid tumor,” “lung cancer,” “breast cancer,” “gliomas,” “gastrointestinal stromal tumor,” “colon cancer,” “renal cell carcinoma,” and “biliary tract cancer.” Full-text articles were reviewed if abstracts did not provide sufficient information. Moreover, the reference lists of relevant articles were traced for additional studies. Reviews, letters to the editor, case reports, conference abstracts, and editorials comments were excluded. The search was performed without any language restriction.
Selection of studies
Two investigators independently performed an initial screening of titles and abstracts, and then further examined the full-text articles to recruit relevant studies. Disagreement on whether an article should be included was resolved by a third reviewer.
Detailed inclusion criteria
Inclusion criteria were as follows: 1) prospective or retrospective studies exploring the correlation of maximal standard uptake value (SUVmax) with progression-free survival (PFS), overall survival (OS), and/or time to progression (TTP); 2) evaluating over 10 cases involving molecularly targeted agents; 3) individuals had been histologically or cytologically confirmed as having malignant solid tumors; 4) utilizing PET to monitor therapy response of pretherapy and posttreatment; 5) supervising response according to quantitative changes on SUVmax; and 6) HRs with 95% CIs of survival data were accessible.
Data extraction
Data extraction was conducted conforming to the PRISMA guidance (S1 PRISMA Checklist).12 Two authors independently extracted information from all the eligible studies. Disagreement between the two reviewers was resolved by a third reviewer. All of the eligible studies contained the following data: first author’s name, published year, median ages, number of patients, number of males, study design, type of tumor, molecularly targeted agents, reevaluated PET timing, and survival endpoints. PFS, OS, and/or TTP data were served as the endpoints to evaluate the prognostic significance of PET and expressed by HRs. HRs with 95% CIs were calculated from survival curves based on Tierney’s and Parmar’s methods if they were presented indirectly.13,14
Quality assessment
Two reviewers independently evaluated the quality items and discrepancies were solved by conferring with a third reviewer. We deemed the description of PET to be qualified if the study elaborated the scanner type and the timing of scanning after injection.
Statistical methods
Statistical analyses were calculated by Review Manager version 5.3 (RevMan 5.3) statistical software. Survival data from each study were evaluated based on the Kaplan–Meier curves. The impact of SUVmax on PFS, OS, and TTP was measured using HRs with 95% CIs, which were extracted from papers or from the survival curves via the methods by Parmar et al,14 and Tierney et al13 when HRs were not provided directly. Survival rates represented on the graphical survival curves were calculated by Engauge Digitizer version 2.5. An HR <1 denoted the survival benefit from a response PET scan, while an HR >1 implied worse survival outcomes. It was considered statistically significant when P-value was less than 0.05. Cutoff values of the change on SUVmax were determined by the definition in each individual study, and PET response and nonresponse groups were defined according to the alteration in cutoff value of SUVmax. Subgroup analyses were carried out based on the variety of molecularly targeted agents, mechanism, the reevaluated PET timing, types of malignancies, and radioactive tracers. Statistical heterogeneity was estimated via the chi-square and the I-square tests.15 The significant heterogeneity existed if P<0.1 or I2>50%, and no heterogeneity existed when P>0.1 and I2<50%. A fixed effect model was applied to calculate the pooled HRs when no heterogeneity was observed, otherwise, a random effect model was employed. Publication bias was exhibited via funnel plot.
Results
Study selection
Initially, 2,920 potentially relevant articles were thoroughly searched from all databases. Of them, 313 were filtered due to duplication. After screening the titles and abstracts, 2,527 were excluded for deviating from the subject. Then, the full text of remaining 80 papers was intensively scrutinized, and 55 were removed for the following reasons: SUVmax was unavailable (n=11), targeted therapy based on regimen was not administered in every individual (n=7), evaluating less than 10 patients (n=18), unable to calculate the log HR and its variance (n=13), and unfit design (n=6). Ultimately, a total of 25 articles (including 26 studies)2,3,16–38 were eligible for this analysis. The detailed study selection process is described in Figure 1.
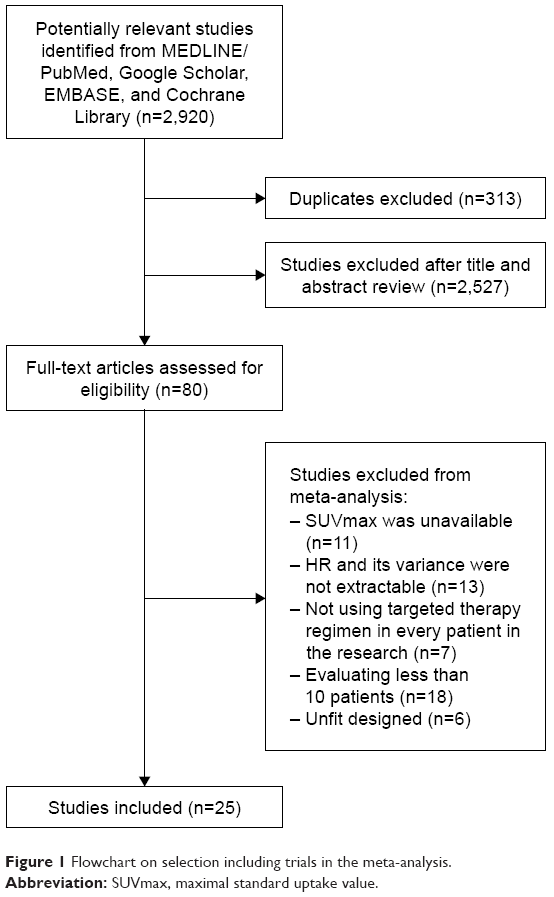 | Figure 1 Flowchart on selection including trials in the meta-analysis. |
Study characteristics
Totally, 865 participants in the 25 articles (including 26 studies) published from the time of inception to February 9, 2017 were eligible. The sample size varied from 12 to 86 subjects. Of these articles, 12 were on non-small cell lung cancer (NSCLC) (49.48% of patients),2,3,16,18,19,21,22,24,26,27,35,38 two on malignant glioma (5.90% of patients),23,34 two on metastatic colorectal cancer (CRC) (7.63% of patients),31,36 two on gastrointestinal stromal tumor (GIST) (7.28% of patients),29,30 two on metastatic renal cell carcinoma (RCC) (9.60% of patients),25,37 and five on other solid tumors (metastatic gastric adenocarcinoma, metastatic breast cancer, metastatic melanoma, biliary tract cancer, and mixed kinds of tumors; 20.12% of patients).17,20,28,32,33 Meanwhile, all of these articles coped with molecularly targeted therapy: six with erlotinib,3,16,21,22,24,27 six with bevacizumab,23,26,28,31,34,36 four with gefitinib,2,19,35,38 three with imatinib,17,29,32 two with sunitinib,25,30 one with cetuximab,33 and three with mixed kinds of molecularly targeted agents.18,20,37 PET-CT/PET was performed pretherapy and posttreatment. SUVmax was measured in all articles, which normalized values by body weight. PFS, OS, and TTP were defined as the endpoints to assess the prognostic significance of the changing SUVmax. Owing to the absence of consensus on metabolic response criteria, the participants were assigned to PET response or PET nonresponse group based on the change of SUVmax in each article. Of all the eligible studies, 17 provided an extractable HR value for PFS,3,16,18,20,21,23–26,28,30–32,35,36,38 19 for OS,2,3,16,17,19,21–28,31,33–37 and five for TTP.2,17,27,29,33 The principal characteristics and further details are summarized in Table 1.
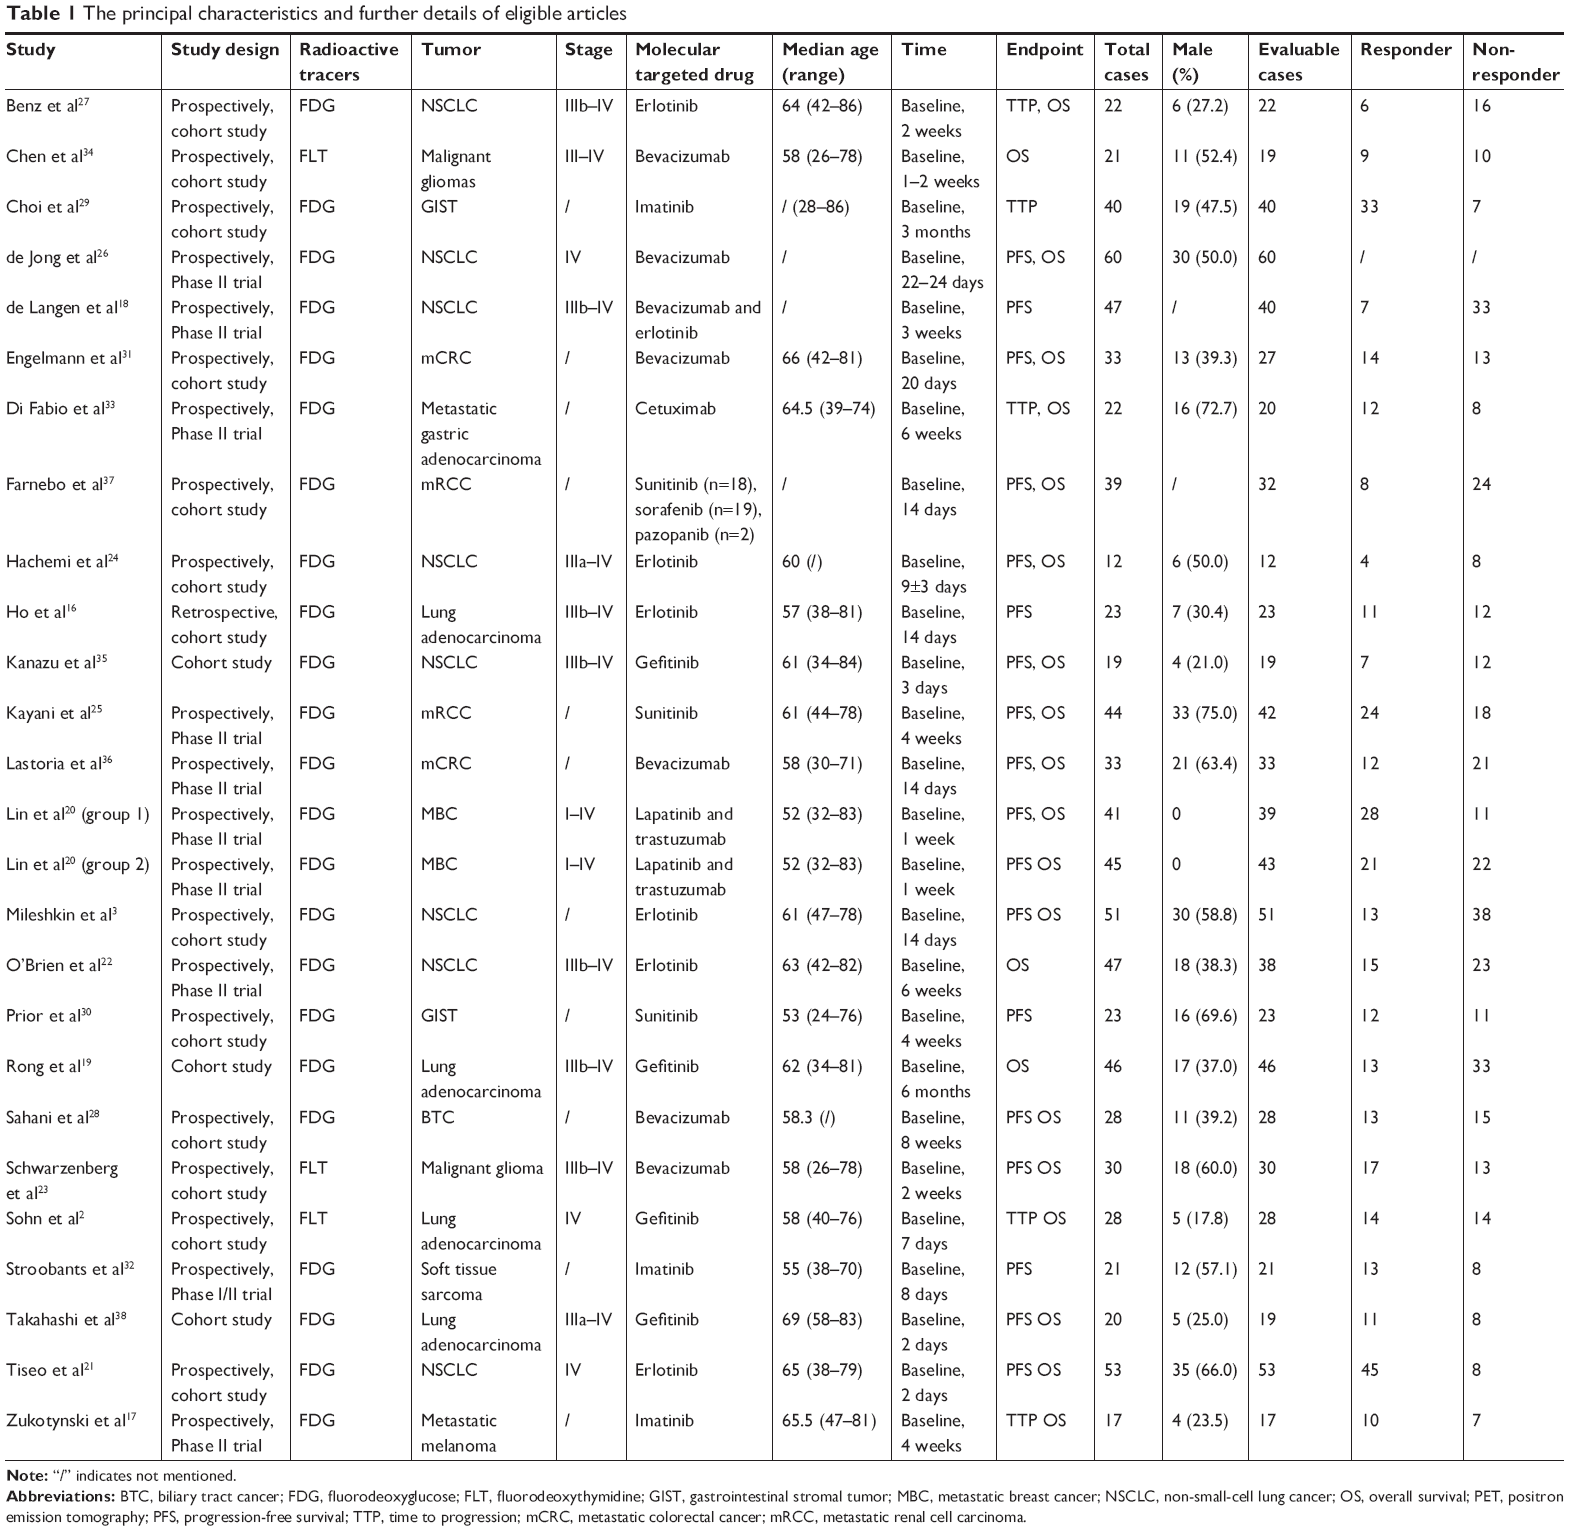 | Table 1 The principal characteristics and further details of eligible articles |
Data analysis
Predictive value of ΔSUVmax for PFS
A total of 16 articles including 17 studies focused on predictive value of ΔSUVmax for PFS. In pooled analysis, PFS was significantly prolonged in the responding group (HR =0.41, 95% CI [0.29–0.59]) by random model due to heterogeneity between the studies (I2=54%, P=0.004) (Figure 2A). The funnel plot indicated that there was no significant publication bias for included studies on PFS (Figure 2D). Subgroup analyses based on the tumors, targeted agents, mechanism, radioactive tracers, and reevaluated PET timing were performed owing to the apparent heterogeneity. We implemented subgroup analyses based on the type of molecularly targeted agents (monoclonal antibodies arm and small molecular targeted agents arm), mechanism (erlotinib/gefitinib arm and bevacizumab arm), radioactive tracers (18F-fluorodeoxythymidine [18F-FLT] arm and 18F-fluorodeoxyglucose [18F-FDG] arm), type of tumor (NSCLC arm), and reevaluated PET timing (early assessment and late assessment arms). Repeating PET within 2 weeks was defined as early assessment arm; otherwise, it was defined as late assessment arm.
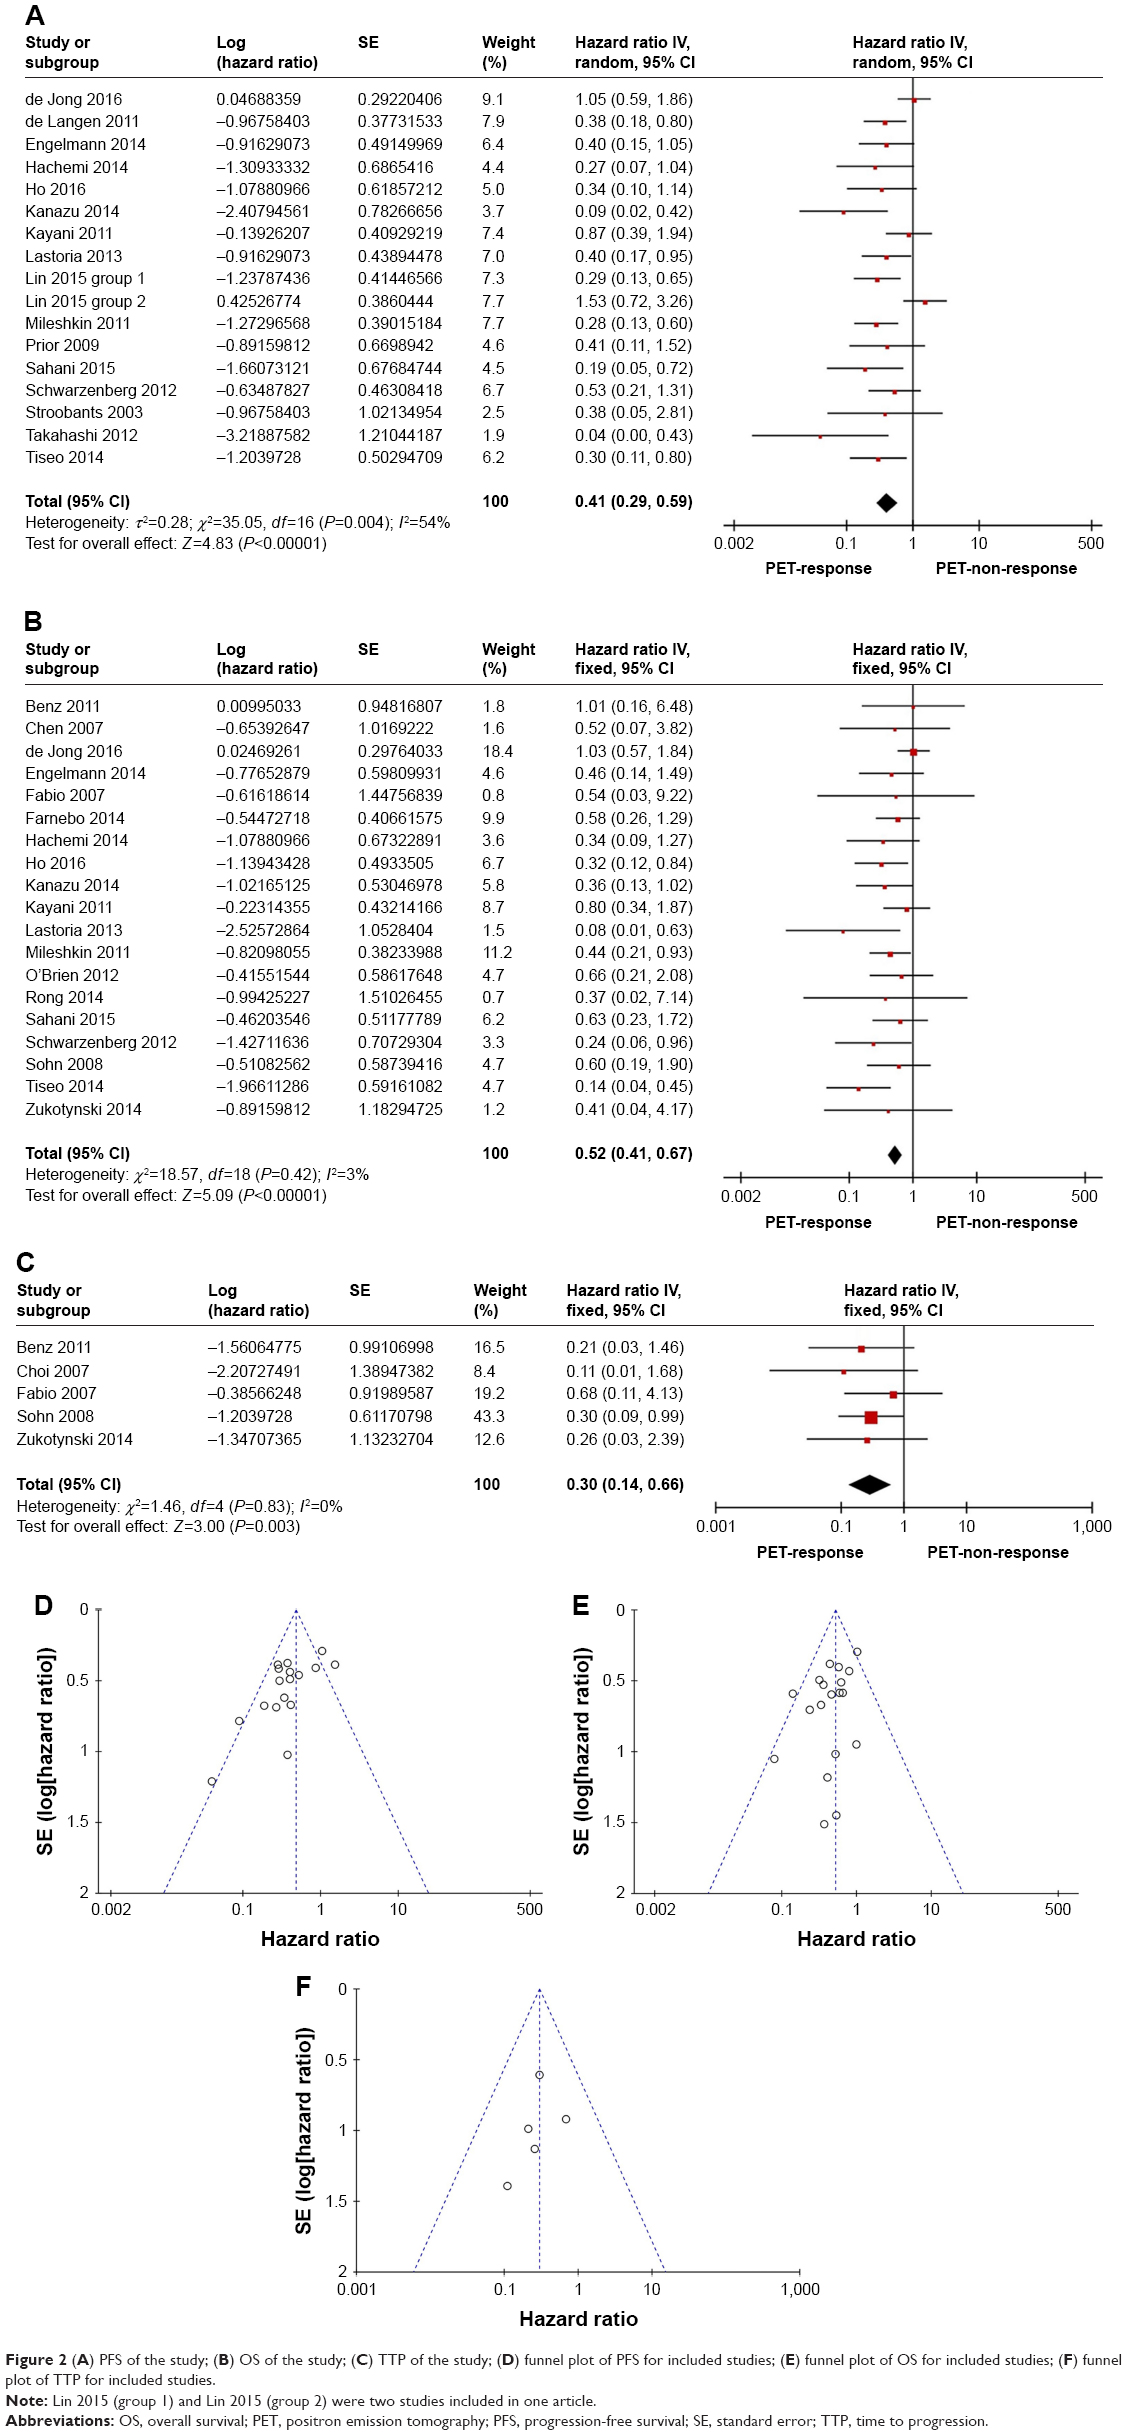 | Figure 2 (A) PFS of the study; (B) OS of the study; (C) TTP of the study; (D) funnel plot of PFS for included studies; (E) funnel plot of OS for included studies; (F) funnel plot of TTP for included studies. |
With respect to PFS, response group exhibited a significant longer survival in both erlotinib/gefitinib arm (Figure 3A) (HR =0.24, 95% CI [0.15–0.39], P<0.00001)3,16,21,24,35,38 and small molecular targeted agents arm as compared to PET nonresponse group (Figure 3B) (HR =0.34, 95% CI [0.23–0.50], P<0.00001)3,16,21,24,25,30,32,35,38 without heterogeneity.
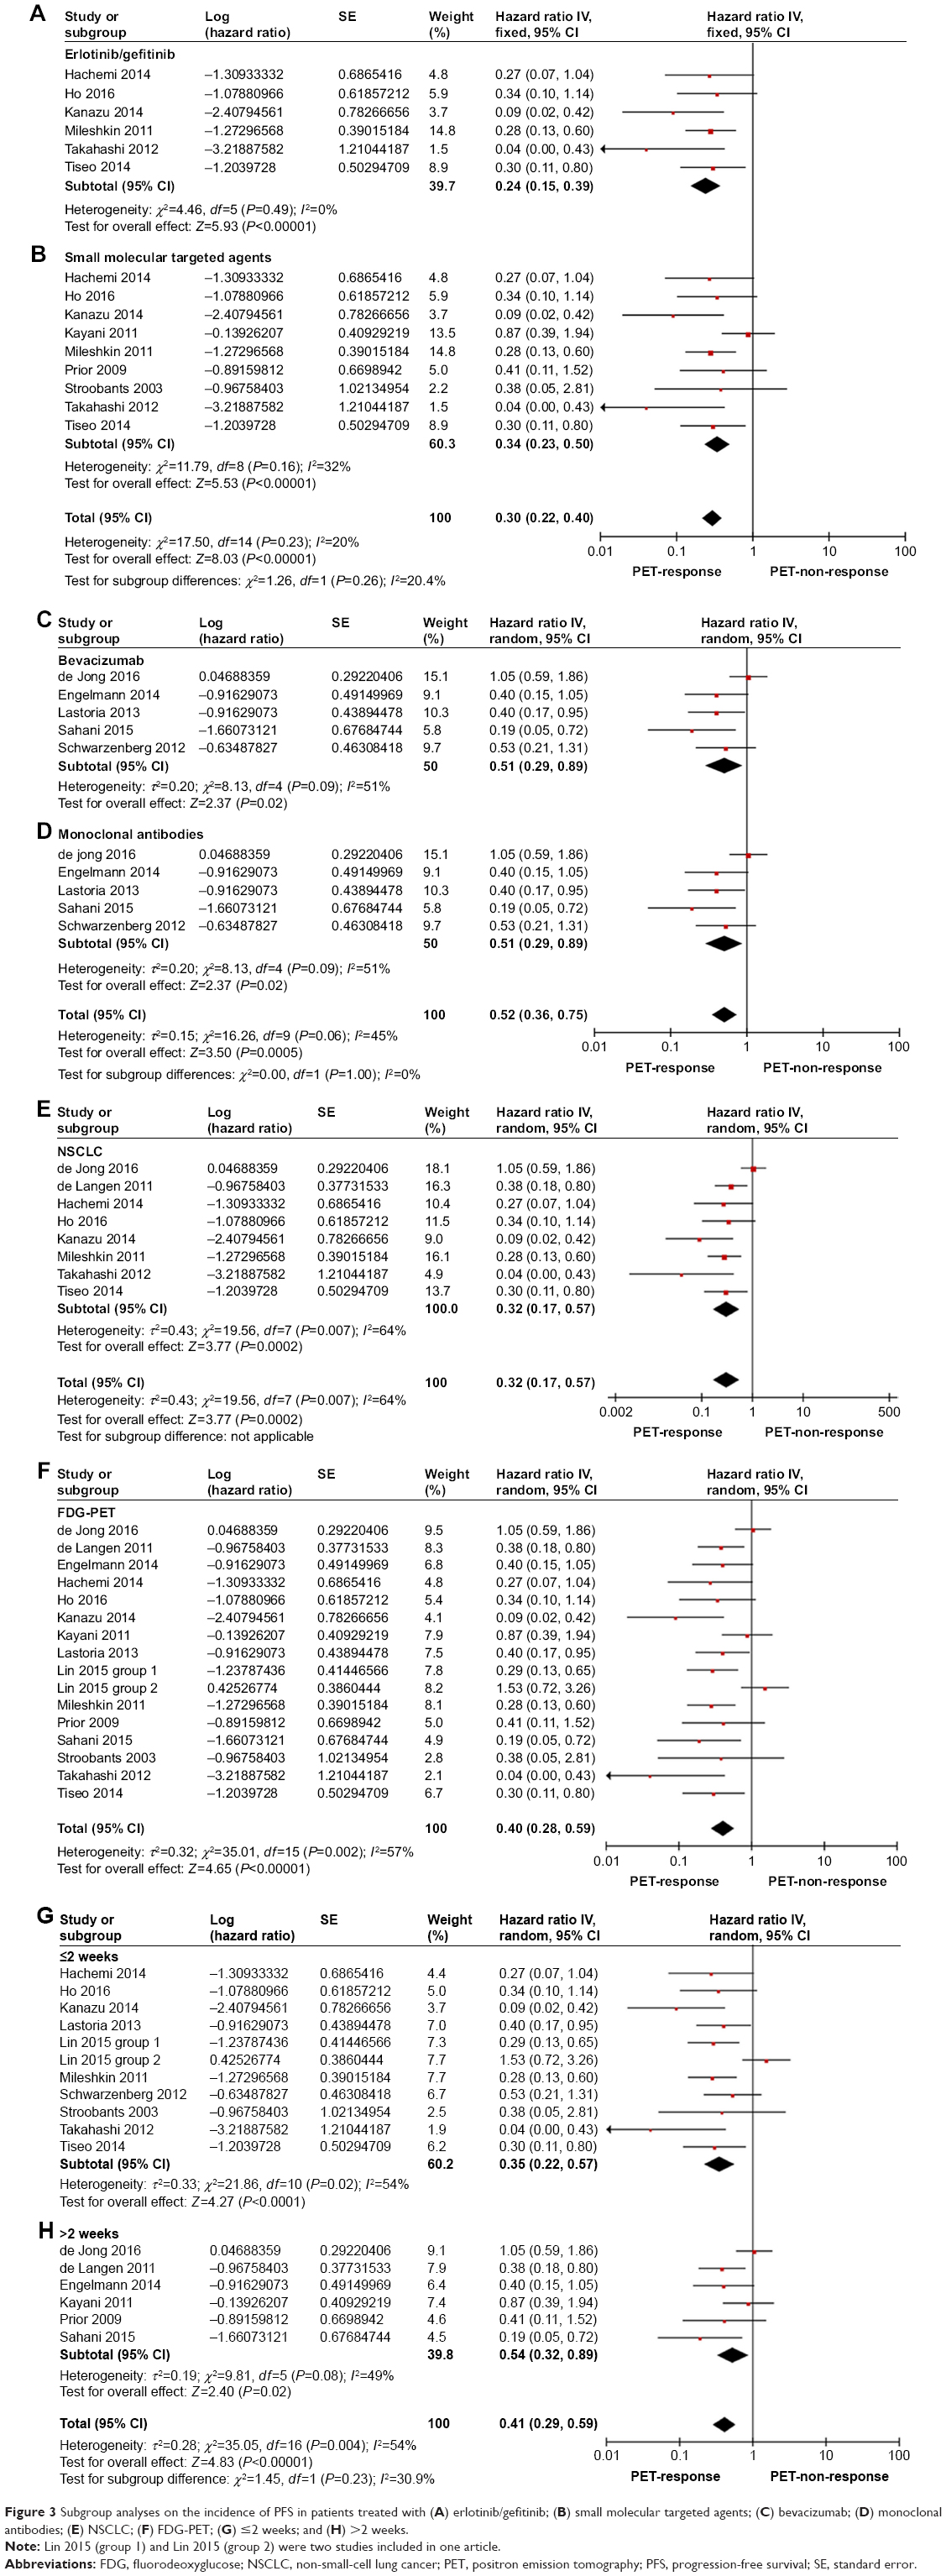 | Figure 3 Subgroup analyses on the incidence of PFS in patients treated with (A) erlotinib/gefitinib; (B) small molecular targeted agents; (C) bevacizumab; (D) monoclonal antibodies; (E) NSCLC; (F) FDG-PET; (G) ≤2 weeks; and (H) >2 weeks. |
In regard to PFS of bevacizumab arm (Figure 3C),23,26,28,31,36 monoclonal antibodies arm (Figure 3D),18,23,26,28,31,36 NSCLC arm (Figure 3E),3,16,18,21,24,26,35,38 18F-FDG arm (Figure 3F),3,16,18,20,21,24–26,28,30–32,35,36,38 early assessment arm (Figure 3G),3,16,20,21,23,24,32,35,36,38 and late assessment arm (Figure 3H),18,25,26,28,30,31 the outcome demonstrated that response group predicted a significantly longer PFS compared to nonresponse group with obvious heterogeneity.
Predictive value of ΔSUVmax for OS
Nineteen eligible studies incorporating 600 individuals2,3,16,17,19,21–28,31,33–37 were compared to OS of PET response group with that of PET nonresponse group. A fixed effect model was utilized owing to no heterogeneity (P=0.42, I2=3%). Compared to PET nonresponse group, PET response group displayed a prolonged pooled OS (HR =0.52; 95% CI [0.40–0.67]; P<0.00001) (Figure 2B). The shape of the funnel plots appeared to be generally symmetric, and indicated no publication bias (Figure 2E). Then further subgroup analyses showed that response group acquired a significant longer OS without heterogeneity in NSCLC arm (Figure 4A) (HR =0.52, 95% CI [0.38–0.72], P<0.0001),2,3,16,18,19,21,22,24,26,35 erlotinib/gefitinib arm (Figure 4B) (HR =0.39, 95% CI [0.27–0.58], P<0.00001),2,3,16,19,21,22,24,27,35 bevacizumab arm (Figure 4C) (HR =0.65, 95% CI [0.43–0.99], P=0.04),23,26,28,31,34,36 monoclonal antibodies arm (Figure 4D) (HR =0.65, 95% CI [0.43–0.98], P=0.04),23,26,28,31,33,34,36 small molecular targeted agents arm (Figure 4E) (HR =0.46, 95% CI [0.34–0.63], P<0.00001),2,3,16,17,19,21,22,24,25,27,35 18F-FDG arm (Figure 4H) (HR =0.53, 95% CI [0.41–0.69], P<0.00001),3,16,17,19,21,22,24–28,31,33,35–37 18F-FLT arm (Figure 4I) (HR =0.43, 95% CI [0.19–0.96], P=0.04),2,23,34 and in early assessment arm (Figure 4F) (HR =0.38, 95% CI [0.27–0.53], P<0.00001).2,3,16,21,23,24,27,34–37 However, late assessment arm displayed a longer survival in response group despite no statistical significance (Figure 4G) (HR =0.77, 95% CI [0.53–1.11], P=0.16).17,19,22,25,26,28,31,33
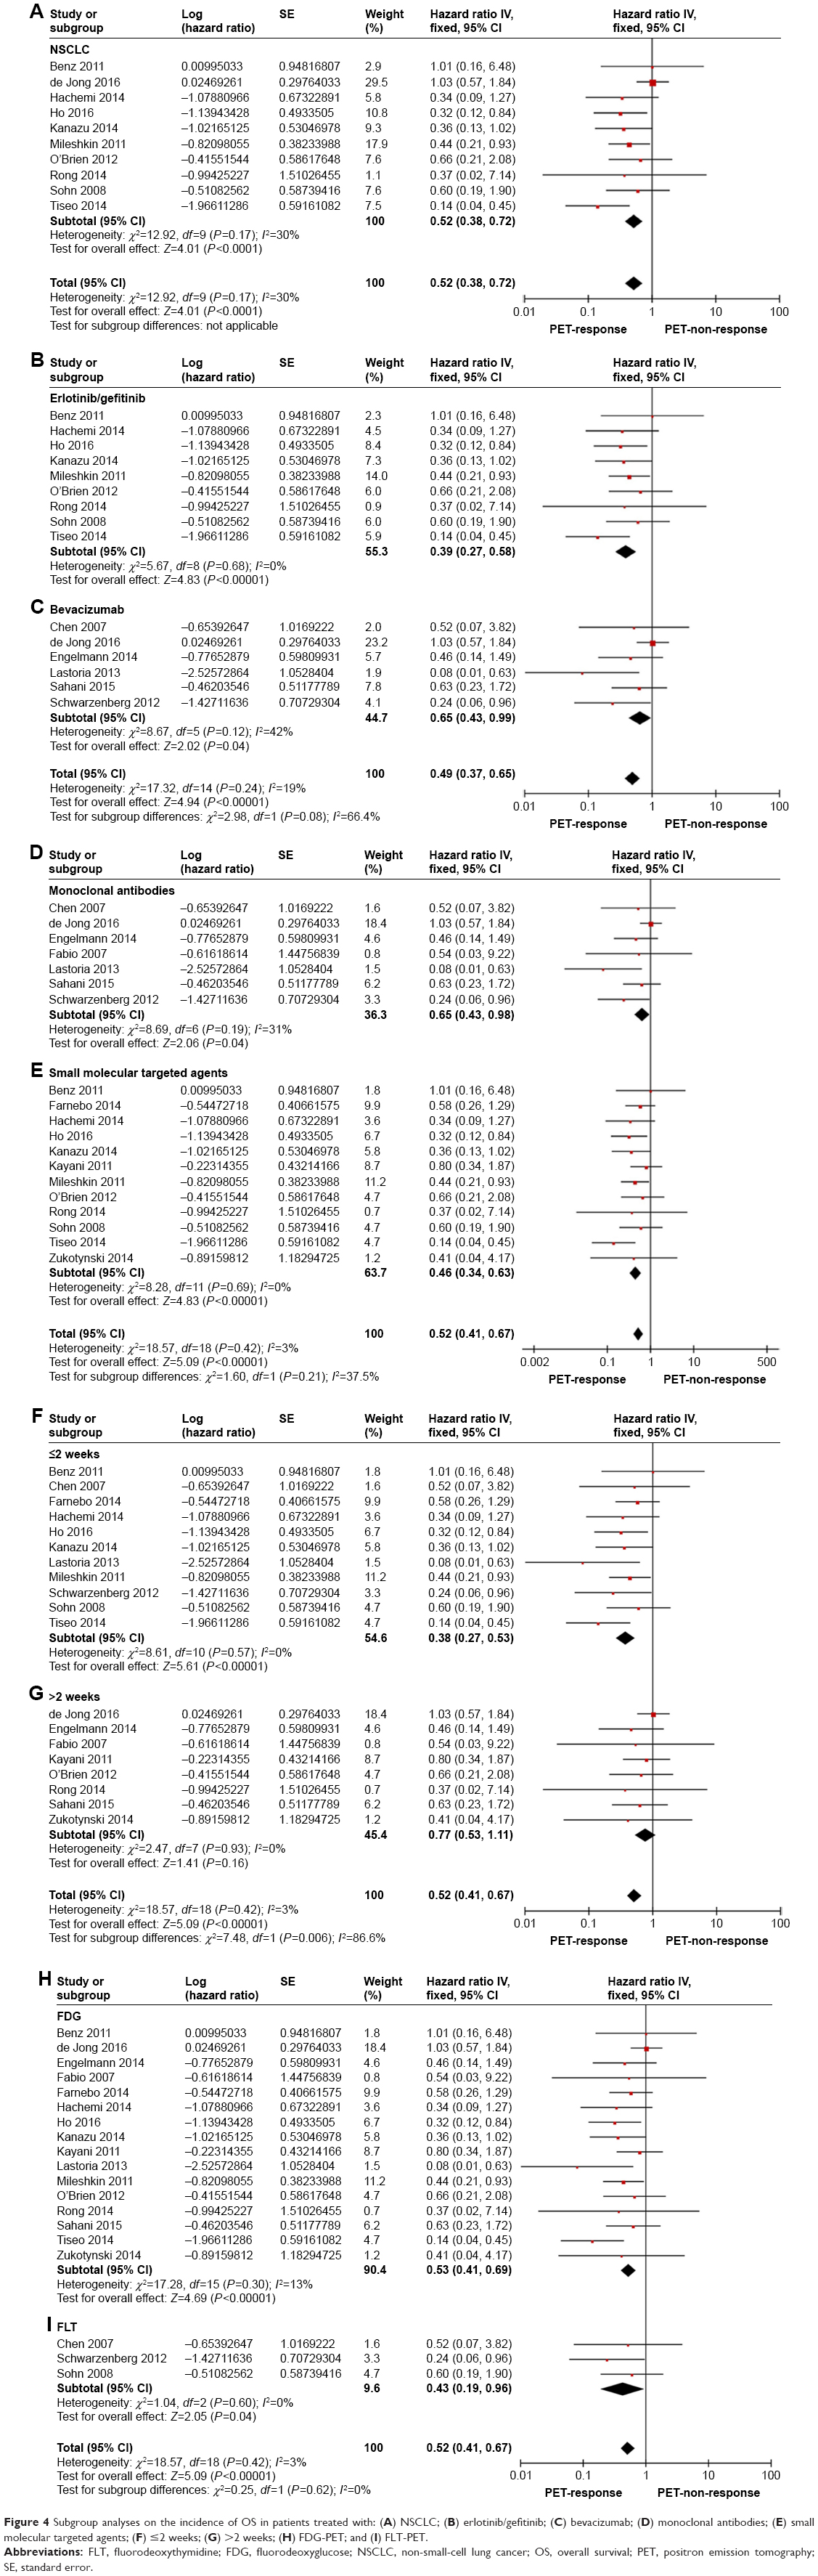 | Figure 4 Subgroup analyses on the incidence of OS in patients treated with: (A) NSCLC; (B) erlotinib/gefitinib; (C) bevacizumab; (D) monoclonal antibodies; (E) small molecular targeted agents; (F) ≤2 weeks; (G) >2 weeks; (H) FDG-PET; and (I) FLT-PET. |
Predictive value of ΔSUVmax for TTP
Five studies comprising 127 individuals2,17,27,29,33 explored the correlation between the decrease of ΔSUVmax and TTP. A fixed effect model was employed because of no heterogeneity (I2=83%, P=0). The result indicated that less decline of ΔSUVmax was associated with a significant shorter TTP (HR =0.30, 95 % CI [0.14–0.66]; P=0.03) (Figure 2C). The funnel plot indicated that no remarkable publication bias existed, suggesting that the obtained results were reliable (Figure 2F).
Discussion
To our best knowledge, this is the first meta-analysis to systematically estimate the value of PET in solid tumor treated with molecularly targeted therapy. Previous studies had proved PET to be competent to assess survival in diffuse large B-cell lymphoma after rituximab based regimen effectively.9 However, the prognostic value of PET in evaluating molecularly targeted therapy in solid tumor remained unclear.
Based on data from 25 articles, our study demonstrated that the decline of PET uptake administered with molecularly targeted therapy was related to a longer PFS, OS, and TTP, despite obvious heterogeneity in PFS. Further subgroup analyses displayed that in PET response group, a significant longer PFS was observed in erlotinib/gefitinib arm and small molecular targeted agents arm; and a longer OS in NSCLC arm, erlotinib/gefitinib arm, bevacizumab arm, small molecular targeted agents arm, monoclonal antibodies arm, 18F-FDG arm, 18F-FLT arm, and early assessment arm with no heterogeneity. These evidences supported that PET was a favorable approach to determine response of solid tumor treated with molecularly targeted therapy, especially with small molecular targeted agents, and a promising tool for the early detection of response.
When measuring response to anticancer treatment, a reliable and standardized methodology is essential in determining whether the ongoing therapy is beneficial. Anatomic tumor response metrics comprising WHO criteria (1979), Response Evaluation Criteria in Solid Tumors (RECIST) (2000), and RECIST 1.1 (2009)39,40 were widely applied, but were incompetent to distinguish necrosis, inflammation, and cavitation from residual or recurrent tumor lesions. Meanwhile, necrosis and cavitation without an alteration in size are frequently observed in angiogenesis inhibitors and anti-vascular therapies.41 Therefore, these anatomic criteria are insufficient for the evaluation of response to molecularly targeted therapies. In 1999, the European Organization for Research and Treatment of Cancer proposed a set of criteria to judge PET response based on metabolism.42 However, a workshop of the National Cancer Institute stated that there was neither one best criterion for assessing 18F-FDG PET, nor one unified standard for determining the significance of 18F-FDG PET.41 Subsequently, Positron Emission tomography Response Criteria In Solid Tumors assessed by changes in peak standard uptake value-lbm (SULpeak) was formulated but not widely applied. Summarily, the role of PET in assessing response of molecularly targeted therapy in solid tumor remains to be explored. Thereby, we proceeded this analysis to elaborate this issue.
The reason for conducting the reevaluated PET timing subgroup analysis was that the optimal time point to judge PET response remains to be determined. For morphologic imaging techniques, such as CT, which was based on volume, the first evaluating response was generally performed not earlier than 4 weeks following the initial treatment since little change occurred at early stage. Accordingly, clinician was frequently in a dilemma to determine the early treatment response and modify treatment strategy opportunely. However, in regard to PET, several investigations manifested that early PET assessment had been established as a prognostic biomarker for the response to targeted therapy in various tumors. Some studies advocated that early PET evaluation (on day 2–14) was competent to predict survival in NSCLC treated with erlotinib/gefitinib.2,3,16,18,19,21,22,24,26,27,35,38,43,44 Concordant results were also acquired in soft tissue sarcoma,32 malignant glioma,23,34 breast cancer,20 CRC,31,36 and RCC.25,37 In our study, early assessment was defined as reevaluating PET within 2 weeks, and it indicated that early assessment proved to be a valuable predictor of long-term outcome. The inherent mechanism that lay behind it was the decline of 18F-FDG uptake 24–48 hours before inhibition of proliferation and induction of apoptosis in gefitinib-sensitive tumors,45 but such phenomenon was not observed in response to conventional cytotoxic chemotherapy.46 This study revealed the potential of applying PET screening during the early change in tumor activity, thereby facilitating an early adjustment of therapeutic strategy and to maximize therapeutic effect, minimize side effect, and save cost.
Furthermore, our results demonstrated that 18F-FLT and 18F-FDG possessed comparable advantage in assessing response in malignancies treated with molecularly targeted therapy. Currently, 18F-FDG PET has enjoyed widespread popularity for imaging extracranial tumors and 18F-FLT PET in gliomas,47 but it fails to distinguish proliferation from inflammation, for both of them possess active glycometabolism. Moreover, 18F-FDG uptake is influenced not only by tumor glucose metabolism but also by inflammation,48 hypoxia,49 and fasting time or serum glucose level50 as well. Interestingly, 18F-FLT, a PET tracer to mirror tumor cell proliferation, was a preferred tracer than 18F-FDG in identifying therapeutic effects. The mechanism behind it was possibly, in contrast to 18F-FDG (a glucose analog) and 18F-FLT (a thymidine analog), retained in proliferating tissues through the activity of thymidine kinase-1.51 Briefly, 18F-FDG accumulates in tissues with high glycolytic activity, but 18F-FLT aggregates in proliferating cells, the latter exhibiting a proliferation specificity52,53 and being a potentially preferable candidate for evaluating response to targeted therapy.54 Further studies are recommended since only three eligible articles about 18F-FLT were recruited.
Limitations
The limitations of this study included: first, the sample size was relatively small and some recruited articles were retrospective, although the eligible studies contained 25 comprising 865 participants; second, the cutoff changing level of SUVmax in eligible studies lacked uniform response criteria. This meta-analysis will be updated if further eligible studies are identified.
Conclusion
Our study demonstrated that PET was a favorable approach to predict the prognosis of molecularly targeted therapy for solid tumors. PET assessment within 2 weeks could be useful to predict clinical outcome.
Disclosure
The authors report no conflicts of interest in this work.
References
Maffione AM, Marzola MC, Capirci C, Colletti PM, Rubello D. Value of (18)F-FDG PET for Predicting Response to Neoadjuvant Therapy in Rectal Cancer: Systematic Review and Meta-Analysis. AJR Am J Roentgenol. 2015;204(6):1261–1268. | ||
Sohn HJ, Yang YJ, Ryu JS, et al. 18F-Fluorothymidine positron emission tomography before and 7 days after gefitinib treatment predicts response in patients with advanced adenocarcinoma of the lung. Clin Cancer Res. 2008;14(22):7423–7429. | ||
Mileshkin L, Hicks RJ, Hughes BG, et al. Changes in 18F-fluorodeoxyglucose and 18F-fluorodeoxythymidine positron emission tomography imaging in patients with non-small cell lung cancer treated with erlotinib. Clin Cancer Res. 2011;17(10):3304–3315. | ||
Normanno N, Bianco C, de Luca A, Maiello MR, Salomon DS. Target-based agents against ErbB receptors and their ligands: a novel approach to cancer treatment. Endocr Relat Cancer. 2003;10(1):1–21. | ||
Shepherd FA, Rodrigues Pereira J, Ciuleanu T, et al. Erlotinib in previously treated non-small-cell lung cancer. N Engl J Med. 2005;353(2):123–132. | ||
Hotta K, Matsuo K, Ueoka H, et al. Continued gefitinib treatment after disease stabilisation prolongs survival of Japanese patients with non-small-cell lung cancer: Okayama Lung Cancer Study Group experience. Ann Oncol. 2005;16(11):1817–1823. | ||
Fukuoka M, Yano S, Giaccone G, et al. Multi-institutional randomized phase II trial of gefitinib for previously treated patients with advanced non-small-cell lung cancer (The IDEAL 1 Trial) [corrected]. J Clin Oncol. 2003;21(12):2237–2246. | ||
Kris MG, Natale RB, Herbst RS, et al. Efficacy of gefitinib, an inhibitor of the epidermal growth factor receptor tyrosine kinase, in symptomatic patients with non-small cell lung cancer: a randomized trial. JAMA. 2003;290(16):2149–2158. | ||
Zhu Y, Lu J, Wei X, Song S, Huang G. The predictive value of interim and final [18F] fluorodeoxyglucose positron emission tomography after rituximab-chemotherapy in the treatment of non-Hodgkin’s lymphoma: a meta-analysis. Biomed Res Int. 2013;2013:275805. | ||
Therasse P, Arbuck SG, Eisenhauer EA, et al. New guidelines to evaluate the response to treatment in solid tumors. European Organization for Research and Treatment of Cancer, National Cancer Institute of the United States, National Cancer Institute of Canada. J Natl Cancer Inst. 2000;92(3):205–216. | ||
Padhani AR, Ollivier L. The RECIST (Response Evaluation Criteria in Solid Tumors) criteria: implications for diagnostic radiologists. Br J Radiol. 2001;74(887):983–986. | ||
Moher D, Liberati A, Tetzlaff J, Altman DG; PRISMA Group. Preferred reporting items for systematic reviews and meta-analyses: the PRISMA statement. Int J Surg. 2010;8(5):336–341. | ||
Tierney JF, Stewart LA, Ghersi D, Burdett S, Sydes MR. Practical methods for incorporating summary time-to-event data into meta-analysis. Trials. 2007;8:16. | ||
Parmar MK, Torri V, Stewart L. Extracting summary statistics to perform meta-analyses of the published literature for survival endpoints. Stat Med. 1998;17(24):2815–2834. | ||
Higgins JP, Thompson SG, Deeks JJ, Altman DG. Measuring inconsistency in meta-analyses. BMJ. 2003;327(7414):557–560. | ||
Ho KC, Fang YD, Chung HW, et al. TLG-S criteria are superior to both EORTC and PERCIST for predicting outcomes in patients with metastatic lung adenocarcinoma treated with erlotinib. Eur J Nucl Med Mol Imaging. 2016;43(12):2155–2165. | ||
Zukotynski K, Yap JT, Giobbie-Hurder A, et al. Metabolic response by FDG-PET to imatinib correlates with exon 11 KIT mutation and predicts outcome in patients with mucosal melanoma. Cancer Imaging. 2014;14:30. | ||
de Langen AJ, van den Boogaart V, Lubberink M, et al. Monitoring response to antiangiogenic therapy in non-small cell lung cancer using imaging markers derived from PET and dynamic contrast-enhanced MRI. J Nucl Med. 2011;52(1):48–55. | ||
Rong X, Cai X, Li R, et al. Positron emission tomography-computed tomography on predicting the efficacy of targeted therapy for lung adenocarcinoma. Thorac Cancer. 2014;5(4):297–303. | ||
Lin NU, Guo H, Yap JT, et al. Phase II Study of Lapatinib in Combination With Trastuzumab in Patients With Human Epidermal Growth Factor Receptor 2-Positive Metastatic Breast Cancer: Clinical Outcomes and Predictive Value of Early [18F]Fluorodeoxyglucose Positron Emission Tomography Imaging (TBCRC 003). J Clin Oncol. 2015;33(24):2623–2631. | ||
Tiseo M, Ippolito M, Scarlattei M, et al. Predictive and prognostic value of early response assessment using 18FDG-PET in advanced non-small cell lung cancer patients treated with erlotinib. Cancer Chemother Pharmacol. 2014;73(2):299–307. | ||
O’Brien ME, Myerson JS, Coward JI, et al. A phase II study of 18F-fluorodeoxyglucose PET-CT in non-small cell lung cancer patients receiving erlotinib (Tarceva); objective and symptomatic responses at 6 and 12 weeks. Eur J Cancer. 2012;48(1):68–74. | ||
Schwarzenberg J, Czernin J, Cloughesy TF, et al. 3′-deoxy-3′-18F-fluorothymidine PET and MRI for early survival predictions in patients with recurrent malignant glioma treated with bevacizumab. J Nucl Med. 2012;53(1):29–36. | ||
Hachemi M, Couturier O, Vervueren L, et al. [18F]FDG positron emission tomography within two weeks of starting erlotinib therapy can predict response in non-small cell lung cancer patients. PLoS One. 2014;9(2):e87629. | ||
Kayani I, Avril N, Bomanji J, et al. Sequential FDG-PET/CT as a biomarker of response to Sunitinib in metastatic clear cell renal cancer. Clin Cancer Res. 2011;17(18):6021–6028. | ||
de Jong EE, van Elmpt W, Leijenaar RT, et al. [18F]FDG PET/CT-based response assessment of stage IV non-small cell lung cancer treated with paclitaxel-carboplatin-bevacizumab with or without nitroglycerin patches. Eur J Nucl Med Mol Imaging. 2017;44(1):8–16. | ||
Benz MR, Herrmann K, Walter F, et al. (18)F-FDG PET/CT for monitoring treatment responses to the epidermal growth factor receptor inhibitor erlotinib. J Nucl Med. 2011;52(11):1684–1689. | ||
Sahani DV, Hayano K, Galluzzo A, Zhu AX. Measuring treatment response to systemic therapy and predicting outcome in biliary tract cancer: comparing tumor size, volume, density, and metabolism. AJR Am J Roentgenol. 2015;204(4):776–781. | ||
Choi H, Charnsangavej C, Faria SC, et al. Correlation of computed tomography and positron emission tomography in patients with metastatic gastrointestinal stromal tumor treated at a single institution with imatinib mesylate: proposal of new computed tomography response criteria. J Clin Oncol. 2007;25(13):1753–1759. | ||
Prior JO, Montemurro M, Orcurto MV, et al. Early prediction of response to sunitinib after imatinib failure by 18F-fluorodeoxyglucose positron emission tomography in patients with gastrointestinal stromal tumor. J Clin Oncol. 2009;27(3):439–445. | ||
Engelmann BE, Loft A, Kjær A, et al. Positron emission tomography/computed tomography and biomarkers for early treatment response evaluation in metastatic colon cancer. Oncologist. 2014;19(2):164–172. | ||
Stroobants S, Goeminne J, Seegers M, et al. 18FDG-Positron emission tomography for the early prediction of response in advanced soft tissue sarcoma treated with imatinib mesylate (Glivec). Eur J Cancer. 2003;39(14):2012–2020. | ||
Di Fabio F, Pinto C, Rojas Llimpe FL, et al. The predictive value of 18F-FDG-PET early evaluation in patients with metastatic gastric adenocarcinoma treated with chemotherapy plus cetuximab. Gastric Cancer. 2007;10(4):221–227. | ||
Chen W, Delaloye S, Silverman DH, et al. Predicting treatment response of malignant gliomas to bevacizumab and irinotecan by imaging proliferation with [18F] fluorothymidine positron emission tomography: a pilot study. J Clin Oncol. 2007;25(30):4714–4721. | ||
Kanazu M, Maruyama K, Ando M, et al. Early pharmacodynamic assessment using 18F-fluorodeoxyglucose positron-emission tomography on molecular targeted therapy and cytotoxic chemotherapy for clinical outcome prediction. Clin Lung Cancer. 2014;15(3):182–187. | ||
Lastoria S, Piccirillo MC, Caracò C, et al. Early PET/CT scan is more effective than RECIST in predicting outcome of patients with liver metastases from colorectal cancer treated with preoperative chemotherapy plus bevacizumab. J Nucl Med. 2013;54(12):2062–2069. | ||
Farnebo J, Grybäck P, Harmenberg U, et al. Volumetric FDG-PET predicts overall and progression-free survival after 14 days of targeted therapy in metastatic renal cell carcinoma. BMC Cancer. 2014;14:408. | ||
Takahashi R, Hirata H, Tachibana I, et al. Early [18F]fluorodeoxyglucose positron emission tomography at two days of gefitinib treatment predicts clinical outcome in patients with adenocarcinoma of the lung. Clin Cancer Res. 2012;18(1):220–228. | ||
Moertel CG, Hanley JA. The effect of measuring error on the results of therapeutic trials in advanced cancer. Cancer. 1976;38(1):388–394. | ||
Miller AB, Hoogstraten B, Staquet M, Winkler A. Reporting results of cancer treatment. Cancer. 1981;47(1):207–214. | ||
Desar IM, van Herpen CM, van Laarhoven HW, Barentsz JO, Oyen WJ, van der Graaf WT. Beyond RECIST: molecular and functional imaging techniques for evaluation of response to targeted therapy. Cancer Treat Rev. 2009;35(4):309–321. | ||
Young H, Baum R, Cremerius U, et al. Measurement of clinical and subclinical tumour response using [18F]-fluorodeoxyglucose and positron emission tomography: review and 1999 EORTC recommendations. European Organization for Research and Treatment of Cancer (EORTC) PET Study Group. Eur J Cancer. 1999;35(13):1773–1782. | ||
Sunaga N, Oriuchi N, Kaira K, et al. Usefulness of FDG-PET for early prediction of the response to gefitinib in non-small cell lung cancer. Lung Cancer. 2008;59(2):203–210. | ||
Zander T, Scheffler M, Nogova L, et al. Early prediction of nonprogression in advanced non-small-cell lung cancer treated with erlotinib by using [(18)F]fluorodeoxyglucose and [(18)F]fluorothymidine positron emission tomography. J Clin Oncol. 2011;29(13):1701–1708. | ||
Su H, Bodenstein C, Dumont RA, et al. Monitoring tumor glucose utilization by positron emission tomography for the prediction of treatment response to epidermal growth factor receptor kinase inhibitors. Clin Cancer Res. 2006;12(19):5659–5667. | ||
Shields AF, Mankoff DA, Link JM, et al. Carbon-11-thymidine and FDG to measure therapy response. J Nucl Med. 1998;39(10):1757–1762. | ||
Chen W, Cloughesy T, Kamdar N, et al. Imaging proliferation in brain tumors with 18F-FLT PET: comparison with 18F-FDG. J Nucl Med. 2005;46(6):945–952. | ||
Kubota R, Kubota K, Yamada S, Tada M, Ido T, Tamahashi N. Microautoradiographic study for the differentiation of intratumoral macrophages, granulation tissues and cancer cells by the dynamics of fluorine-18-fluorodeoxyglucose uptake. J Nucl Med. 1994;35(1):104–112. | ||
Rajendran JG, Mankoff DA, O’Sullivan F, et al. Hypoxia and glucose metabolism in malignant tumors: evaluation by [18F]fluoromisonidazole and [18F]fluorodeoxyglucose positron emission tomography imaging. Clin Cancer Res. 2004;10(7):2245–2252. | ||
Paul R, Kiuru A, Söderström KO, et al. Organ and tumor distribution of (18F)-2-fluoro-2-deoxy-D-glucose in fasting and non-fasting rats. Life Sci. 1987;40(16):1609–1616. | ||
Rasey JS, Grierson JR, Wiens LW, Kolb PD, Schwartz JL. Validation of FLT uptake as a measure of thymidine kinase-1 activity in A549 carcinoma cells. J Nucl Med. 2002;43(9):1210–1217. | ||
Chen W, Cloughesy T, Kamdar N, et al. Imaging proliferation in brain tumors with 18F-FLT PET: comparison with 18F-FDG. J Nucl Med. 2005;46(6):945–952. | ||
Shields AF, Grierson JR, Dohmen BM, et al. Imaging proliferation in vivo with [F-18] FLT and positron emission tomography. Nat Med. 1998;4(11):1334–1336. | ||
Mckinley ET, Smith RA, Zhao P, et al. 3′-Deoxy-3′-18F-fluorothymidine PET predicts response to (V600E)BRAF-targeted therapy in preclinical models of colorectal cancer. J Nucl Med. 2013;54(3):424–430. |
 © 2018 The Author(s). This work is published and licensed by Dove Medical Press Limited. The
full terms of this license are available at https://www.dovepress.com/terms
and incorporate the Creative Commons Attribution
- Non Commercial (unported, 3.0) License.
By accessing the work you hereby accept the Terms. Non-commercial uses of the work are permitted
without any further permission from Dove Medical Press Limited, provided the work is properly
attributed. For permission for commercial use of this work, please see paragraphs 4.2 and 5 of our Terms.
© 2018 The Author(s). This work is published and licensed by Dove Medical Press Limited. The
full terms of this license are available at https://www.dovepress.com/terms
and incorporate the Creative Commons Attribution
- Non Commercial (unported, 3.0) License.
By accessing the work you hereby accept the Terms. Non-commercial uses of the work are permitted
without any further permission from Dove Medical Press Limited, provided the work is properly
attributed. For permission for commercial use of this work, please see paragraphs 4.2 and 5 of our Terms.