Back to Journals » Clinical Ophthalmology » Volume 15
Predictive Value of Intraocular Lens Power Calculation Formulae in Children
Authors Shuaib AM, Elhusseiny AM ![]() , Hassanein DH, Zedan RH, Elhilali HM
, Hassanein DH, Zedan RH, Elhilali HM
Received 23 April 2021
Accepted for publication 2 June 2021
Published 17 June 2021 Volume 2021:15 Pages 2527—2536
DOI https://doi.org/10.2147/OPTH.S316697
Checked for plagiarism Yes
Review by Single anonymous peer review
Peer reviewer comments 2
Editor who approved publication: Dr Scott Fraser
Asmaa M Shuaib, Abdelrahman M Elhusseiny, Dina H Hassanein, Rasha H Zedan, Hala M Elhilali
Faculty of Medicine, Cairo University, Cairo, Egypt
Correspondence: Abdelrahman M Elhusseiny
Department of Ophthalmology, Cairo University Faculty of Medicine, Cairo, Egypt
Email [email protected]
Purpose: To compare the accuracy of IOL power calculation formulae in a large cohort of children who underwent IOL implantation.
Setting: Cairo University Children Hospital.
Design: Retrospective, case series.
Methods: A retrospective chart review of all children < 14 years, who underwent primary or secondary IOL implantation in Cairo University Children Hospital from January 2016 to December 2019, was performed. Absolute prediction error (APE) was calculated for SRKII, SRK/T, Holladay I and Hoffer-Q formulae using the patients’ AL, keratometric (K) readings, implanted IOL power and refraction done two months postoperatively.
Results: The study included 308 eyes of 255 patients with a mean age of 4.74 ± 3.19 years at the time of surgery. The mean K-reading was 43.42 ± 3.57 diopters (D) and mean AL was 22.01 ± 1.93 mm. The percentage of eyes with APE within 0.5D was 27.7% (85 eyes), 32.2% (99 eyes), 30.6% (94 eyes) and 25.4% (78 eyes) with SRK II, SRK/T, Holladay I and Hoffer-Q formulae, respectively. APE was significantly lower with the SRK/T formula (P≤ 0.004) and significantly higher with the Hoffer-Q formula (P≤ 0.002). There was a negative correlation between the age of the patient and the APE of the SRK II formula (P=0.02). Moreover, the SRK/T, Holladay and Hoffer-Q formulae APEs were affected by the average k-readings (P=0.019, 0.005 and 0.035) respectively.
Conclusion: The SRK/T and Holladay I formulae were the most predictable formulae in IOL power calculation in pediatric eyes.
Keywords: intraocular lens, biometry formula, keratometric readings, axial length
Introduction
Obtaining favorable refractive outcome in pediatric biometry is a challenging task. Sources of error in pediatric biometry include short axial length (AL), steep cornea, shallow anterior chamber depth (ACD), dense cataract and dense vitreous, which may reduce ultrasound transmission.1 Measurements are also done under general anesthesia and in the supine position which may cause improper centration2 with inaccurate keratometric (K) readings.3 Moreover, cataract extraction with posterior capsulotomy and anterior vitrectomy may affect the effective lens position.2,5 The intraocular lens (IOL) power calculation formulae which are presently used are based on data from adult eyes, so refractive inconsistencies may occur when applied to the structurally different pediatric eyes.4,5,6
The purpose of the current study is to compare the accuracy of IOL power calculation formulae in a large cohort of children who underwent IOL implantation at Cairo University Children Hospital.
Materials and Methods
The study protocol was approved by the Cairo University institutional ethics committee/institutional review board. The collection of data followed the tenets of the Declaration of Helsinki. Written informed surgical consents were signed by all patients’ legal guardians, but informed consent for inclusion in the current study was waived because the risk to the patient was minimal and obtaining consent was impractical. There was no violation to the patient data confidentiality. Retrospective chart review was performed upon the medical records of all children ≤14 years old who underwent primary or secondary IOL implantation at Cairo University Children Hospital from January 2016 to December 2019. Patients with corneal scars, uveitis, persistent fetal vasculature (PFV), history of ocular trauma, congenital glaucoma, posterior lenticonus, and those with incomplete data were excluded from the study. Data collected included age at time of cataract surgery and IOL implantation, gender, laterality, past ocular history, AL, Keratometric (K) readings, implanted IOL power, absolute prediction error (APE) for SRK II, SRK/T, Holladay I and Hoffer-Q formulae and postoperative refraction at a two-month follow-up visit.
Biometry and Surgical Technique
Biometry was done under general anesthesia for all patients except 73 older patients who had preoperative outpatient optical biometry using a Zeiss IOLMaster® 500 (Carl Zeiss, Meditec AG, Germany). K-readings were obtained using Righton Retinomax K-Plus 2 handheld autokeratometer (Nikon, Tokyo, Japan) taking the average of 3 readings which varied by <1 diopter (D). AL was obtained by applanation A-scan ultrasound (Sonomed Pac Scan Plus 300AP+, Sonomed Escalon, New York, USA) taking the average of at least five readings which varied by ≤0.09 standard deviation (SD). The A-constant provided by the manufacturer was used. SRK II formula was used for IOL power calculation and the power was determined according to the age and status of the fellow eye. All patients underwent cataract extraction using a similar technique and AcrySof biconvex hydrophobic acrylic, IOL models MA60AC, SA60AT and SN60AT (Alcon, Texas, USA) were implanted. Postoperative cycloplegic refraction was performed at the two-month follow-up visit either using a retinoscope by a senior pediatric ophthalmologist or an autorefractometer in cooperative older children.
Calculation of Prediction Error
Predicted refraction for SRK II, SRK/T, Holladay I and Hoffer-Q formulae was calculated with the Sonomed PAC Scan Plus 300AP+ using the patient’s AL, K-readings and implanted IOL power. Postoperative refraction was converted to the spherical equivalent, calculated as sphere + cylinder/2. Prediction error (PE) was calculated as predicted refraction – absolute refraction. APE was calculated for each formula by subtracting the actual postoperative refraction from the predicted refraction using the absolute value of predicted refraction – actual refraction. The PE illustrates the direction of miscalculation, while the APE measures the overall predictive accuracy.
Subgroup analysis was performed according to the patients’ AL (≤19 mm, 19–25 mm and ≥25 mm); average-k readings (<46.5 D and ≥46.5 D); age (≤2 years, 2 to ≤5 years, 5 to ≤8 years and >8 years); and site of IOL implantation (IOL implanted in the bag and sulcus fixated IOL). For sulcus implanted IOLs, we adjusted the IOL power by reducing the IOL power based on the implanted IOL power as follows: We reduced the IOL power by 0.5 D for children with a predicted IOL power of <18 D. Those with a planned IOL power of 18 to 25 D, IOL power was reduced by at least 1 D; and for IOLs >25 D, power was reduced by 1.5 to 2 D.7 The PE for each group was divided into 4 levels: ≤0.5 D, >0.5 to ≤1D, >1 D to ≤2 D and >2.00 D.
Statistical Analysis
Data were coded and entered using Statistical Package for the Social Sciences (SPSS) version 26 (IBM Corp., Armonk, NY, USA). Data were summarized using mean, standard deviation, median and interquartile range in quantitative data and using frequency (count) and relative frequency (percentage) for categorical data. Data distribution was checked for normality. Comparisons between quantitative variables were made using the non-parametric Kruskal–Wallis and Mann–Whitney U-tests. Comparisons between different groups according to AL and age were done using Kruskal–Wallis test. For comparison of paired measurements within each patient the non-parametric Wilcoxon signed rank test was used. Correlations between quantitative variables were done using Spearman correlation coefficient. A generalized estimating equation was used to adjust for inter-eye correlation in bilateral cases. P-values less than 0.05 were considered as statistically significant.
Results
The study included 308 eyes of 255 patients with a mean age of 4.74 ± 3.19 years (range, 10 months–14 years). Ninety-nine patients were females. Right eye was involved in 125 eyes. The mean K-reading was 43.42 ± 3.57 D (range; 37.25 to 57.56 D), mean AL was 22.01 ± 1.93 mm (range, 17.45 to 30 mm) and mean power of implanted IOL was 23.48 ± 4.74 D (range, 6.50 to 30 D). A total of 151 eyes had the IOL implanted in the bag and 157 eyes had a sulcus fixated IOL. Table 1 summarizes the PE and APE of each formula. Subgroup analysis was performed to analyze the APE among patients with the IOL implanted in the bag versus those with the sulcus fixated IOL (Table 2).
 |
Table 1 The Illustration of Prediction Error and Absolute Prediction Error for Each Formula |
 |
Table 2 Subgroup Analysis Showing the Absolute Prediction Error (APE) for Each Formula in Diopters (D) Among Patients Who Had in the Bag Implanted Intraocular Lens (IOL) versus Those with Sulcus Implanted IOL |
There was a statistically significant negative correlation between the age of the patient and the APE of the SRK II formula (P=0.021) but not for the other formulae. The average K-reading showed a significant correlation with the APE of SRK/T, Holladay I and Hoffer-Q formulae (P= 0.019, 0.005 and 0.035) respectively. The AL showed no correlation with the APE of all formulae (Table 3). SRK II APE was affected only by the age of the patient (P= 0.021). However, other APEs of SRK/T, Holladay and Hoffer Q formulae were affected by other factors (Table 3). Tables 4 and 5 summarize the correlation between age, AL and K-readings and the APE of 4 formulae among patients with IOL implanted in the bag versus those with the sulcus implanted IOL.
 |
Table 3 Correlation Between the Age, Axial Length (AL), Average Keratometric (K) Readings and the Absolute Prediction Error (APE) for the 4 Formulae |
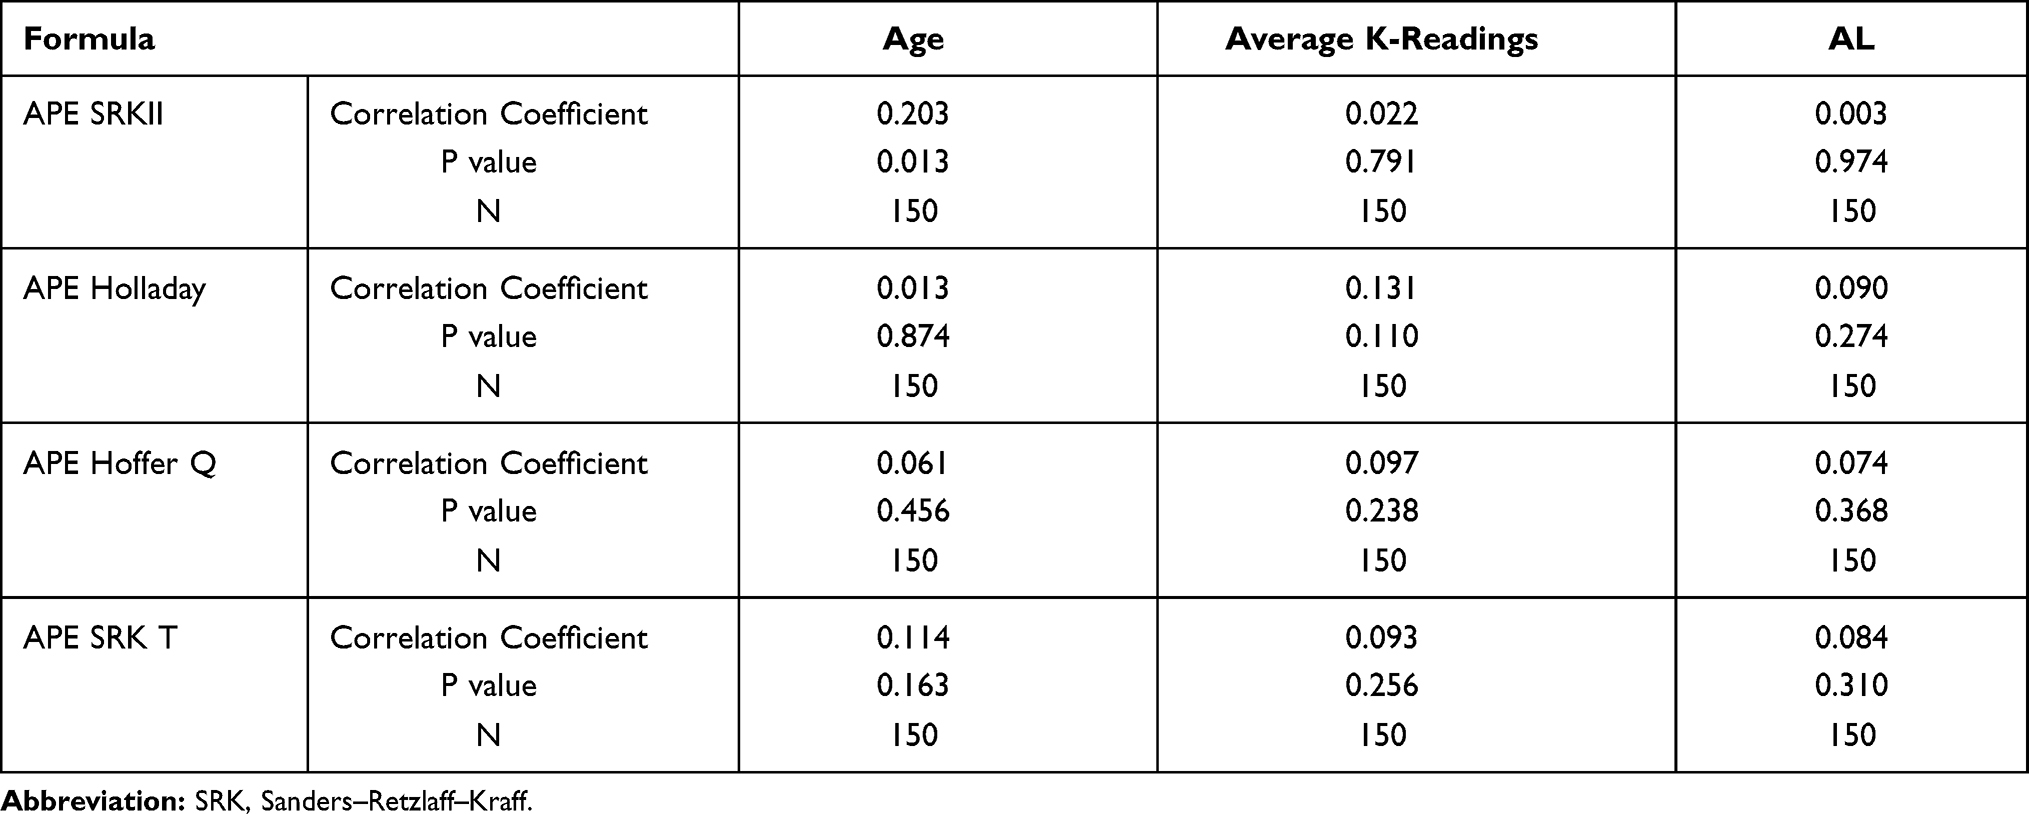 |
Table 4 Correlation Between the Age, Axial Length (AL), Average Keratometric (K) Readings and the Absolute Prediction Error (APE) for the 4 Formulae Among Patients Who Had in the Bag Implanted Intraocular Lens (IOL) |
 |
Table 5 Correlation Between the Age, Axial Length (AL), Average Keratometric (K) Readings and the Absolute Prediction Error (APE) for the 4 Formulae Among Patients Who Had Sulcus Implanted IOL |
The percentage of eyes with APE within 0.5 D was 27.7% (85 eyes), 32.2% (99 eyes), 30.6% (94 eyes) and 25.4% (78 eyes) with SRK-II, SRK/T, Holladay I and Hoffer-Q formulae, respectively. The percentage of eyes with APE ≥ 2D was 26.4% (81 eyes), 24.1% (74 eyes), 26.1% (80 eyes) and 29.6% (91 eyes) with SRK-II, SRK/T, Holladay I and Hoffer-Q formulae, respectively. APE was significantly lower with the SRK-T formula (P≤0.004) and significantly higher with the Hoffer-Q formula (P≤ 0.002) when compared to other formulae (Figure 1).
 |
Figure 1 Comparison between the absolute prediction error (APE) of SRK II, Holladay I, Hoffer Q and SRK/T formulae. |
A subgroup analysis of the patients according to the mean preoperative K-reading (<46.5 D or ≥46.5 D) was performed and showed that in patients with mean K-reading <46.5D, SRK/T showed better IOL power predictability than other formulae (P≤ 0.001). Hoffer-Q formula showed worse IOL power predictability compared to other formulae (P≤ 0.001) and the Holladay I formula showed better predictability than the SRK II formula (P=0.013). In patients with average K-reading ≥46.5D, there was no statistically significant difference in the predictability of different formulae (P≥ 0.117) except for the comparison between Holladay I and SRK II formulae (P=0.013) and the comparison between SRK/T and SRK II formulae (P=0.006) (Figure 2).
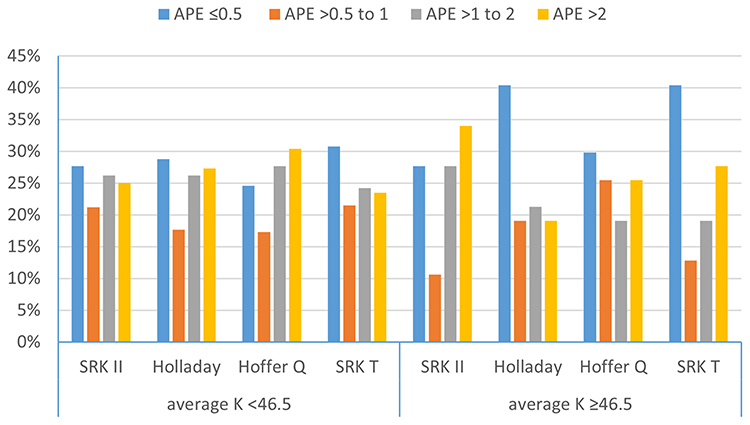 |
Figure 2 Comparison between the absolute prediction error (APE) of SRK II, Holladay I, Hoffer Q and SRK/T formulae in the subgroup of patients with mean preoperative keratometric (K) readings <46.5 diopter (D) and in those with mean preoperative K-reading ≥46.5 D. |
Patients were stratified according to the age at the time of surgery into 4 groups: ≤2 years, 2 to ≤5 years, 5 to ≤8 years and >8 years (Figure 3). Seventy-nine patients were ≤2 years at the time of surgery. The SRK/T and Holladay I formulae were significantly better than other formulae (P=0.079). In the group of patients with age 2 to ≤5 years at the time of surgery; the SRK/T formula showed better predictive value than other formulae (P=0.033) and the Hoffer-Q formula showed worse predictability than other formulae (P<0.001). In patients with age 5 to ≤8 years, the SRK/T formula showed better predictability than other formulae (P≤0.001) and the Hoffer-Q formula showed worse predictability than other formulae (P<0.002). In this group, the Holladay I formula showed better predictability than the SRKII formula (P=0.001). In patients with age >8 years, there was no statistically significant difference between the 4 formulae (P≥0.088).
 |
Figure 3 Comparison between the absolute prediction error (APE) of the SRK II, Holladay I, Hoffer Q and SRK/T formulae in different age groups. |
Another analysis was performed according to the preoperative mean AL (≤19, 19–25 and ≥25 mm) (Figure 4). In patients with AL ≤ 19 mm; the Hoffer-Q formula showed worse predictability than with other formulae (P≤0.005) except when compared to the SRK II formula (P= 0.134). In patients with AL 19–25 mm, the SRK/T formula showed better predictability than other formulae (P<0.001). Hoffer-Q formula showed worse predictability than other formulae (P<0.001). In patients with AL ≥ 25 mm, there was no statistically significant difference between all formulae.
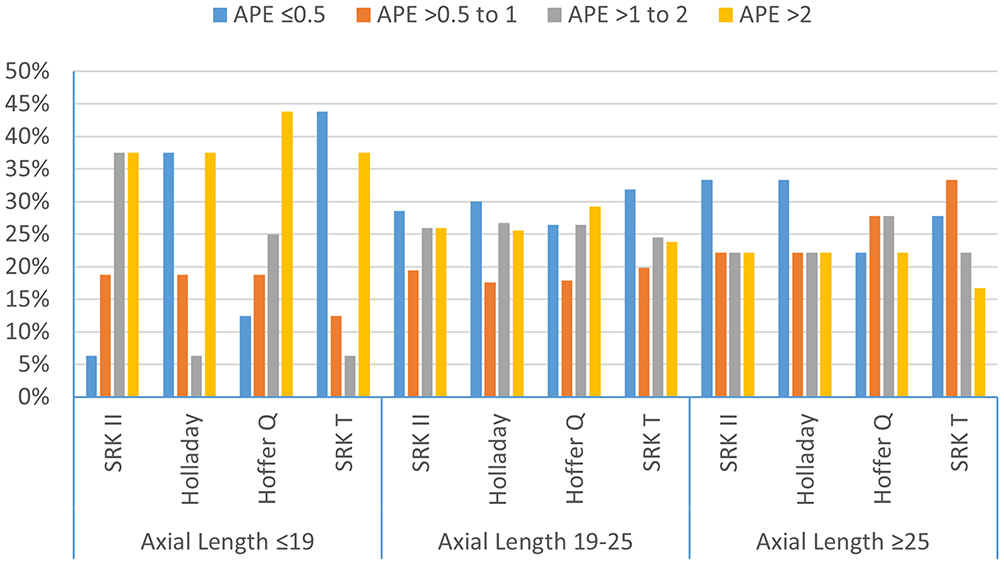 |
Figure 4 Analysis of the absolute prediction error (APE) of the SRK II, Holladay I, Hoffer Q and SRK/T formulae according to the preoperative axial length. |
Patients were further stratified according to the site of IOL implantation (Figure 5). Amongst patients with IOL implanted in the bag, the SRK/T formula showed better predictability than other formulae (P≤0.001) except when compared to Holladay I formula (P=0.053). Hoffer-Q formula showed worse predictability than other formulae (P<0.001) except when compared to SRK II formula (P=0.793). In patients with IOL fixated in the sulcus, the SRK/T formula showed better predictability than other formulae (P<0.001) except when compared to the SRK II formula (P=0.372). Hoffer-Q formula showed worse predictability than other formulae (P<0.001). In this group, the Holladay I formula showed better predictability than the SRK II formula (P=0.014).
 |
Figure 5 Analysis of the absolute prediction error (APE) of the SRK II, Holladay I, Hoffer Q and SRK/T formulae according to the site of intraocular lens implantation (IOL). |
Discussion
Biometry in the pediatric age group is a challenging undertaking because of the anatomical differences in comparison to adults. The Hoffer Q formula is considered to be more accurate in adult eyes with AL <22 mm.8 However, Gokce et al suggested that there is no significant difference between 7 investigated IOL formulae for short eyes in adults.9 Several studies have evaluated the predictability of these formulae in pediatric eyes. Tromans reported large postoperative refractive errors when adult IOL formulae were applied to children with AL <20 mm and in children younger than 3 years. However their sample size included only 52 eyes.10 Andreo et al retrospectively evaluated SRK II, SRK/T, Holladay I, and Hoffer-Q formulae in 43 eyes and reported no statistically significant difference between the 4 formulae. However, only 17 eyes with AL ≤22.0mm were included in their study.11 Neely et al reviewed the data of 101 eyes of 76 patients.12 They included 23 eyes of children ≤2 years. They found no significant association between age, AL, horizontal corneal diameter, and the APE. They concluded that SRKII, SRK T and Holladay I formulae had no significant difference. However, Hoffer Q formula was the most variable and the SRK II formula was the least variable among children with AL ≤19 mm. The APE of the Hoffer Q formula was significantly inversely associated with age, AL, and the corneal diameter. However, 37% of the patients in their study had posterior lenticonus, PFV and traumatic cataract, all of which were excluded in the current study. In the current study we have found a significant negative correlation between the age of the patient and APE of SRK/T formula but not Hoffer Q formula. On the other hand, Nihalani and VanderVeen did not find any correlation between the age and the PE of any of the formulae they evaluated (SRK II, SRK/T, Holladay I and Hoffer-Q). However, their study included only 22 patients with age ≤2 years.13 Trivedi et al reported that Holladay II formula had the least APE when compared to Holladay 1, Hoffer Q, and SRK/T formulae, especially in eyes with AL <22 mm. They also reported that predicted refraction was closer to the postoperative refraction in the no-capture group in comparison to the optic capture one.14 Kekunnaya et al evaluated the variability of SRK II, SRK/T, Holladay and Hoffer-Q formulae in 128 eyes with age ≤2 years old including only 15 eyes with AL <18 mm. They reported that SRK II was the least variable formula, while the Hoffer-Q was the most variable one, which is consistent with our results. They found no correlation between the age, AL, and mean K-readings with the APE of the SRK II formula. However, AL was inversely associated with APE of Hoffer Q and Holladay formulae. K readings were inversely associated with the APE of the SRK/T formula.15 In our study, there was a significant negative correlation between the age of the patient and the APE of the SRK II formula. Moreover, in the SRK-T, Holladay and Hoffer-Q formulae, APE was affected by the average k-readings. In all age groups, the SRK/T formula was significantly better except in the subgroup > 8 years. As a part of the infant aphakia treatment study, VanderVeen et al compared the predictability of Hoffer-Q, Holladay I, Holladay 2, SRK/T, and SRK II formulae in 43 eyes, including 23 eyes with AL <18 mm. The Hoffer Q formula had shown overcorrection in contrast to the SRK II formula. The mean PE was significantly associated with the AL except for the SRK II formula with eyes <18.0 mm, which had the largest prediction error. The Holladay 1 and SRK/T formulae gave the best results even with an optimized A constant, which is consistent with our results.16 Vasavada et al studied 117 eyes and 66 patients were ≤ 2 years. They compared the predictability of the SRK/T, Holladay II, and Holladay I, Hoffer-Q formulae. In eyes with an AL ≤20 mm, the SRK/T and Holladay II formulae were the least variable. The PE had shown overcorrections for all formulae. Upon using the personalized lens constant, this overcorrection decreased with more accurate results, except for the Hoffer Q formula.17 In the largest case series to date, Lee et al evaluated the SRK II, SRK/T and Hoffer-Q formulae in 481 eyes and found that the SRK II formula was the most predictable, while the Hoffer Q formula was the least predictable Age was significantly correlated with PE in all formulae. AL was significantly correlated with the PE of both SRK/T and Hoffer-Q formulae. These formulae caused overcorrections for patients with short AL. However, they did not specify the number of patients <2 years.18 A recent study by Li et al evaluated 377 eyes including 161 eyes <22.0 mm. They compared the SRK II, SRK/T, Hoffer-Q, Holladay I, T2, and Super formulae. Mean PE was positive with all formulae. SRK II formula showed significantly higher APE in contrast to Hoffer-Q and Holladay I formulae. They included different IOL types which may have resulted in difficult generation of optimized lens constants and they did not report the number of patients <2 years.19 In the current study we have found that all IOL power calculation formulae tend to be variable in pediatric eyes especially in children <2 years, with AL<19 mm and when K-readings are >46.5 D. SRK/T formula was the best in our series with comparable results to Holladay I formula. The Hoffer-Q was the worst which is consistent with previous studies. Hoffer-Q formula determines the personalized ACD by considering both AL and K-readings. In pediatric eyes the ratio of anterior and posterior segments is different from that of adults, as the anterior segment is disproportionately large in infancy. Using empirically modified personalized ACD strategy to improve refractive results in adult eyes might be inappropriate for pediatric eyes. In a study done by Hoffer, using a personalized ACD with the Hoffer-Q formula yielded less accurate results at extremes of AL. In addition, the Hoffer-Q formula requires the measurement of the surgeon factor which may show greater variations in eyes with short axial lengths and smaller white-to-white diameter.19 This suggests that factors such as the effect of the dynamics of shallower AC in pediatric eyes, the variety of implantation sites, and the postoperative dynamics attributable to vitreous pressure, haptic angulations, posterior capsule contraction, and the frequent proliferation of retained lens material could affect the postoperative refraction. These factors are not accounted for by current available formulae.
The current study is limited by its retrospective design, using contact rather than immersion A-scan biometry, and inclusion of cases with sulcus implanted IOL even though we performed a subgroup analysis to compare the predictability of different formulae according to site of IOL implantation. Surgeries and postoperative refractions were performed by multiple ophthalmologists who were, nevertheless, skilled pediatric ophthalmologists. Another limitation is that we did not evaluate newer formulae such as the T2, Holladay II, or Barrett Universal formulae because they were not included in the software of the biometry instrument.
In conclusion, all IOL power calculation formulae tend to be variable in children especially in children <2 years, with AL <19 mm and K readings >46.5 D. The SRK/T formula was the best in our series with comparable results to Holladay formula. Further research may help in developing a new formula specific for paediatric eyes or even modifying the current IOL formulae to be more accurate in pediatric eyes.
What was known:
- Obtaining a favorable refractive outcome in pediatric biometry is a challenging task
- There is no consensus on which formula is the most accurate in pediatric eyes
What the paper adds:
- Absolute prediction error is significantly lower with the SRK/T formula and significantly higher with the Hoffer-Q formula
- There was a negative correlation between the age of the patient and the absolute prediction error of the SRK II formula
- The SRK/T, Holladay and Hoffer-Q formulae absolute prediction errors were affected by the average k-readings.
Funding
No financial support.
Disclosure
The abstract of this paper was presented at the American Association of Pediatric Ophthalmology and Strabismus Conference 2019 as a poster presentation with interim findings. The poster’s abstract was published in “Poster Abstracts” in the Journal of American Association of Pediatric Ophthalmology and Strabismus (doi: https://doi.org/10.1016/j.jaapos.2019.08.198). The authors report no conflicts of interest in this work.
References
1. Vanderveen D. Selecting an intraocular lens power. In: Selecting an Intraocular Lens Power. 2017.
2. Moore DB, Ben Zion I, Neely DE, et al. Accuracy of biometry in pediatric cataract extraction with primary intraocular lens implantation. J Cataract Refract Surg. 2008;34(11):1940–1947. doi:10.1016/j.jcrs.2008.07.019
3. Mittelviefhaus H, Gentner C. [Errors in keratometry for intraocular lens implantation in infants]. Ophthalmologe. 2000;97(3):186–188. doi:10.1007/s003470050511
4. Lambert SR, Lynn MJ, DuBois LG, Cotsonis GA, Hartmann EE, Wilson ME. Axial elongation following cataract surgery during the first year of life in the infant aphakia treatment study. Invest Ophthalmol Vis Sci. 2012;53(12):7539–7545. doi:10.1167/iovs.12-10285
5. Eibschitz-Tsimhoni M, Archer SM, Del Monte MA. Intraocular lens power calculation in children. Surv Ophthalmol. 2007;52(5):474–482. doi:10.1016/j.survophthal.2007.06.010
6. Hoevenaars NE, Polling JR, Wolfs RC. Prediction error and myopic shift after intraocular lens implantation in paediatric cataract patients. Br J Ophthalmol. 2011;95(8):1082–1085. doi:10.1136/bjo.2010.183566
7. Dubey R, Birchall W, Grigg J. Improved refractive outcome for ciliary sulcus-implanted intraocular lenses. Ophthalmology. 2012;119(2):261–265. doi:10.1016/j.ophtha.2011.07.050
8. Gavin EA, Hammond CJ. Intraocular lens power calculation in short eyes. Eye (Lond). 2008;22(7):935–938. doi:10.1038/sj.eye.6702774
9. Gökce SE, Zeiter JH, Weikert MP, Koch DD, Hill W, Wang L. Intraocular lens power calculations in short eyes using 7 formulas. J Cataract Refract Surg. 2017;43(7):892–897. doi:10.1016/j.jcrs.2017.07.004
10. Tromans C, Haigh P, Biswas S, Lloyd I. Accuracy of intraocular lens power calculation in pediatric cataract surgery. Br J Ophthalmol. 2001;85:939–941. doi:10.1136/bjo.85.8.939
11. Andreo LK, Wilson ME, Saunders RA. Predictive value of regression and theoretical IOL formulas in pediatric intraocular lens implantation. J Pediatr Ophthalmol Strabismus. 1997;34(4):240–243. doi:10.3928/0191-3913-19970701-12
12. Neely DE, Plager DA, Borger SM, Golub RL. Accuracy of intraocular lens calculations in infants and children undergoing cataract surgery. J Aapos. 2005;9(2):160–165. doi:10.1016/j.jaapos.2004.12.010
13. Nihalani BR, VanderVeen DK. Comparison of intraocular lens power calculation formulae in pediatric eyes. Ophthalmology. 2010;117(8):1493–1499. doi:10.1016/j.ophtha.2009.12.031
14. Trivedi RH, Wilson ME, Reardon W. Accuracy of the holladay 2 intraocular lens formula for pediatric eyes in the absence of preoperative refraction. J Cataract Refract Surg. 2011;37(7):1239–1243. doi:10.1016/j.jcrs.2011.01.021
15. Kekunnaya R, Gupta A, Sachdeva V, Rao HL, Vaddavalli PK, Om Prakash V. Accuracy of intraocular lens power calculation formulae in children less than two years. Am J Ophthalmol. 2012;154(1):13–19.e12. doi:10.1016/j.ajo.2011.11.031
16. Vanderveen DK, Trivedi RH, Nizam A, Lynn MJ, Lambert SR. Predictability of intraocular lens power calculation formulae in infantile eyes with unilateral congenital cataract: results from the infant aphakia treatment study. Am J Ophthalmol. 2013;156(6):1252–1260.e1252. doi:10.1016/j.ajo.2013.07.014
17. Vasavada V, Shah SK, Vasavada VA, et al. Comparison of IOL power calculation formulae for pediatric eyes. Eye (Lond). 2016;30(9):1242–1250. doi:10.1038/eye.2016.171
18. Lee BJ, Lee SM, Kim JH, Yu YS. Predictability of formulae for intraocular lens power calculation according to the age of implantation in paediatric cataract. Br J Ophthalmol. 2019;103(1):106–111. doi:10.1136/bjophthalmol-2017-311706
19. Li J, Liu Z, Wang R, et al. Accuracy of intraocular lens power calculations in paediatric eyes. Clin Experiment Ophthalmol. 2020;48(3):301–310. doi:10.1111/ceo.13701
 © 2021 The Author(s). This work is published and licensed by Dove Medical Press Limited. The
full terms of this license are available at https://www.dovepress.com/terms
and incorporate the Creative Commons Attribution
- Non Commercial (unported, 3.0) License.
By accessing the work you hereby accept the Terms. Non-commercial uses of the work are permitted
without any further permission from Dove Medical Press Limited, provided the work is properly
attributed. For permission for commercial use of this work, please see paragraphs 4.2 and 5 of our Terms.
© 2021 The Author(s). This work is published and licensed by Dove Medical Press Limited. The
full terms of this license are available at https://www.dovepress.com/terms
and incorporate the Creative Commons Attribution
- Non Commercial (unported, 3.0) License.
By accessing the work you hereby accept the Terms. Non-commercial uses of the work are permitted
without any further permission from Dove Medical Press Limited, provided the work is properly
attributed. For permission for commercial use of this work, please see paragraphs 4.2 and 5 of our Terms.