Back to Journals » Clinical Ophthalmology » Volume 19
Predictive Factors for Macular Atrophy in Patients with Treated Myopic Macular Neovascularization
Authors Ferreira AM ![]() , Coelho-Costa I
, Coelho-Costa I ![]() , Beato JN, Penas S, Rocha-Sousa A
, Beato JN, Penas S, Rocha-Sousa A ![]() , Falcão M
, Falcão M ![]() , Carneiro Â
, Carneiro Â
Received 30 September 2025
Accepted for publication 19 November 2025
Published 25 December 2025 Volume 2025:19 Pages 4901—4912
DOI https://doi.org/10.2147/OPTH.S566595
Checked for plagiarism Yes
Review by Single anonymous peer review
Peer reviewer comments 2
Editor who approved publication: Dr Yousef Fouad
Ana Margarida Ferreira,1 Inês Coelho-Costa,1 João Nuno Beato,1,2 Susana Penas,1,2 Amândio Rocha-Sousa,1,2 Manuel Falcão,1,2 Ângela Carneiro1,2
1Department of Ophthalmology, Local Health Unit of São João, Porto, Portugal; 2Department of Surgery and Physiology, Faculty of Medicine of University of Porto, Porto, Portugal
Correspondence: Ana Margarida Ferreira, Department of Ophthalmology, Local Health Unit of São João, Avenida Prof. Hernâni Monteiro, 4202 – 451 Porto, Portugal, Tel +351 912 605 085, Fax +351 225 512 100, Email [email protected]
Introduction: Macular atrophy represents an end-stage of myopic maculopathy. This study aims to identify predictive factors for atrophy growth in patients with treated myopic macular neovascularization (mMNV).
Methods: Retrospective study including 98 eyes from 83 patients registered in the national database of retinal diseases and followed and treated for mMNV for at least 2-years at our tertiary center. Our primary outcomes were the increase in the chorioretinal atrophic area (CRA) and final best corrected visual acuity (fBCVA).
Results: Most patients (n=55, 56.1%) successfully stopped treatment after 3+pro re nata (3+PRN) (mean 6.8± 5.3 intravitreal injections, IVI), while 27 patients (27.6%) required uninterrupted treat and extend (T&E) regimen (mean 27± 15.46 IVI). BCVA improved from 47.18± 23.06 to 58.66± 21.27 ETDRS letters after mMNV treatment, over a mean of 6.04± 4.1 years [2– 15]. There was a 16.9% larger final mean CRA and a mean growth of 0.48± 1.17mm2/year, significantly associated with worse fBCVA in the subfoveal atrophy group (39.10± 28.08, p< 0.001) and negatively correlated with the initial subfoveal choroidal thickness (SCT) (r=− 0.31, p=0.004). The baseline CRA was the major determinant of a larger final CRA (β=0.90, p< 0.001). Patients under uninterrupted T&E showed a higher CRA growth rate (0.95± 1.87mm2/year, p=0.0076).
Conclusion: Macular atrophy after mMNV leads to irreversible visual loss. The baseline atrophic area predicts final macular atrophy. Initial SCT and the implemented treatment regimen (especially with a higher number of IVI) influence atrophy growth, although not significant in the multivariable model.
Keywords: myopic macular neovascularization, anti-VEGF, macular atrophy
Introduction
Pathologic myopia is defined as the presence of a spherical equivalent > −6.0 diopters (D), an excessive elongation of the axial length of the eye (>26.5 mm) in the presence of structural changes in the posterior segment of the eye such as posterior staphyloma and myopic maculopathy (grade >1 for atrophic, tractional, or neovascular components of the ATN grading and classification system or equal to category 2 in the META-analysis for Pathologic Myopia [META-PM] classification).1,2
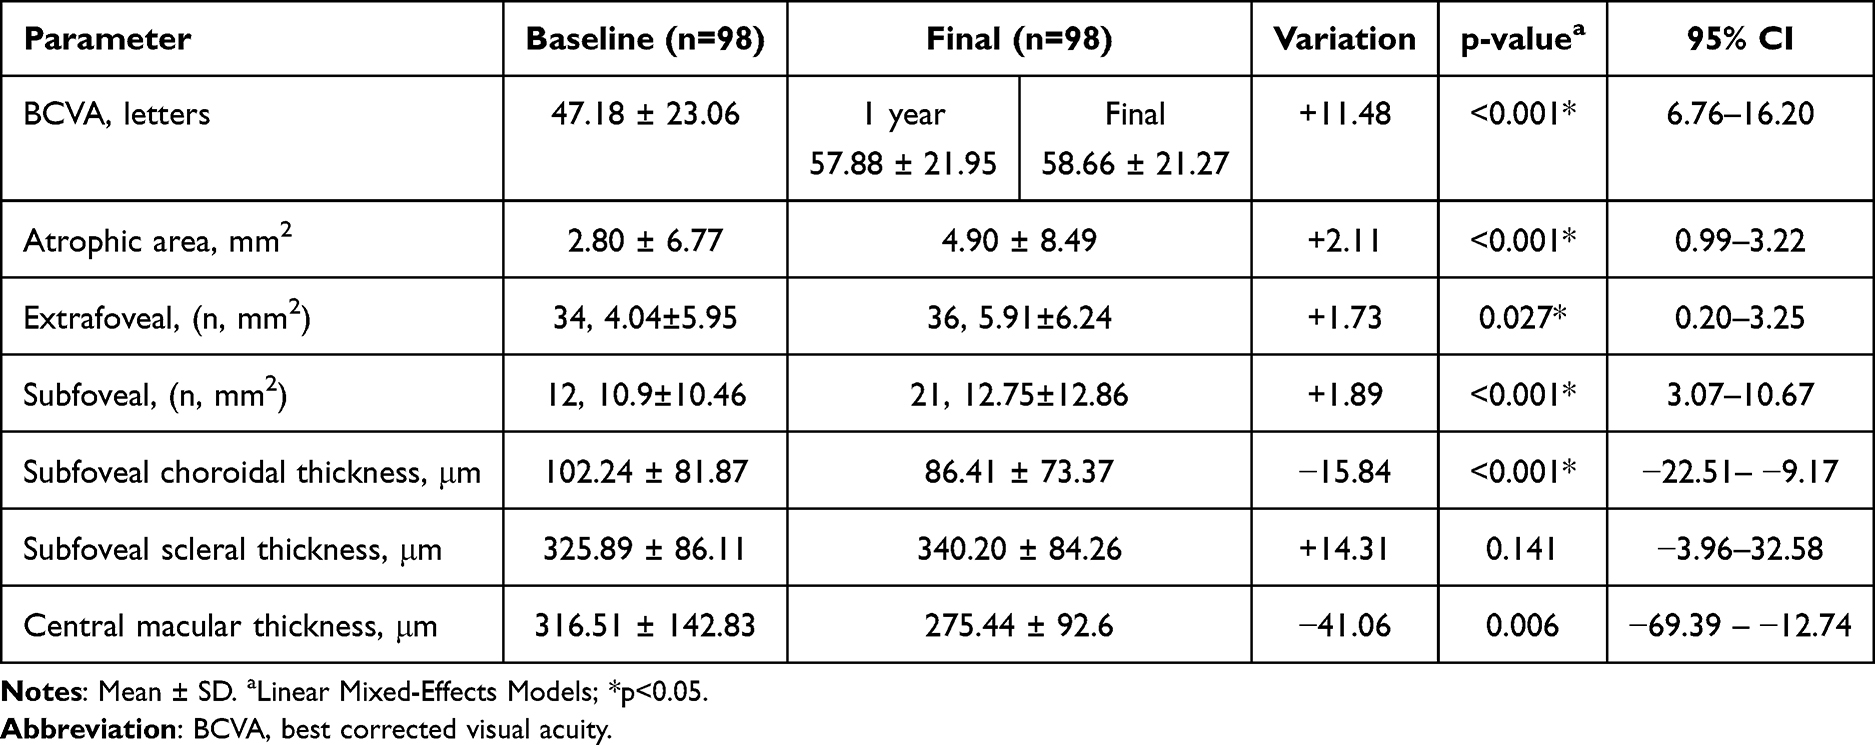 |
Table 1 Linear Mixed-Effects Models of BCVA, Atrophic Area, Subfoveal Choroidal Thickness, Subfoveal Scleral Thickness, and Central Macular Thickness Between Baseline and Final Visit |
Macular atrophy represents an irreversible end-stage of myopic maculopathy, resulting in irreversible visual loss.3 It represents a major cause of vision loss and legal blindness in young and active population.4 Macular atrophy can occur both because of continuous elongation of the globe, thus a primary consequence of myopic choroidopathy, or related to scarring after the development of myopic macular neovascularization (mMNV).5
Continuous scleral distension on the posterior pole with progressive choroidal thinning and attenuation ultimately compromises oxygen and nutrient delivery to the retinal pigment epithelium (RPE) cells, with photoreceptor loss, reduced retinal thickness, and central vision loss.6 Several studies have recently suggested the importance of choroidal vascular evaluation to monitor the progression of pathological myopia, including macular atrophy.7,8
Several treatment approaches have been studied for mMNV, with intravitreal injections (IVI) of anti-vascular endothelium growth factor (anti-VEGF) therapy being considered the gold standard treatment for mMNV. The number of intravitreal injections administered in patients with myopic MNV was identified as a potential factor associated with the enlargement of the atrophic area.9 There are no current treatment options for macular atrophy, and the increase in chorioretinal atrophic areas over time ultimately leads to progressive visual loss.3
Our primary purpose was to analyze several clinical factors as potential biomarkers of atrophy growth in patients with myopic MNV.
Materials and Methods
Retrospective, single center, observational study that included all patients registered in the national database of retinal diseases (Retina.com.pt) with the diagnosis of myopic macular neovascularization, followed for at least a 2-year period and treated in the Ophthalmology Department of Local Healthcare Unit of São João. For each patient, the follow-up length considered started on the first visit to the medical retina clinic in which the myopic MNV diagnosis was established and characterized using multimodal retinal imaging (first visit from January 2010 until June 2022) and ended in June 2024. The final visit was defined as the most recent follow-up visit with available structural and functional data after a minimum of 2 years of observation. Follow-up intervals were not standardized due to the retrospective design but reflected routine clinical practice. To account for the possible influence of variable follow-up durations in the analysis, the follow-up time was included as a covariate in the regression analyses, and the rate of change was calculated per unit time. All patients included in the retina.pt national registry provided written informed consent at the time of enrollment. The study adhered to tenets of the Declaration of Helsinki. All data was anonymized and handled in accordance with data protection regulations to ensure patient confidentiality.
Myopic macular neovascularization was diagnosed by one of the three retinal consultants of our department (with double confirmation only applied in the cases with diagnostic uncertainty). The diagnosis was based on the presence of several characteristic findings on multimodal retinal imaging. The spectral domain-optical coherence tomography (OCT) demonstrating the presence of an hyperreflective lesions with fuzzy borders at the retinal pigmented epithelium (RPE), ellipsoid, and external limiting membrane (ELM), typically the predominantly classic type of membranes (although the occult membranes can also occur), that could also be associated with subretinal hemorrhage, intraretinal and subretinal fluid. The OCT angiography (OCTA) demonstrating the presence of an active MNV with a lacy wheel pattern, numerous tiny capillaries, a widely anastomosed network, and a perilesional hypointense. The fluorescein angiography (FA) was only performed in the most dubious cases, demonstrating the presence of a well-defined hyperfluorescent lesion (often with a hypofluorescent rim of pigmentation) in the early phase with progressive leakage of dye in the late phase of the angiogram. The patients’ symptoms were also evaluated, including the complaint of metamorphopsia and scotoma.
Eyes demonstrating extensive subfoveal fibrosis or extensive subfoveal atrophy (more than 2-disc diameters fovea centered) were excluded from analysis due to the fibrotic scar obscuring atrophy margins on imaging (which impeded reproducible quantification of atrophic progression), and the markedly poor baseline visual acuity introducing a floor effect for meaningful visual outcome assessment. Patients with nonexudative neovascular membranes were also excluded due to a lack of treatment indication. Patients who underwent photodynamic therapy (PDT), including both primary and adjuvant therapy, were also excluded.
Demographic data (age, sex, spherical equivalent (SE) in diopters, and total follow-up time) were collected. Since the axial length measurement was unavailable in all patients, this variable was not analyzed. All patients were submitted to a complete multimodal ophthalmologic evaluation in all follow-up visits, including best corrected visual acuity evaluation (BCVA, in ETDRS letters, measured on ETDRS chart after refraction), dilated fundus examination, color fundus photography, OCT examination including enhanced depth imaging (EDI) acquisition, OCTA and fundus autofluorescence (FAF).
In the OCT examination, central macular thickness (CMT, average thickness of the central 1 mm area of the macula, measured from the internal limiting membrane to the RPE, in μm), subfoveal choroidal thickness (SCT, measured from the Bruch’s membrane to the sclerochoroidal interface at fovea, in μm) and subfoveal scleral thickness (measured from the outer scleral border to the choroid/sclera interface, in μm) were determined.10–13 The presence of a scleral perforating vessel (which appear in OCT as low-reflection, lumen-like structures, often linear or wavy, extending from the sclera through the choroid toward the retina), the presence of lacquer cracks (which represent breaks in the Bruch’s membrane (BM), identified in OCT examination as hyperreflective lines within an intact RPE-Bruch’s membrane complex, with an associated thinner choroid and acoustic shadows) and the presence of a dome-shaped macula (defined as a convex anterior protrusion of the macula in both vertical and horizontal lines of OCT).14
Macular atrophy status of each study eye was determined at baseline and at each follow-up visit (every 3–6 months, until the most recent available follow-up visit that corresponded to the longest documented observation period for each eye, with a minimum of 2 years), defining the eyes without macular atrophy and the eyes with subfoveal (involving central 1-mm diameter region centered on the foveal avascular zone) or extrafoveal atrophy (outside the foveal area) (both qualitative – presence or absence of atrophy –, and quantitative evaluation, in mm2) using FAF.15 FAF images were obtained with a Spectralis HRA+OCT (Heidelberg Engineering, Germany) and manually evaluated by two independent and graders, blinded to clinical data, using the Heidelberg Eye Explorer software. Manual delineation and measurement of the atrophic areas was performed using the region overlay tool of the Heidelberg software (reported in mm2) within the macular region (6×6 mm centered on the fovea). Inter-reader agreement for the atrophic area measurements was evaluated (Cohen’s kappa coefficient). To evaluate intra-reader reproducibility, the same grader re-measured the atrophic areas after a 4-week interval, with intra-class correlation (ICC) calculated for consistency. Values >0.75 indicated a good agreement level. For clarification, patients with extrafoveal atrophy represent patients with macular patchy atrophy outside the foveal area. Chorioretinal atrophy (CRA) was defined as RPE attenuation and atrophy, presenting as hypoautofluorescent areas in FAF images.2,16 Our analysis focused on the total CRA, which included both primary atrophy (pre-existing atrophic areas) and secondary atrophy developing over or adjacent to the previous CNVM lesion. The annual CRA growth rate was estimated by dividing the change in CRA by the total follow-up time, representing an average rate of progression rather than a point-to-point linear model. Final atrophic area was defined as the sum of all chorioretinal atrophic patches within a 6×6-mm macular field centered on the fovea at the last follow-up. Subfoveal atrophy was defined as CRA involving the central 1-mm ETDRS subfield; lesions outside this zone were classified as extrafoveal.
Regarding treatment of active myopic MNV with intravitreal injections of anti-VEGF agents, we considered 3 different groups: patients that received a loading dose (3 IVI) + pro re nata (PRN) treatment in whom it was possible to stop treatment due to effective control of the neovascular membrane activity (group A), patients that required continuous treat and extend (T&E) anti-VEGF treatment for achieving disease control (group B) and patients with reactivation of the mMNV after treatment suspension that needed reinstitution of treatment over the follow-up period (group C).
Our primary outcome was to determine whether there was an increase in macular chorioretinal atrophic area (both subfoveal and extrafoveal) over time, with associated visual loss, and to what extent there may be clinical factors and biomarkers predicting macular atrophy growth in patients with myopic macular neovascularization over time.
Statistical Analysis
Kolmogorov–Smirnov and Shapiro–Wilk tests were used to assess whether each variable followed a normal distribution. Normally distributed data is reported as mean and standard deviation (SD) while non-normally distributed data is reported as median and interquartile range (IQR). Proportions are reported as absolute number and percentage.
Prior to the predictive analysis, a descriptive longitudinal evaluation was performed comparing baseline and final measurements. For each covariate (BCVA, atrophy area, choroidal thickness, scleral thickness, and central macular thickness), a linear mixed-effects model was fitted with time (baseline vs final) as a fixed effect and a random intercept for patient ID, estimated by maximum likelihood and reported as the estimated mean variation (β for Time) with 95% confidence intervals (CI) and two-sided p-values.
For cross‐sectional comparisons regarding the atrophic status at the final visit, linear mixed-effects models were fitted comparing no atrophy, extrafoveal and subfoveal (treated as a categorical factor and representing the fixed effect); for each covariate (final atrophy area, final BCVA, initial subfoveal choroidal thickness, age, spherical equivalent) we reported pairwise contrasts as β differences with 95% CI and two-sided p-values.
Treatment regimens were compared using separate linear mixed-effects models for each variable (number of intravitreal injections, annual atrophy growth rate and final BCVA) defining treatment regimen as a categorical fixed effect and a random intercept for patient ID; results were reported as pairwise differences with 95% CI and two-sided p-values. The most important difference regarding the 3 treatment regimens relies on the number of injections in each group, a parameter included in this analysis to properly frame the burden of the implemented treatment. The atrophy growth rate and BCVA were included as they are the most relevant predictive biomarkers later included in the predictive model.
All linear mixed-effects models were fitted using a random intercept for patient ID to account for within-subject (two-eyes-per-patient) correlation.
Variables assessed as potential predictors associated with final macular atrophy comprised initial and final subfoveal choroidal thickness, initial subfoveal scleral thickness, initial atrophic area, age, SE, the presence of lacquer cracks and perforating scleral vessels, initial and final CMT. Variables assessed as potential predictors associated with final BCVA included final atrophy area, baseline BCVA and 1-year visit BCVA.
Collinearity was assessed before building multivariate models by calculating correlation coefficients (Pearson for normally distributed variables or Spearman for data deviated from normality) and identifying highly correlated variables (r>0.8). In case of strong correlation, the variable with the greater clinical relevance or higher statistical significance in univariate analysis was selected for inclusion in the multivariable analysis, to avoid multicollinearity issues.
Linear mixed-effects models were constructed to evaluate predictors for the continuous outcomes of interest, specifically the final macular atrophic area (mm2) and the final BCVA (ETDRS letters). Fixed effects for final macular atrophy included initial atrophic area, baseline and final choroidal thickness. Fixed effects for final BCVA included baseline visual acuity, baseline and final choroidal thickness, baseline and final atrophy area, age, baseline central macular thickness, and BCVA at 1 year. Patient identifier was included as a random effect to account for potential clustering of eyes within patients. Model parameters were estimated using maximum likelihood, and regression coefficients with standard errors, z-values, and 95% CI were reported. Statistical significance was defined as a two-sided p-value < 0.05.
A correlation between final chorioretinal atrophic area and baseline subfoveal choroidal thickness was performed, after aggregating to the patient level (mean across eyes). Pearson’s r and Spearman’s ρ are reported. As a sensitivity analysis, a generalized estimating equations (GEE) was fitted at the eye level with patient as the clustering unit; with standardized variables, the GEE slope approximates the correlation coefficient while using cluster-robust inference.
Statistical analysis was done using the IBM SPSS® software (version 30.0, Chicago, IL).
Results
Ninety-eight eyes from 83 white Portuguese patients with myopic MNV monitored and treated at our tertiary center were included. The average age at the time of diagnosis was 54.99 ±13.97 years old, with 71 (85.5%) female patients. The mean spherical equivalent was −12.78 ± 4.70 diopters. Axial length measurement was only available in 16 eyes (16.3% of the total cohort), and these patients presented a median of 29.74 mm (IQR 3.23, range 23.42–33.19). The mean total follow-up time was 6.04 ± 4.1 years (range 2–15 years). All myopic MNV lesions in study eyes were subfoveal and type 2 (classic), as confirmed by multimodal imaging (OCT/OCTA ± FA). Three eyes were identified to have dome-shaped (3.06%).
Anatomical and Functional Longitudinal Assessment
Linear mixed-effects models comparing baseline and final measurements showed that best-corrected visual acuity (BCVA) significantly improved from baseline to final visit (β= +11.5, p<0.001), increasing from 47.18 ± 23.06 to 57.88 ± 21.95 letters (p<0.001) one year after the diagnosis and to 58.66 ± 21.27 letters (p<0.001) at the final and most recent visit (during 2024), over a mean 6-year follow-up period. Overall, 42 eyes (42.9%) achieved a ≥15-letter (≥3-line) improvement, 38 eyes (38.8%) showed stable BCVA (change <3 lines), and 18 eyes (18.4%) experienced a ≥3-line loss at the final follow-up (mean 6.0 ± 4.1 years).
There was a 9.2% increase in the number of patients with subfoveal macular atrophy (12 vs 21 patients) and a final mean subfoveal atrophic area 16.9% larger (β=+2.1 mm2, 10.9±14.23 vs 12.75±12.86 mm2, p<0.001, 95% CI 0.99–3.22), when compared to the baseline evaluation.
Central macular thickness also decreased significantly over time (β =–41.1 µm, p = 0.004). No significant change was observed in scleral thickness (p = 0.125). Subfoveal choroidal thickness significantly decreased over the study time (102.24 ± 81.87 vs 86.41 ± 73.37, β=–15.8 µm, p<0.001). These results indicate progressive structural changes in the posterior pole.
We determined a mean growth of 0.48±1.17 mm2 in the atrophic area per year (95% CI 0.24–0.71). The atrophy annual growth rate presented a significant negative correlation with the initial subfoveal choroidal thickness value (r=−0.31, 95% CI −0.49 to −0.10, p=0.004). Table 1 provides clinical data regarding the variation of multiple functional and structural variables between baseline and final visit.
In our cohort, all new final subfoveal cases (n=9) appear to have arisen from eyes that already had atrophy at baseline (most likely evolution of extrafoveal to subfoveal atrophy). In eyes without atrophy at baseline (n=52 at-risk eyes), 11 developed extrafoveal macular atrophy during follow-up, yielding a cumulative incidence of 21.2% (11/52) and an incidence rate of 3.36 per 100 eye-years (95% CI, 1.68–6.02).
At the final visit, comparing no atrophy vs extrafoveal vs subfoveal groups, using linear mixed-effects models (random intercept for patient ID), we determined a higher atrophy area in the subfoveal group, comparing to the extrafoveal (β=+6.84 mm2, 95% CI 4.47–10.73; p<0.001). BCVA was similar between extrafoveal and no atrophy groups (β=−2.35, 95% CI −10.88 to 5.83; p=0.55) but markedly worse in subfoveal vs no atrophy (β=−27.03, −37.05 to −17.01; p<0.001) and vs extrafoveal (β=−26, 95% CI −34.54 to −14.48; p<0.001). There was a statistically significant lower initial subfoveal choroidal thickness measurement in the group with subfoveal vs extrafoveal (β=−50.29 µm, 95% CI −72.97 to −16.59; p=0.0019). Age was slightly higher but not significantly different in subfoveal group (p=0.14); spherical equivalent did not differ across groups (p>0.52) (Table 2). A subgroup analysis of BCVA specifically in patients who developed macular atrophy during follow-up (n=9 new final subfoveal cases) demonstrated no significant differences in baseline vs final BCVA (35±27.5 vs 39.1±28.1 ETDRS letters, 95% CI −5.13 to 17.22, p=0.289). Fourteen (66.7%) eyes with subfoveal scarring presented poor vision (≤55 ETDRS letters) at final follow-up.
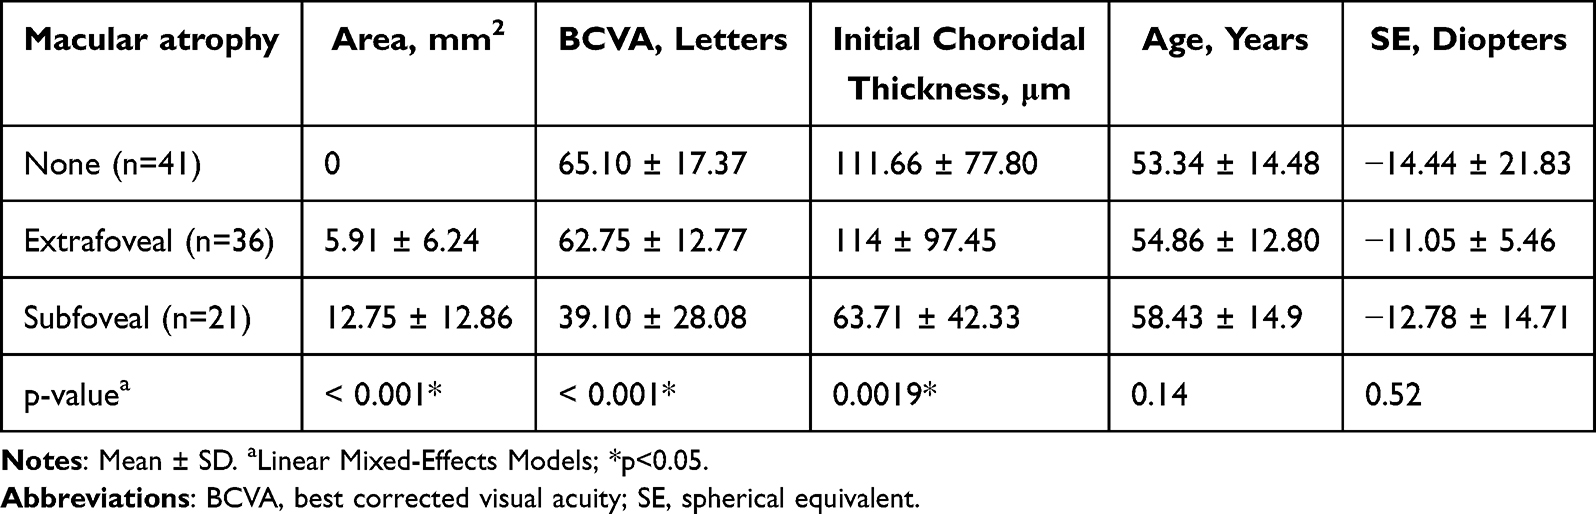 |
Table 2 Final Macular Atrophy Classification and Subgroup Cross-Sectional Analysis |
Treatment Regimen
Most patients (n=55, 56.1%) successfully stopped treatment after an initial 3+PRN regimen (group A with a mean total of 6.8±5.3 anti-VEGF IVI), 27 patients (27.6%) required continuous treat and extend (T&E) regimen (group B with a mean total of 27±15.46 IVI) and 16 patients (16.3%) required reinstitution of treatment due to myopic MNV reactivation after an initial attempt for suspension over the follow-up period (group C with a mean total of 12.88±8.48 IVI). Patients under continuous T&E regiment (group B) required markedly more IV injections than the other regimens (β=+20.2; 95% CI 11.81–21.79; p<0.001 for group A and β=−14.12; 95% CI −17.53 to −4.60; p<0.001 for group C). The most widely used anti-VEGF agent was Bevacizumab (mean total 8.52±8.12 IVI), followed by Aflibercept (mean total 2.29±6.59 IVI) and Ranibizumab (mean total 1.48±7.11 IVI). Patients under continuous T&E regimen, ultimately received a higher number of IVI, presented a statistically significant higher atrophy area growth rate per year when compared to other treatment regimens (atrophy growth rate 0.95±1.87mm2/year, β=+0.7 and β=+0.5, p=0.0076). The implemented treatment regimen did not show statistically significant differences regarding BCVA at the final visit (p=0.78) (Table 3). There were no significant correlations between the anti-VEGF agent used and both final BCVA or atrophic area measurements.
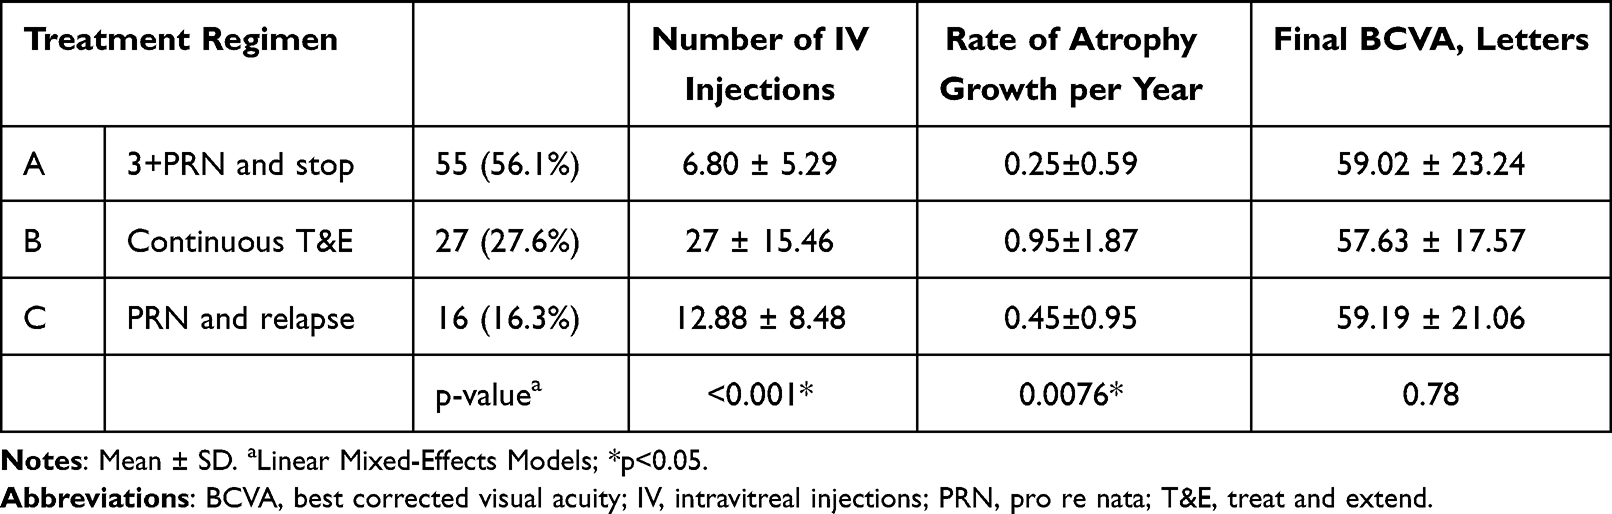 |
Table 3 Treatment Regimen Characterization and Subgroup Analysis |
Predictive Biomarkers for Final Atrophy Area and Final BCVA
Table 4 presents the linear mixed-effects models for potential predictors of final atrophy area and final BCVA. Among 83 patients, baseline subfoveal choroidal thickness correlated inversely with final chorioretinal atrophic area (patient-level aggregation across eyes: Pearson r = −0.31, 95% CI −0.49 to −0.10, p = 0.004; Spearman ρ = −0.39, p = 0.00029), indicating that thinner baseline choroid was associated with greater final atrophy; a clustered eye-level GEE using standardized variables confirmed a similar association (β_z = −0.31, 95% CI −0.49 to −0.14, p = 0.00053) (Figure 1). Older age was associated with macular choroidal thinning but not with the progression of atrophy. The presence of lacquer cracks (n=7, 7.1%) or perforating scleral vessels (n=62, 63.3%) had no predictive contribution to the progression of chorioretinal atrophy.
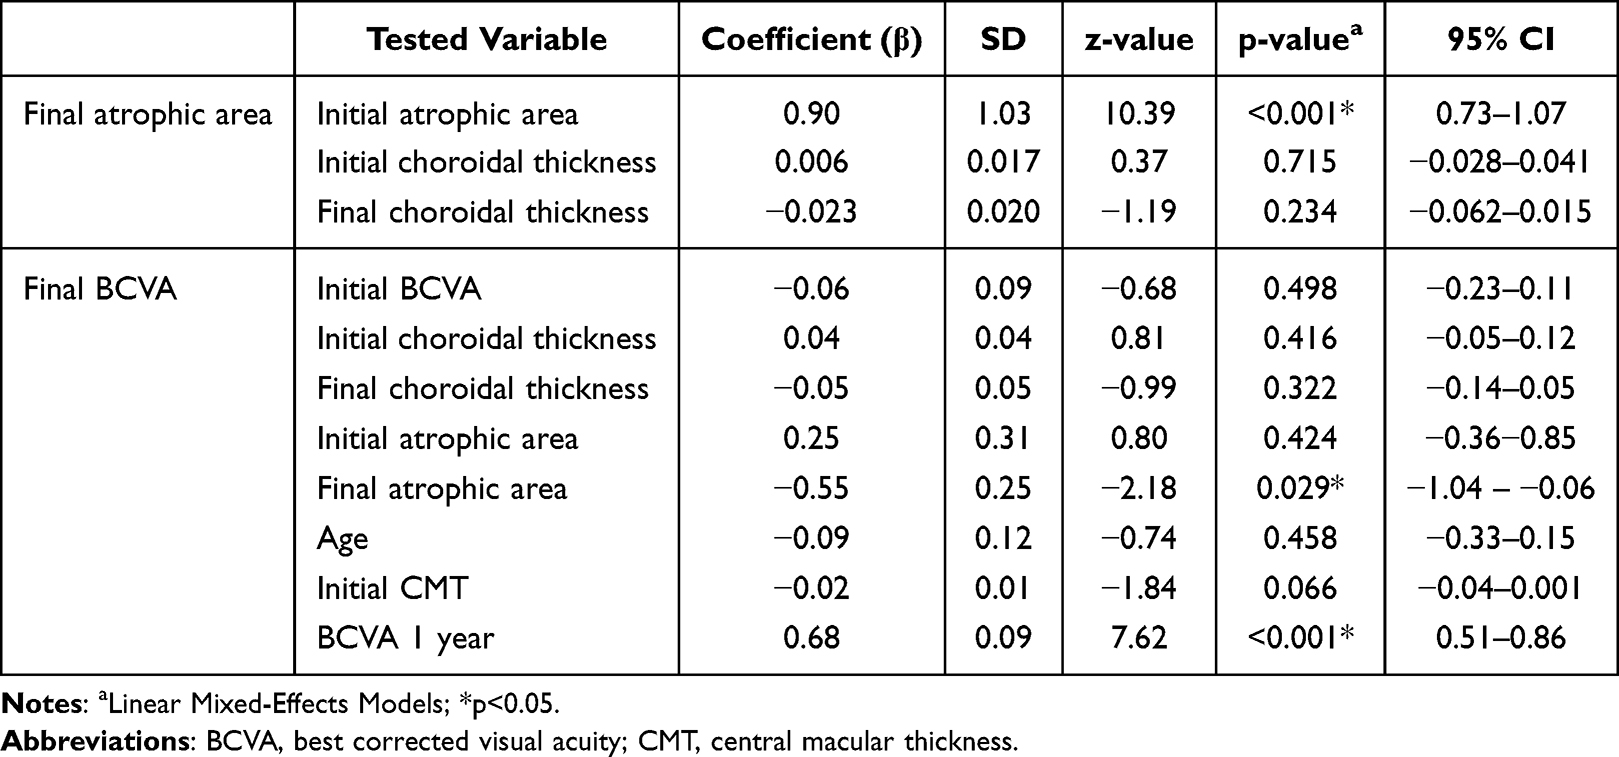 |
Table 4 Linear Mixed-Effects Models for Final Atrophy Area and Final BCVA |
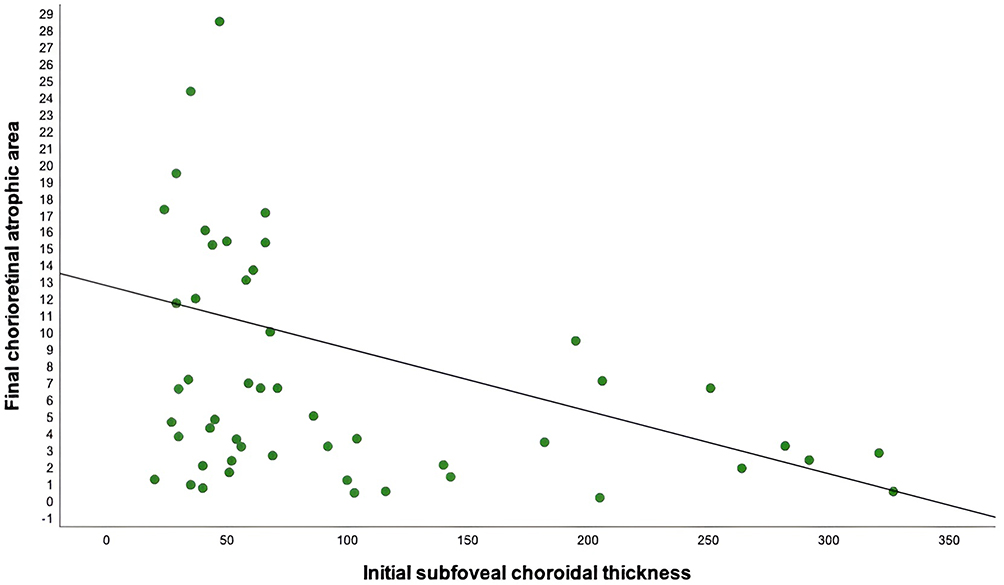 |
Figure 1 Correlation between final chorioretinal atrophic area and initial subfoveal choroidal thickness (r=−0.31, 95% CI −0.49 to −0.10, p=0.004). |
In the linear mixed-effects model with final atrophic area as the dependent variable, baseline atrophy area was the only significant predictor (β=0.90, p<0.001). Each additional 1 mm2 of baseline atrophy was associated with an increase of approximately 0.9 mm2 in atrophic area at the final visit. Baseline and final choroidal thickness were not significantly associated with final atrophy (p=0.72 and p=0.23, respectively). The variance attributable to the random effect (ID) was small (7.7), indicating that most variability was explained by baseline atrophy rather than between-patient differences.
In the linear mixed-effects model for final best-corrected visual acuity, BCVA evaluated 1 year after the initial visit was the strongest predictor, showing a significant positive association with final BCVA (β=0.68, p<0.001). Final atrophic area was independently associated with worse visual outcomes (β=–0.55, p=0.029). Initial central macular thickness at baseline demonstrated a borderline negative association with final vision (β=–0.02, p=0.066). Other covariates, including baseline BCVA, baseline and final choroidal thickness, baseline atrophic area, and age, were not significantly associated with final visual acuity. The variance attributable to the random effect (patient ID) was negligible, indicating limited additional clustering at the patient level.
Discussion
Our work focused on studying the evolution of macular atrophy in highly myopic patients with treated myopic neovascular membranes, searching for potential predictive factors associated with atrophy progression, which ultimately contribute to significant visual loss.
Macular atrophy increased over the follow-up period, both with subfoveal and extrafoveal involvement, with a mean growth of 0.48 ± 1.17 mm2 in the atrophic area per year. The baseline chorioretinal atrophic area measured before mMNV treatment was the major determinant of a larger final macular atrophic area. In the study of Park et al, which included 73 eyes with myopic neovascular maculopathy, the development or enlargement of diffuse chorioretinal atrophy was more likely to occur in eyes with already advanced diffuse chorioretinal atrophy over the entire posterior pole and severe choroidal thinning.17
In high myopia, the stretching of ocular tissues affects choroidal hemodynamics by inducing choriocapillaris circulatory disturbances such as delayed blood flow. Choroidal status appears to be a marker of the aggressiveness of the mMNV.18 Subfoveal choroidal thickness at baseline was demonstrated to be the most relevant structural variable correlated with final chorioretinal atrophic area and atrophy’s annual growth rate, presenting as a promising potential biomarker for CRA progression in myopic patients, as eyes with lower initial SCT measurements presented larger atrophy growing areas. Lee et al also searched for the role of choroidal thickness in chorioretinal atrophy in mMNV (50 eyes) under anti-VEGF therapy and concluded that the relative thinning of the subfoveal choroid as well as the subfoveal MNV location may predispose eyes with myopic MNV to develop chorioretinal atrophy after anti-VEGF therapy.19 Regarding CMT, which decreased over the follow-up time, it occurred both driven by resolution of intraretinal or subretinal fluid related to the mMNV initially after treatment and later with the contribution of progressive atrophic thinning of the retina.
While subfoveal choroidal thickness significantly decreased over the study time, we must consider the importance of increasing age in the equation. Older age has been described as a risk factor for CRA progression. Still, in our cohort, although associated with macular choroidal thinning, age was not associated with the progression of atrophy.20
On the other hand, as the axial length increases, the choroid becomes progressively thinner, and the associated RPE damage later promotes the development of chorioretinal atrophy around the regressed neovascular lesion, leading to an irreversible poor BCVA.21
In our study, the presence of lacquer cracks or perforating scleral vessels had no predictive contribution to chorioretinal atrophy progression, as has also been hypothesized in other series in the literature.22 Lacquer cracks are commonly described as focal stress points of biomechanical injury contributing to the development of patchy macular atrophy. Compared with prior series, the prevalence of lacquer cracks in our cohort was lower. This difference may be explained by case-mix differences, as published series with higher lacquer cracks prevalence often include more extreme axial lengths (>31–33 mm), older age or East Asian cohorts, lesion masking by scars and atrophy (which can reduce detection at the time of grading) or the fact that FA was not done systematically, which may underestimate detection of subtle Bruch’s membrane ruptures.23–25
In our cohort, all new final subfoveal atrophy cases resulted from the progression of extrafoveal to subfoveal atrophy over the myopic MNV lesion. The relationship between choriocapillaris-RPE failure at the lesion edge and the stepwise growth (tendency for patches to coalesce and approach the fovea) has already been described in the literature.18,26 In eyes without atrophy at baseline, the development of extrafoveal macular atrophy may reflect the presence of focal stress points (both mechanical and ischemic) that contribute to edge-driven enlargement of the areas of atrophy, higher risk of MNV and worse vision. The areas of highest curvature in a posterior staphyloma may represent focal stress points layered on top of axial stretch. Patchy macular atrophy can also develop adjacent to regressed myopic MNV, because of a combination of rupture, ischemia and post-MNV remodeling.27,28
Patients under continuous T&E regimen, ultimately submitted to a higher number of IVI, presented a statistically significant higher atrophy area growth rate per year when compared to other treatment regimens. Uemoto et al, in a study that included 27 eyes, identified three main factors associated with the enlargement of the atrophic area after intravitreal injection in mMNV: the size of the mMNV at baseline, the number of IVI required to inactivate the lesion, and the duration of follow-up.9 In our cohort, there were no significant correlations between the anti-VEGF agent used with both final BCVA and atrophic area measurement.
Most patients successfully stopped treatment after a 3 + PRN regimen, with all the intravitreal injections administered in a period inferior to 12 months. This contributes to and explains in part the significant improvement in BCVA observed at the 1-year follow-up visit, which ultimately predicted BCVA at the final visit, regardless of the implemented treatment regimen. Franqueira et al, when studying the long-term visual acuity improvement of 39 patients with mMNV treated with ranibizumab, demonstrated that the change in BCVA at 6 months can be a predictive factor of visual outcome.29
Concerning our primary functional outcome, BCVA overall improved by a mean of 10 letters after anti-VEGF treatment, demonstrating the efficacy of treatment on a functional basis in mMNV. However, patients with larger final mean atrophic areas, specially subfoveal macular atrophy, presented a significantly worse final BCVA (a mean difference of 23 letters) compared to eyes with no atrophy, which highlights the severe impact of chorioretinal atrophy in long-term visual prognosis. The univariable association between extrafoveal atrophy and lower final BCVA likely reflects indirect effects of greater total atrophic burden, progressive EZ/ELM disruption approaching the fovea, and fixation instability, rather than an independent impact of eccentric atrophy. The BCVA evaluated 1 year after the initial visit was identified as the strongest predictor of final visual acuity, with each additional unit at the 1-year visit increasing final VA by ~0.68 ETDRS letters. This result points out to the fact that the first year after diagnosis may probably be the most important one regarding the potential of functional recovery. The greatest functional improvement observed during the first treatment year is consistent with rapid resolution of exudation after anti-VEGF initiation, with the gradual VA decline afterwards being consistent with progressive atrophic changes.
Farinha et al study on the progression of myopic maculopathy after treatment of choroidal neovascularization (52 eyes) also concluded that the long-term functional outcome of eyes with myopic MNV is more dependent on the progression of macular atrophy rather than the type of treatment.30 It is important to acknowledge that the multivariable model for BCVA included several parameters which raises the risk of overfitting when considering the sample size. Despite this potential limitation, the results are significant and make sense from a practical and clinical perspective.
Our study presents some important limitations to be mentioned. First, its retrospective design invariably contributed to some loss of information and patient’s exclusion from the study, as well as an inability to perform a formal prior power calculation for the sample size. The variable follow-up duration represents an inherent limitation of the retrospective design. However, the consistent trends observed in the subgroup of eyes with ≥5 years of follow-up support the validity of the overall findings. Second, for methodology simplification, we have decided to focus on the potential effect of treatment with IVI of anti-VEGF agents by excluding patients treated with photodynamic therapy, thus withdrawing us from making conclusions regarding the impact of other treatment options in CRA progression. Third, we could not evaluate the axial length in our analysis since its measurement was not available in all patients. This is a very important limitation to acknowledge as the influence of axial length on atrophy progression is well known in patients with pathological myopia. Although novel imaging biomarkers such as choriocapillaris flow deficit on OCTA may provide additional insight into the pathophysiology of atrophy progression, OCTA data were not uniformly available across the study period, which limits their integration into the present analysis. Future prospective studies incorporating multimodal imaging, including OCTA-derived parameters, are warranted.
The heterogeneity of atrophic lesions in our cohort is another limitation of our study. Primary degenerative (related to axial elongation and posterior staphyloma) and myopic MNV-related atrophy (contiguous with current/regressed myopic MNV scar) were the most important etiologies of macular atrophy considered, which could not be systematically distinguished due to the retrospective nature of the study. MA was assessed in each case by the two masked graders based on the multimodal imaging previously described in the Methods section. All cases suspected to have an inflammatory etiology (like punctate inner choroidopathy or history of previous uveitis) were excluded. Because CRA measurements were derived from baseline and final visits, the calculated rate reflects an average yearly growth and does not account for potential non-linear progression patterns.
Regarding anti-VEGF heterogeneity, most patients received bevacizumab as the initial and predominant therapy, which mitigates, although does not eliminate, the influence of this variable. Future prospective studies including standardized treatment regimens and stratified analyses by anti-VEGF agent are necessary to clarify its influence on atrophy progression.
Despite being a single-center study, we were able to obtain an extended follow-up period with an overall reasonable sample size of highly myopic patients with mMNV, that compares favorably with previous reports and the significant findings observed suggest adequate sensitivity to detect clinically relevant effects. Our study highlights the importance of creating large databases for clinical investigation on a national and international basis that would allow further robust multicenter studies to be carried out. Our study did not include fellow-eye comparisons, which could have provided additional insight into the natural atrophic progression in untreated eyes. Future studies incorporating bilateral imaging could help distinguish disease-related from treatment-related effects.
Conclusion
Macular atrophy in myopic maculopathy associated with choroidal neovascularization is associated with irreversible visual loss. The baseline chorioretinal atrophic area predicts final macular atrophy. Initial subfoveal choroidal thickness correlates with the yearly growth in the atrophic area and the implemented treatment regimen (especially with a higher number of IVI), influences atrophy growth, although not significant in the multivariable model. Baseline atrophic area and subfoveal choroidal thickness represent potential biomarkers for disease monitoring and risk stratification.
Abbreviations
ATN, atrophy traction neovascularization grading and classification system; BCVA, best corrected visual acuity; CI, confidence intervals; CMT, central macular thickness; CRA, chorioretinal atrophy; EDI, enhanced depth imaging; ELM, external limiting membrane; FAF, fundus autofluorescence; ID, identification; IQR, interquartile range; IVI, intravitreal injections; META-PM, META-analysis for Pathologic Myopia; mMNV, myopic macular neovascularization; OCT, optical coherence tomography; PDT, photodynamic therapy; RPE, retinal pigmented epithelium; SD, standard deviation; SCT, subfoveal choroidal thickness; SE, spherical equivalent; VEGF, vascular endothelium growth factor.
Data Sharing Statement
The data that support the findings of this study are available from the corresponding author upon reasonable request.
Ethical Considerations and Consent to Participate
The retina.pt registry has received prior approval from national ethics committees, including the Institutional Ethics Review Board of ULS São João, Porto, Portugal (CES – Comissão de Ética para a Saúde), and complies with Portuguese data protection regulations. For this retrospective study, additional ethical approval was waived by the Ethics Committee of Local Health Unit of São João, as the study involved fully anonymized data extracted from a pre-approved national registry. The Ethics Committee considers that the objectives of the retrospective study and its methodology are adequate, with no restrictions applied to the implementation of the study. No patient-identifiable information was accessed or recorded. All patients included in the retina.pt national registry provided written informed consent at the time of enrollment. The protocol conformed with the canons of the Declaration of Helsinki for research involving human participants, as well as the European Union’s General Data Protection Regulation. This article was redacted according to the recommendations of The REporting of studies Conducted using Observational Routinely-collected health Data (RECORD) statement.
Consent for Publication
Not applicable. No identifiable patient data are present.
Acknowledgments
There were no third-party services involved in the research or manuscript preparation.
Author Contributions
All authors made a significant contribution to the work reported, whether that is in the conception, study design, execution, acquisition of data, analysis and interpretation, or in all these areas; took part in drafting, revising or critically reviewing the article; gave final approval of the version to be published; have agreed on the journal to which the article has been submitted; and agree to be accountable for all aspects of the work.
Funding
The authors declare that they have no financial ties to declare. No funding or sponsors were undertaken in the preparation of the manuscript.
Disclosure
The authors declared no potential conflicts of interest with respect to the research, authorship, and/or publication of this article.
References
1. Ohno-Matsui K. What is the fundamental nature of pathologic myopia? Retina. 2017;37(6):1043–1048. doi:10.1097/IAE.0000000000001348
2. Ohno-Matsui K, Kawasaki R, Jonas JB, et al. International photographic classification and grading system for myopic maculopathy. Am J Ophthalmol. 2015;159(5):877–83.e7. doi:10.1016/j.ajo.2015.01.022
3. Ruiz-Medrano J, Montero JA, Flores-Moreno I, Arias L, García-Layana A, Ruiz-Moreno JM. Myopic maculopathy: current status and proposal for a new classification and grading system (ATN). Prog Retin Eye Res. 2019;69:80–115. doi:10.1016/j.preteyeres.2018.10.005
4. Yamada M, Hiratsuka Y, Roberts CB, et al. Prevalence of visual impairment in the adult Japanese population by cause and severity and future projections. Ophthal Epidemiol. 2010;17(1):50–57. doi:10.3109/09286580903450346
5. Hayashi K, Ohno-Matsui K, Shimada N, et al. Long-term pattern of progression of myopic maculopathy: a natural history study. Ophthalmology. 2010;117(8):
6. Flores-Moreno I, Ruiz-Medrano J, Duker JS, Ruiz-Moreno JM. The relationship between retinal and choroidal thickness and visual acuity in highly myopic eyes. Br J Ophthalmol. 2013;97(8):1010–1013. doi:10.1136/bjophthalmol-2012-302836
7. Wang Y, Chen S, Lin J, et al. Vascular changes of the choroid and their correlations with visual acuity in pathological myopia. Invest Ophthalmol Vis Sci. 2022;63(12):20. doi:10.1167/iovs.63.12.20
8. Ye J, Shen M, Huang S, et al. Visual acuity in pathological myopia is correlated with the photoreceptor myoid and ellipsoid zone thickness and affected by choroid thickness. Invest Ophthalmol Vis Sci. 2019;60(5):1714–1723. doi:10.1167/iovs.18-26086
9. Uemoto R, Nakasato-Sonn H, Kawagoe T, Akira M, Okada E, Mizuki N. Factors associated with enlargement of chorioretinal atrophy after intravitreal bevacizumab for myopic choroidal neovascularization. Graefes Arch Clin Exp Ophthalmol. 2012;250(7):989–997. doi:10.1007/s00417-011-1921-4
10. Ahn SJ. Retinal thickness analysis using optical coherence tomography: diagnostic and monitoring applications in retinal diseases. Diagnostics. 2025;15(7):833. doi:10.3390/diagnostics15070833
11. Bressler NM, Odia I, Maguire M, et al. Association between change in visual acuity and change in central subfield thickness during treatment of diabetic macular edema in participants randomized to aflibercept, bevacizumab, or ranibizumab: a post hoc analysis of the protocol T randomized clinical trial. JAMA Ophthalmol. 2019;137(9):977–985. doi:10.1001/jamaophthalmol.2019.1963
12. Xie R, Qiu B, Chhablani J, Zhang X. Evaluation of choroidal thickness using optical coherent tomography: a review. Front Med. 2021;8:783519. doi:10.3389/fmed.2021.783519
13. Hayashi M, Ito Y, Takahashi A, Kawano K, Terasaki H. Scleral thickness in highly myopic eyes measured by enhanced depth imaging optical coherence tomography. Eye. 2013;27(3):410–417. doi:10.1038/eye.2012.289
14. Jain M, Gopal L, Padhi TR. Dome-shaped maculopathy: a review. Eye. 2021;35(9):2458–2467. doi:10.1038/s41433-021-01518-w
15. Farinha CL, Baltar AS, Nunes SG, et al. Choroidal thickness after treatment for myopic choroidal neovascularization. Eur J Ophthalmol. 2013;23(6):887–898. doi:10.5301/ejo.5000323
16. Mahmoudzadeh R, Salabati M, Khan MA, Garg SJ, Hsu J. Manual versus semi-automated measurement of geographic atrophy area in eyes with age-related macular degeneration. Trans Vision Sci Technol. 2021;10(9):33. doi:10.1167/tvst.10.9.33
17. Park UC, Lee EK, Yoon CK, Oh BL. Progression pattern of myopic maculopathy according to the severity of diffuse chorioretinal atrophy and choroidal thickness. Sci Rep. 2022;12(1):3099. doi:10.1038/s41598-022-07172-w
18. Avila MP, Weiter JJ, Jalkh AE, Trempe CL, Pruett RC, Schepens CL. Natural history of choroidal neovascularization in degenerative myopia. Ophthalmology. 1984;91(12):1573–1581. doi:10.1016/S0161-6420(84)34116-1
19. Lee JH, Lee SC, Kim SH, et al. Choroidal thickness and chorioretinal atrophy in myopic choroidal neovascularization with anti-vascular endothelial growth factor therapy. Retina. 2017;37(8):1516–1522. doi:10.1097/IAE.0000000000001384
20. Fang Y, Yokoi T, Nagaoka N, et al. Progression of myopic maculopathy during 18-year follow-up. Ophthalmology. 2018;125(6):863–877. doi:10.1016/j.ophtha.2017.12.005
21. Neelam K, Cheung CM, Ohno-Matsui K, Lai TY, Wong TY. Choroidal neovascularization in pathological myopia. Prog Retin Eye Res. 2012;31(5):495–525. doi:10.1016/j.preteyeres.2012.04.001
22. Yu H, Sun J, Luo H, Wang Z, Sun X. Association between perforating scleral vessel and myopic maculopathy: a cross-sectional study of a Chinese cohort. Front Med Lausanne. 2021;8:727680. doi:10.3389/fmed.2021.727680
23. Jonas JB, Xu L, Wei WB, Jonas RA, Wang YX. Progression and associated factors of lacquer cracks/patchy atrophies in high myopia: The Beijing Eye Study 2001–2011. Graefes Arch Clin Exp Ophthalmol. 2022;260(10):3221–3229. doi:10.1007/s00417-022-05705-7
24. Xu X, Fang Y, Uramoto K, et al. Clinical features of lacquer cracks in eyes with pathologic myopia. Retina. 2019;39(7):1265–1277. doi:10.1097/IAE.0000000000002168
25. Wang N-K, Lai -C-C, Chou CL, et al. Choroidal thickness and biometric markers for the screening of lacquer cracks in patients with high myopia. PLoS One. 2013;8(1):e53660. doi:10.1371/journal.pone.0053660
26. Sohn EH, Flamme-Wiese MJ, Whitmore SS, et al. Choriocapillaris degeneration in geographic atrophy. Am J Pathol. 2019;189(7):1473–1480. doi:10.1016/j.ajpath.2019.04.005
27. Ito-Ohara M, Seko Y, Morita H, Imagawa N, Tokoro T. Clinical course of newly developed or progressive patchy chorioretinal atrophy in pathological myopia. Ophthalmologica. 1998;212(1):23–29. doi:10.1159/000027254
28. Ohno-Matsui K, Yoshida T, Futagami S, et al. Patchy atrophy and lacquer cracks predispose to the development of choroidal neovascularisation in pathological myopia. Br J Ophthalmol. 2003;87(5):570–573. doi:10.1136/bjo.87.5.570
29. Franqueira N, Cachulo ML, Pires I, et al. Long-term follow-up of myopic choroidal neovascularization treated with ranibizumab. Ophthalmologica. 2012;227(1):39–44. doi:10.1159/000333213
30. Farinha CL, Baltar AS, Nunes SG, et al. Progression of myopic maculopathy after treatment of choroidal neovascularization. Ophthalmologica. 2014;231(4):211–220. doi:10.1159/000357290
 © 2025 The Author(s). This work is published and licensed by Dove Medical Press Limited. The
full terms of this license are available at https://www.dovepress.com/terms
and incorporate the Creative Commons Attribution
- Non Commercial (unported, 4.0) License.
By accessing the work you hereby accept the Terms. Non-commercial uses of the work are permitted
without any further permission from Dove Medical Press Limited, provided the work is properly
attributed. For permission for commercial use of this work, please see paragraphs 4.2 and 5 of our Terms.
© 2025 The Author(s). This work is published and licensed by Dove Medical Press Limited. The
full terms of this license are available at https://www.dovepress.com/terms
and incorporate the Creative Commons Attribution
- Non Commercial (unported, 4.0) License.
By accessing the work you hereby accept the Terms. Non-commercial uses of the work are permitted
without any further permission from Dove Medical Press Limited, provided the work is properly
attributed. For permission for commercial use of this work, please see paragraphs 4.2 and 5 of our Terms.