Back to Journals » Clinical Ophthalmology » Volume 20
Predictive Accuracy of Intraocular Lens Power Calculation Formulas for Cataract Surgery in Keratoconus: A Systematic Review and Network Meta-Analysis
Authors Aljahdali FF ![]() , Albadri M, Sharif RK, Alharbi BJ, Alzahrani AA, BinYamin AT, Bin Helayel H
, Albadri M, Sharif RK, Alharbi BJ, Alzahrani AA, BinYamin AT, Bin Helayel H ![]()
Received 2 January 2026
Accepted for publication 21 April 2026
Published 21 May 2026 Volume 2026:20 590465
DOI https://doi.org/10.2147/OPTH.S590465
Checked for plagiarism Yes
Review by Single anonymous peer review
Peer reviewer comments 2
Editor who approved publication: Dr Bharat Gurnani
Faisal F Aljahdali,1,2 Mohammed Albadri,3,4 Rahaf K Sharif,1,2 Bandar J Alharbi,5 Asma A Alzahrani,6 Abdulelah T BinYamin,7 Halah Bin Helayel8
1Department of Ophthalmology, Ministry of the National Guard - Health Affairs, Riyadh, Saudi Arabia; 2King Abdullah International Medical Research Center, Riyadh, Saudi Arabia; 3College of Medicine, King Saud Bin Abdulaziz University for Health Sciences, Jeddah, Saudi Arabia; 4King Abdullah International Medical Research Center, Jeddah, Saudi Arabia; 5Ophthalmology Department, Hera General Hospital, Makkah Health Cluster, Makkah, Saudi Arabia; 6Ophthalmology Department, King Abdulaziz University Hospital, Jeddah, Saudi Arabia; 7Department of Ophthalmology, King Fahad Armed Forces Hospital, Jeddah, Saudi Arabia; 8Anterior Segment Division, King Khaled Eye Specialist Hospital, Riyadh, Saudi Arabia
Correspondence: Faisal F Aljahdali, Department of Ophthalmology, Ministry of the National Guard - Health Affairs, Riyadh, Saudi Arabia, Email [email protected]
Background: Keratoconus (KCN) alters corneal curvature, complicating intraocular lens (IOL) power calculations for cataract surgery and increasing the risk of refractive errors. Traditional IOL formulas, designed for normal corneas, often yield suboptimal results, necessitating the evaluation of keratoconus-specific formulas.
Objective: This study compares the predictive accuracy of IOL power calculation formulas in KCN patients undergoing cataract surgery, focusing on mean prediction error (MPE), mean absolute error (MAE), and the proportion of eyes achieving refractions within ± 0.50 D and ± 1.00 D.
Methods: A systematic search of MEDLINE, Embase, and Cochrane databases identified seven studies (530 eyes). A Bayesian network meta-analysis (NMA) ranked formulas, including Barrett True-K (measured/predicted), Kane Keratoconus, Barrett Universal II, SRK/T, Holladay 1 and 2, Haigis, Higgins, and Hoffer Q. Subgroup analyses classified KCN severity using Amsler-Krumeich criteria.
Results: Barrett True-K Measured and Kane Keratoconus demonstrated the highest predictive accuracy and consistently ranked among the best-performing formulas overall. Barrett True-K Predicted showed favorable performance in mild keratoconus, whereas SRK/T performed comparatively well in moderate disease. Conventional formulas, particularly Hoffer Q and Holladay formulas, showed lower predictive accuracy, especially in more advanced keratoconus. Overall, Barrett True-K and Kane Keratoconus achieved the highest proportions of eyes within ± 0.50 D and ± 1.00 D of target refraction.
Conclusion: Barrett True-K and Kane Keratoconus demonstrated superior accuracy, while traditional formulas underperformed, especially in severe KCN. Keratoconus-specific formulas should be prioritized. The ranking probabilities of the including formulas are exploratory and should be interpreted cautiously due to limited and heterogeneous data. Future research should include larger sample sizes and standardized biometry for improved clinical decision-making.
Keywords: keratoconus, intraocular lens power calculation, Barrett true-K, Kane keratoconus, cataract surgery, network meta-analysis
A Letter to the Editor has been published for this article.
Introduction
Keratoconus (KCN) is a bilateral, progressive condition characterized by thinning and bulging of the cornea, leading to blurred vision due to irregular astigmatism.1 It is the most common cause of primary ectasia.2 A recent meta-analysis by Hashemiet al estimated the global prevalence of keratoconus to be approximately 1.38 per 1000 population according to studies published up to 2018.3 The exact cause of keratoconus remains unclear. Factors such as oxidative stress from UV light exposure or frequent eye rubbing are believed to contribute, while a significant genetic component may predispose certain individuals to these environmental influences.4 Halting disease progression and improving visual quality remain key challenges in the management of keratoconus. Significant progress has been achieved in slowing disease progression with the introduction of corneal crosslinking (CXL). Strategies to improve visual quality include the use of contact lenses, refractive surgery, corneal implants, corneal transplants, and lens exchange surgery.5
A certain proportion of KCN patients will develop cataracts, sometimes at a younger age than the general population. Their increased risk is linked to atopy and the use of certain medications. As they age, cataracts become a more likely cause of their reduced vision.5,6 Consequently, several challenges arise when performing cataract extraction in patients with keratoconus, particularly regarding intraocular lens (IOL) power calculation. IOL calculation formulas rely heavily on keratometric values, making accurate measurement of the mean corneal power essential. However, most commonly used formulas were developed using data from eyes with normal corneal geometry and regular optics, which limits their reliability in keratoconus. Furthermore, corneal power measurements in keratoconus may vary depending on the measurement technique and imaging modality used, such as Scheimpflug tomography, corneal topography, or optical biometers. This variability in keratometric assessment can further complicate IOL power prediction.
Formulas such as Hoffer Q, Holladay I, and SRK/T estimate the effective lens position (ELP) indirectly. In eyes with longer axial lengths (AL) and steep K values, which typically have a deeper anterior chamber, the IOL is predicted to be positioned more posteriorly. This posterior positioning can lead to a hyperopic shift following surgery when these formulas are used in patients with keratoconus.5 In addition, the severity of keratoconus plays an important role in refractive predictability. As the disease progresses, increasing corneal irregularity and posterior corneal curvature can further reduce the accuracy of conventional IOL power calculation formulas.
Fourth-generation formulas are theoretically considered an improvement over earlier formulas for calculating IOL power, particularly in eyes with atypical anatomy. Examples include Holladay II, Haigis, Olsen, and Barrett formulas. The incorporation of additional biometric variables in these formulas may improve estimation of the effective lens position and overall refractive accuracy.6–8 More recently, keratoconus-specific formulas such as the Kane Keratoconus and Barrett True-K Keratoconus (BTK) formulas have been developed to enhance prediction accuracy in keratoconic eyes.9,10 Given the increasing number of available formulas and the variability in their reported performance, a comprehensive comparative evaluation is necessary. Network meta-analysis allows simultaneous comparison of multiple formulas by integrating both direct and indirect evidence across studies, enabling a more comprehensive assessment of their relative predictive accuracy. It is also important to acknowledge that indirect comparisons in keratoconus populations are subject to inherent limitations, including heterogeneity in disease severity, differences in biometric platforms, and variations in study design, which may influence the interpretation of the findings.
Therefore, this systematic review and network meta-analysis aims to compare and comprehensively evaluate the predictive accuracy of various IOL power calculation formulas in patients with keratoconus undergoing cataract surgery.
Methods
This study was registered in the PROSPERO database (CRD42023489033) prior to the preliminary search and was conducted in accordance with the Preferred Reporting Items for Systematic Reviews and Meta-Analyses (PRISMA) guidelines.11–13 Ethical approval was not required, as all data included in this study were previously published. All data is available within this article.
Eligibility Criteria
This systematic review and network meta-analysis included studies evaluating intraocular lens (IOL) power calculation formulas in keratoconus patients undergoing cataract surgery. Eligible studies assessed the predictive accuracy of IOL formulas using postoperative refractive outcomes, including mean prediction error (MPE), mean absolute error (MAE), median absolute error (MedAE), and prediction error (PE) within ±0.50 D and ±1.00 D. Studies were required to report preoperative biometry data and include a comparison of at least two IOL formulas. Both prospective and retrospective studies were considered, while studies involving patients with prior corneal or intraocular surgery, ocular trauma, or capsular rupture during cataract surgery were excluded.
Search Strategy
We systematically searched the MEDLINE (Ovid), Embase, and Cochrane Central Register of Controlled Trials (CENTRAL) databases from their inception until May 17, 2024, without restrictions on language or publication date. The search strategy included keywords and controlled vocabulary related to “keratoconus” OR “conical cornea” OR “KC” AND “intraocular lens” OR “IOL power calculation” OR “lens implantation” AND “formula” OR “prediction error” OR “refractive outcome”. Boolean operators were used to refine the results, ensuring the inclusion of studies comparing at least two IOL formulas in keratoconus patients. Additionally, the reference lists of relevant systematic reviews and included studies were manually screened to identify any additional eligible articles.
Study Selection and Data Extraction
After removing duplicates, two authors independently screened the titles, abstracts, and full texts to identify studies meeting the inclusion criteria. Any disagreements were resolved through discussion or consultation with a third reviewer. Data extraction was conducted using a predefined Excel spreadsheet, collecting information on study characteristics, design, sample size, inclusion and exclusion criteria, participant demographics, baseline characteristics, biometry and IOL calculation details, as well as postoperative refractive outcomes, including predictive accuracy and error measurements.
For outcomes not explicitly reported in the included studies, statistical calculations were performed to derive the necessary data. These calculations followed established statistical methods and were verified by a professional statistician to ensure accuracy and consistency. All extracted and calculated data underwent a double-checking process by the reviewers to maintain data integrity.
Study Outcomes
This systematic review analyzed key refractive outcomes, including mean prediction error (MPE), mean absolute error (MAE), and prediction error (PE) within ±0.50 D and ±1.00 D. Table 1 presents detailed data on the number of patients assessed for each outcome and the intraocular lens (IOL) formulas evaluated. Additionally, a systematic review was conducted to examine MPE, MAE, median absolute error (MedAE), and PE within ±0.50 D and ±1.00 D, stratified by keratoconus severity. This analysis incorporated all seven included studies, offering a comprehensive assessment of how keratoconus severity influences postoperative refractive accuracy.9,14–19
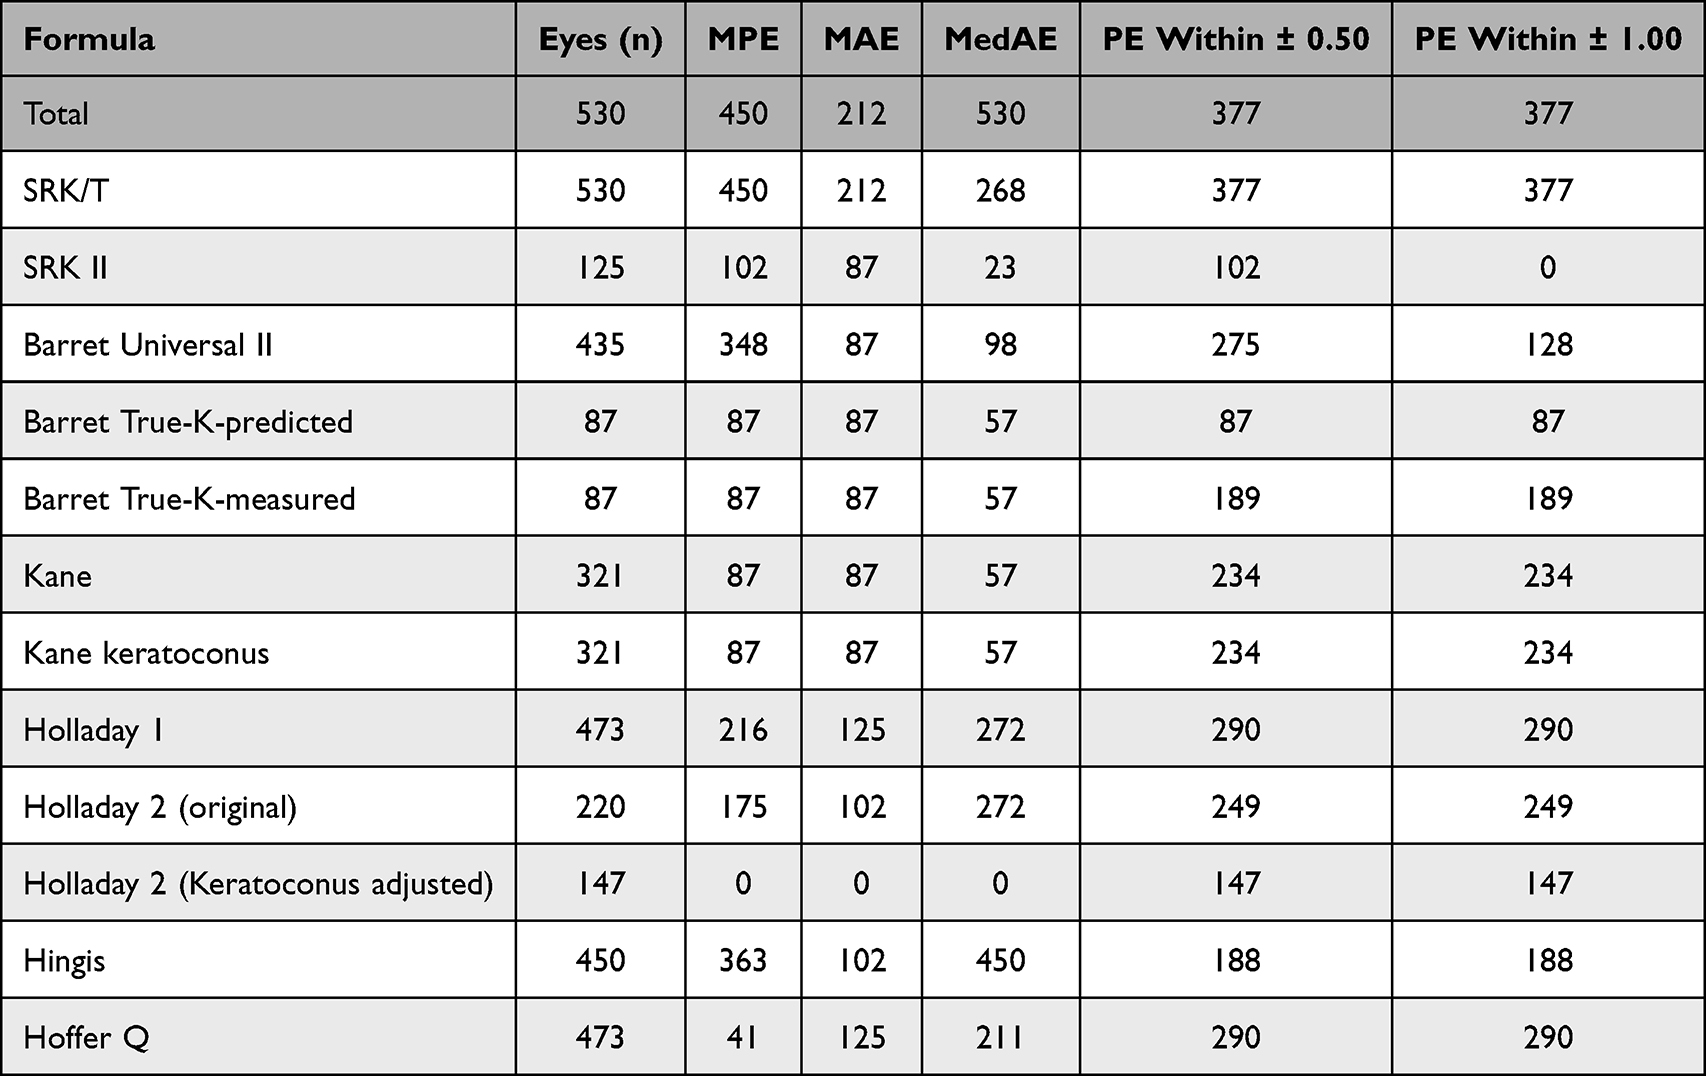 |
Table 1 Included Formulas with the Number of Eyes in Each Outcome |
Risk of Bias and Quality Assessment
Two reviewers independently assessed the risk of bias in all included studies using the Quality Assessment of Diagnostic Accuracy Studies 2 (QUADAS-2) tool. Any discrepancies in judgment were resolved through discussion and consensus.11,13
Statistical Analysis
A network meta-analysis (NMA) was performed to compare the accuracy of intraocular lens (IOL) power calculation formulas in keratoconus patients undergoing cataract surgery, integrating both direct and indirect evidence using a Bayesian random-effects model. The surface under the cumulative ranking curve (SUCRA) was calculated for each formula across all primary and secondary outcomes to determine ranking probabilities. SUCRA values ranged from 0% (least accurate) to 100% (most accurate), with higher values indicating a greater likelihood of a formula being the most precise for a given outcome.
For each outcome, mean differences (MD) with 95% credible intervals (CrI) were calculated for continuous data to assess formula performance. A leave-one-out sensitivity analysis was conducted to evaluate the robustness of the results by systematically excluding each study and reassessing the effect on the pooled estimates. Subgroup analysis was also performed based on keratoconus severity, following the Amsler-Krumeich classification, which categorizes the condition into mild (mean K < 48 D), moderate (mean K = 48–53 D), and severe (mean K > 53 D) groups. In cases where different classification systems were used, eyes were reclassified into the closest corresponding Amsler-Krumeich category based on reported keratometry values. All statistical analyses were conducted using MetaInsight v6.2.1, which operates through the “netmeta” package in R statistical software (R Foundation for Statistical Computing).
Results
Search Result and Study Selection
The initial database search using the specified keywords yielded a total of 741 articles. After removing duplicates, the number of articles was reduced to 526. Following the title and abstract screening, 13 studies were selected for further evaluation through full-text screening. Two of these studies were initially included, with an additional five studies identified through citation screening of the included articles. Ultimately, a total of seven studies were included in the network meta-analysis, as illustrated in Figure 1.
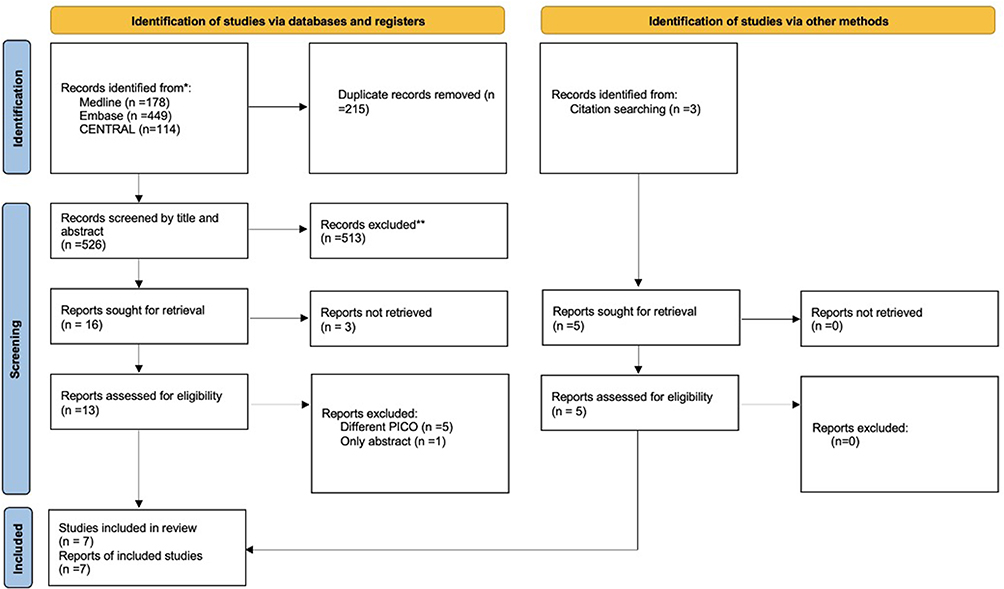 |
Figure 1 Flow chart for screening and selection of the included studies. |
Risk of Bias of the Included Studies
The assessment revealed low risk in patient selection, index test, and reference standard domains across all studies. However, unclear risk was noted in the flow and timing domain for six studies due to short or inconsistent follow-up periods.9,14–19 One study also had unclear risk in patient selection due to incomplete inclusion/exclusion criteria.15 One study was the only one rated low risk across all domains.19 Despite these variations, all studies used postoperative refraction as a valid reference standard. The detailed risk of bias assessment is summarized in Figure 2.
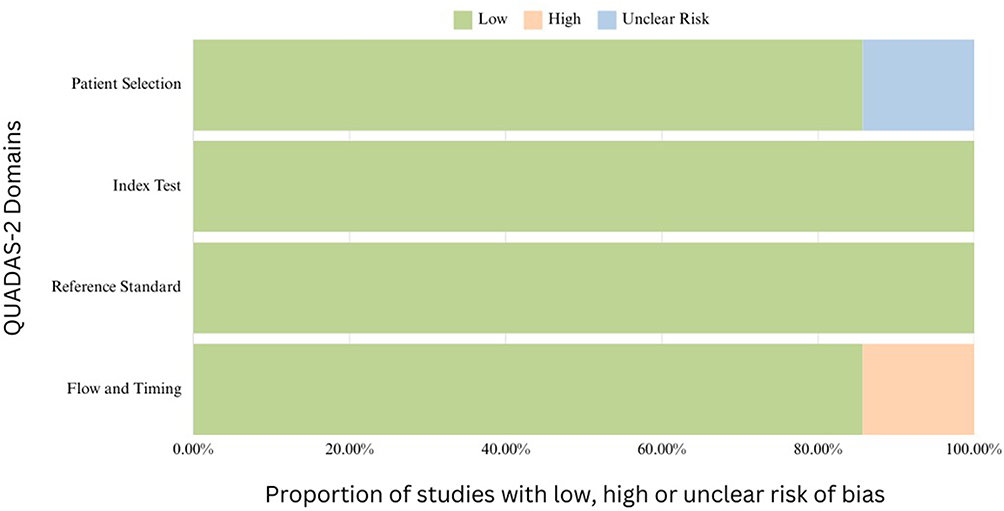 |
Figure 2 Risk of bias assessment of the included trials based on `. |
Study Baseline Characteristics
Seven studies, comprising a total of 530 eyes, were included to assess the predictive accuracy of intraocular lens (IOL) power calculation formulas in keratoconus patients undergoing cataract surgery. The detailed characteristics of these studies are summarized in Table 2 and Table 3. The age of participants ranged from 59 to 66.5 years. Most studies included patients with mild to severe keratoconus, while two studies focused specifically on patients with stable keratoconus.14,17
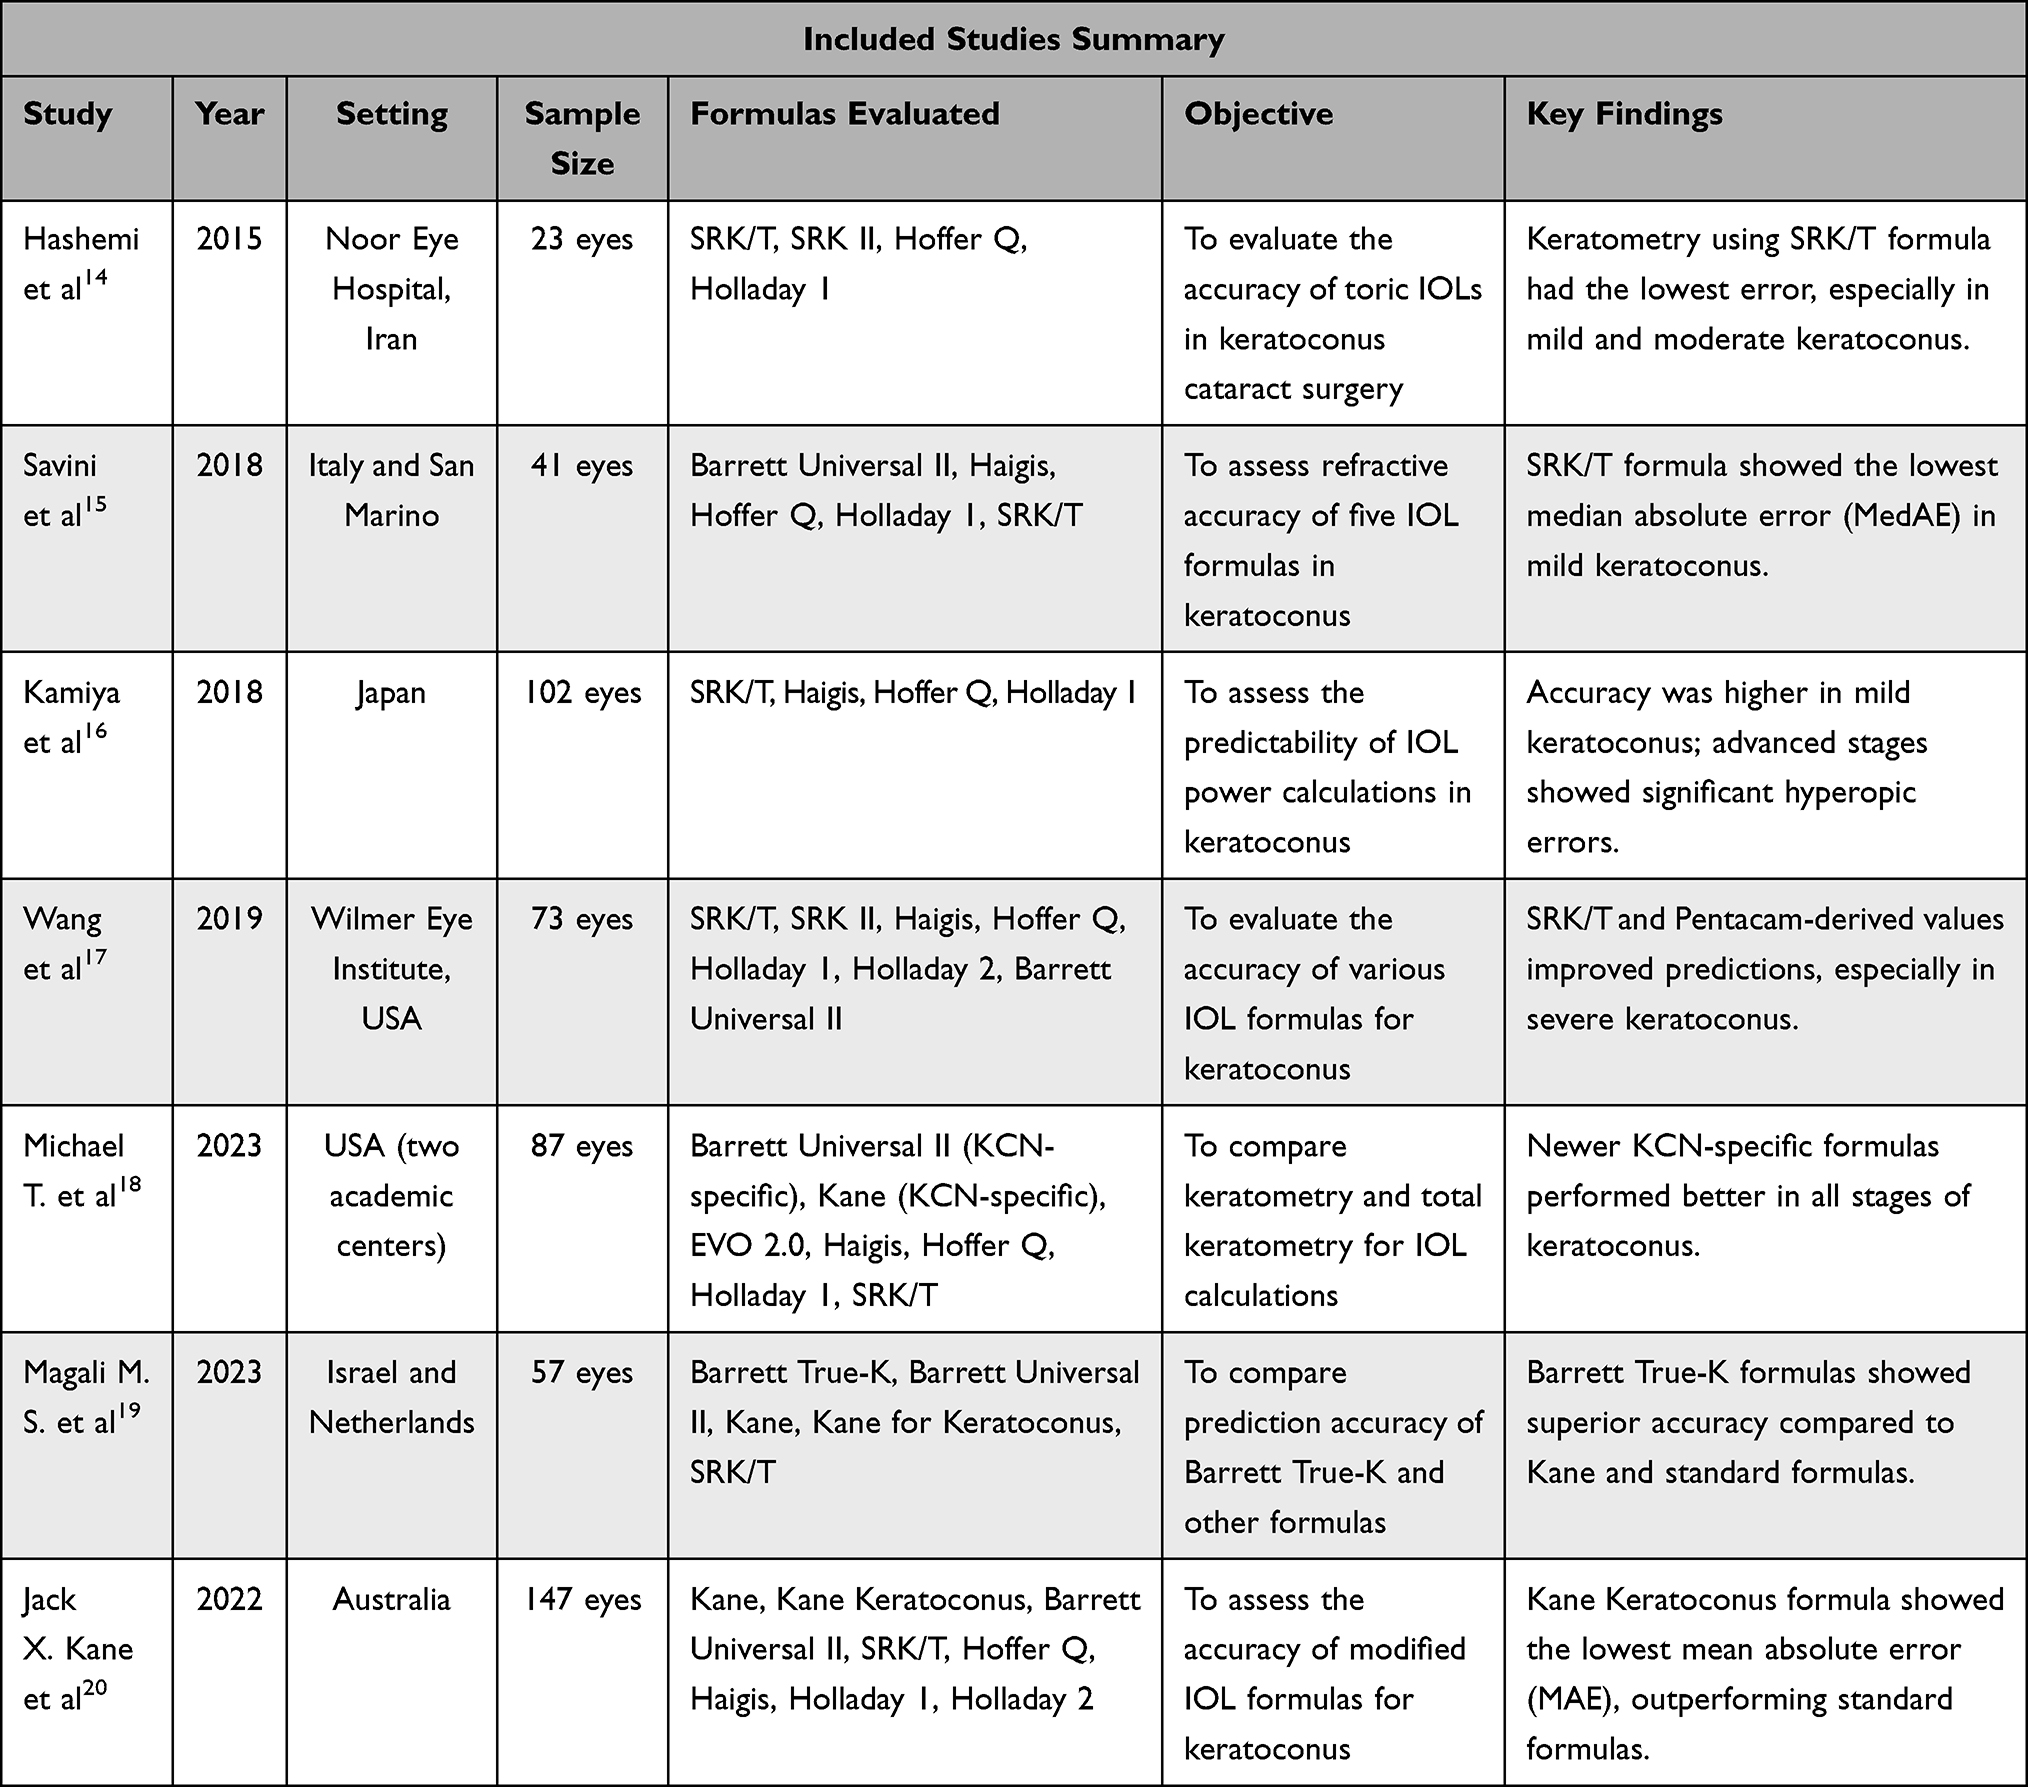 |
Table 2 Included Studies Summary |
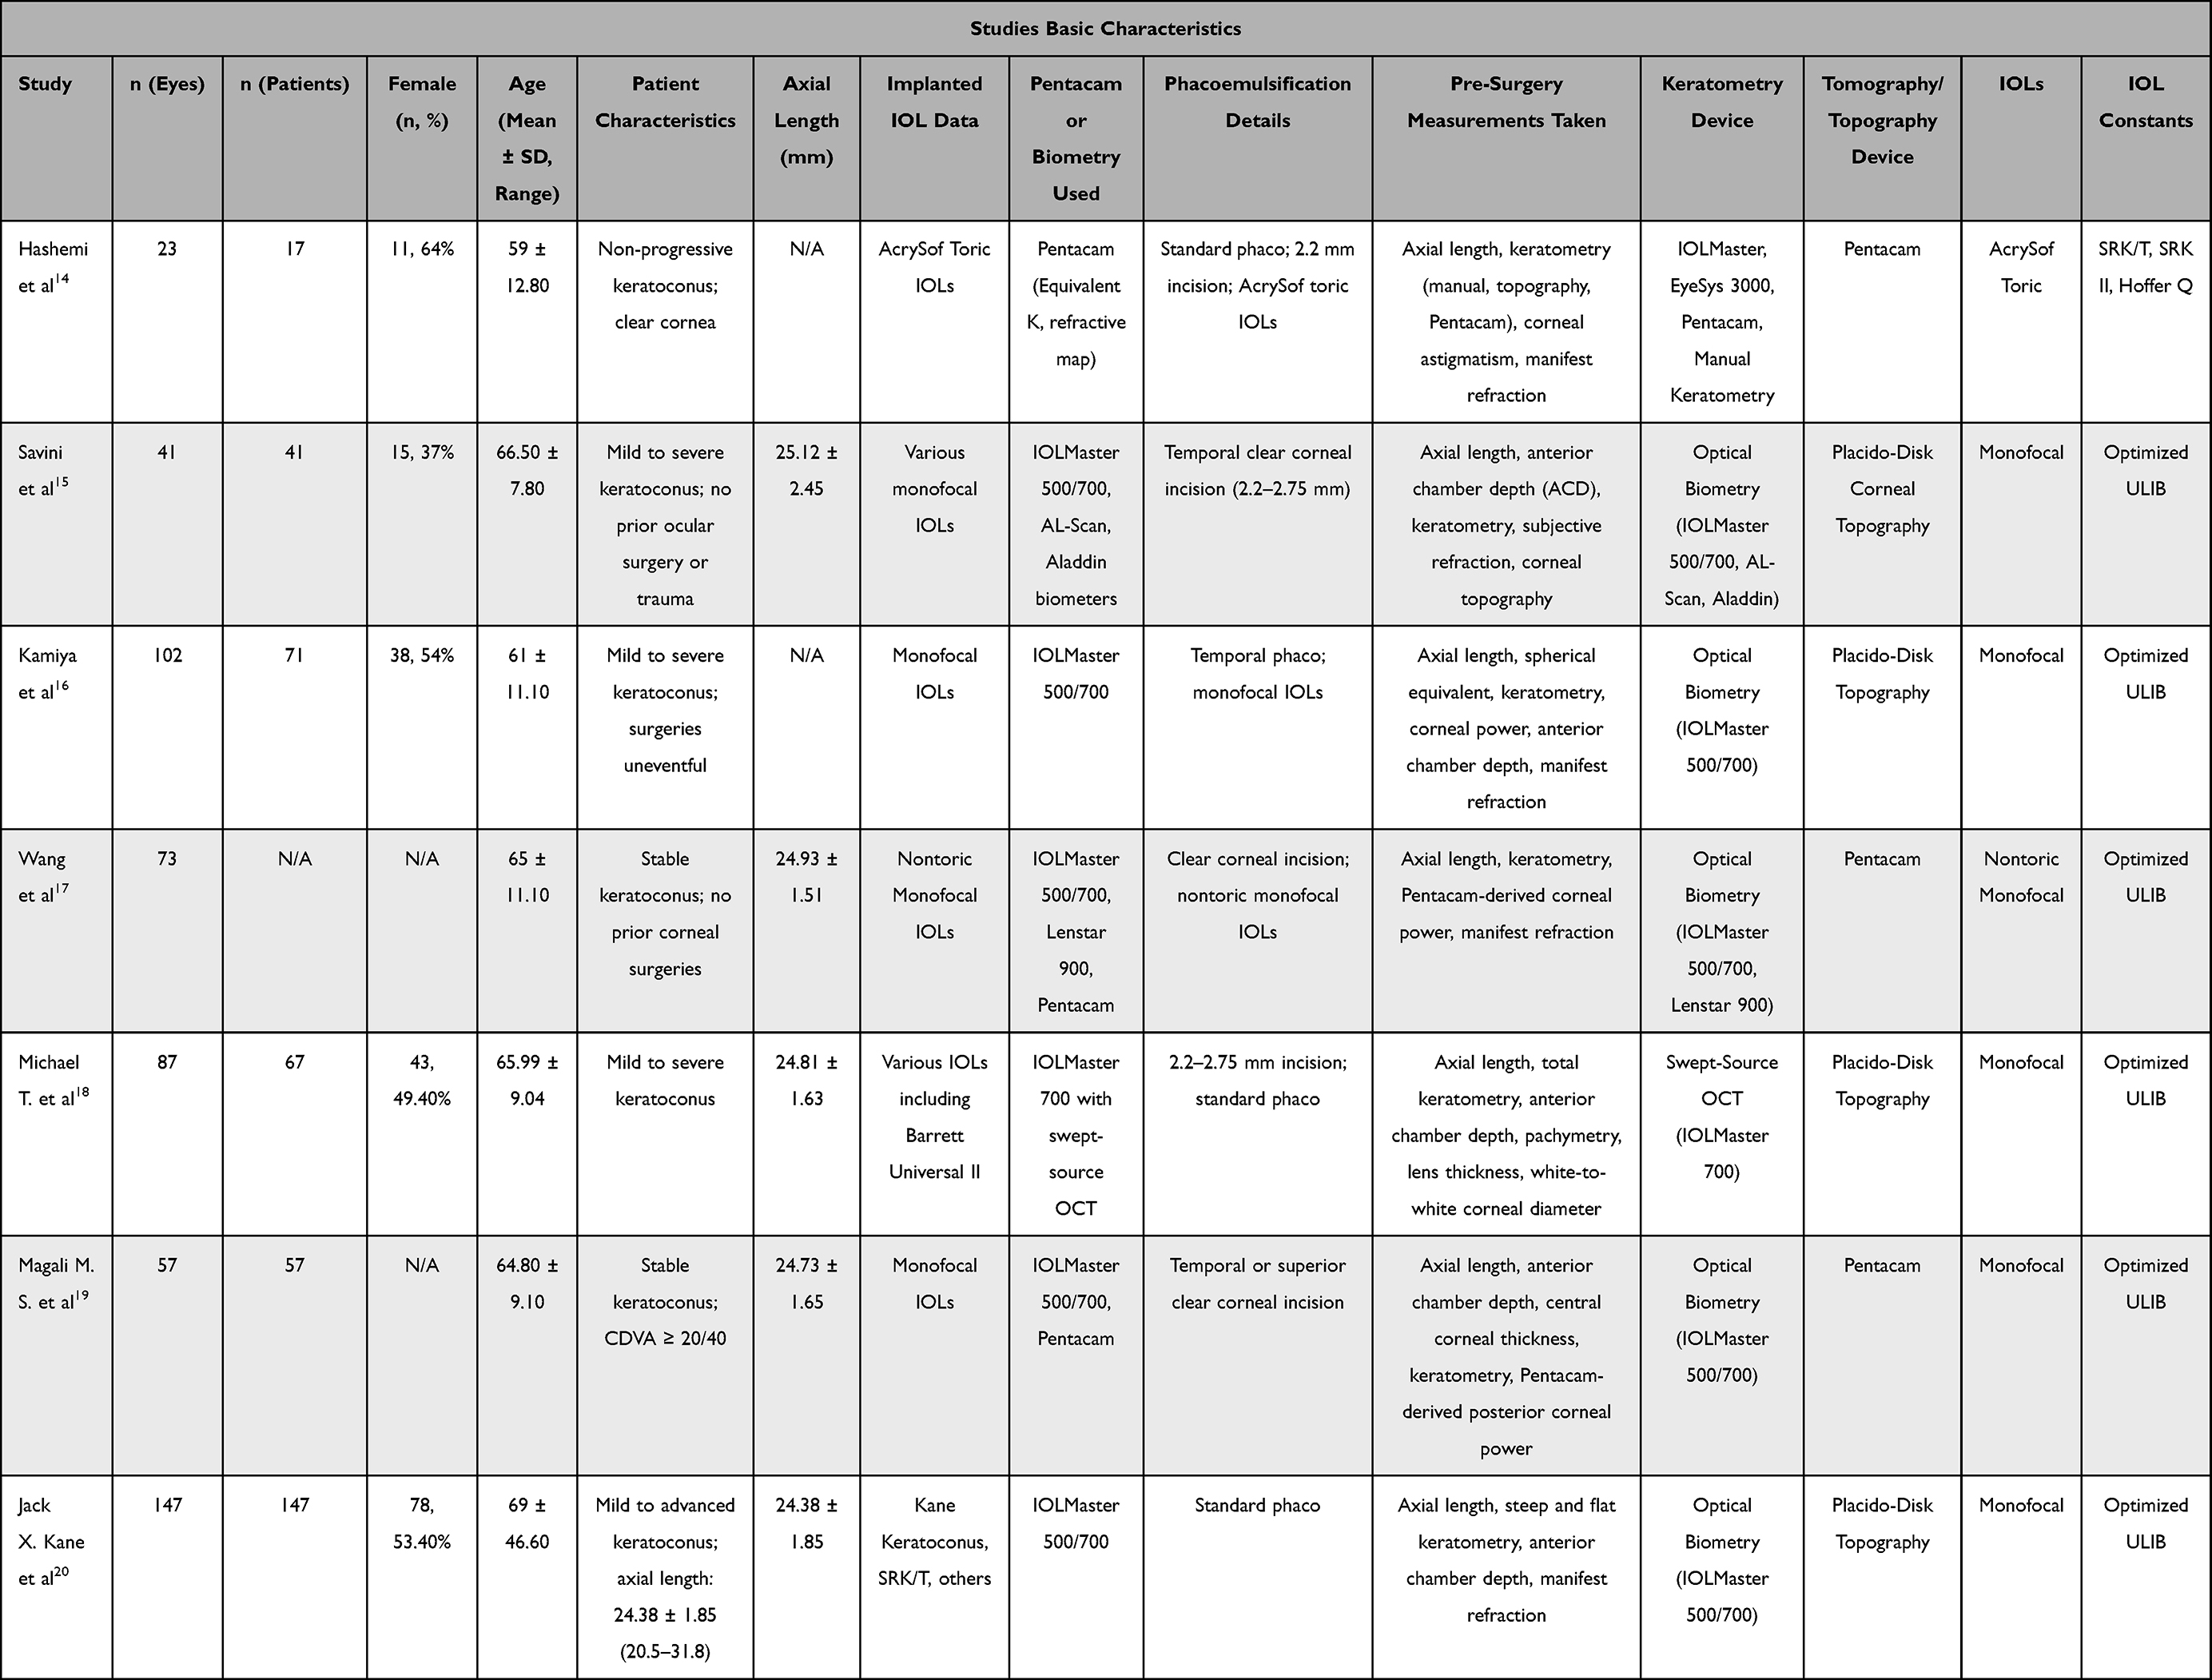 |
Table 3 Studies Basic Characteristics |
A variety of IOLs were used across the studies. One study reported the use of toric IOLs, such as AcrySof Toric.14 Another predominantly utilized nontoric monofocal IOLs.18 In contrast, five studies reported the use of various monofocal IOLs.9,15,16,18,19
The Pentacam system was utilized in four studies.14,17–19 Optical biometers such as IOLMaster 500/700 were employed in five studies.9,15,16,18,19 Additionally, Placido-disk-based topography was specifically used in four studies.9,15,16,18
Phacoemulsification techniques were generally consistent across the studies, with clear corneal incisions ranging between 2.2 to 2.75 mm. Standard phacoemulsification was explicitly reported in four studies.9,14,15,18 Another study described clear corneal incisions without further procedural details.18
Bayesian Network Meta-Analysis
Figure 3 presents the network plots, visually depicting the original comparisons between the intraocular lens (IOL) formulas evaluated across the included studies. A detailed comparison of all formulas across the various tested metrics is provided in the Tables, offering a comprehensive overview of the results.
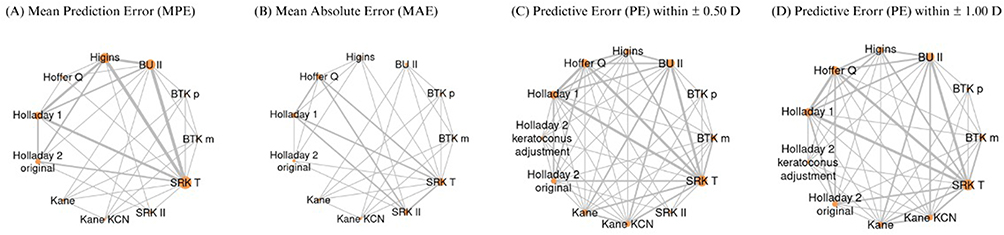 |
Figure 3 Network plot of intraocular lens (IOL) power calculation formulas included in the network meta-analysis (NMA). (A) Network for Mean Predicted Error (MPE). (B) Network for Mean Absolute Error (MAE). (C) Network for Predictive Error (PE) within ± 0.50 Diopter. (D) Network for Predictive Error (PE) within ± 1.00 Diopter. |
Mean Prediction Error (MPE)
The network meta-analysis (NMA) assessing Mean Prediction Error (MPE) included five studies,9,15–17,19 covering 84.91% of participants. The SUCRA ranking plot identified Barrett True-K Measured as the formula with the lowest MPE, followed by Kane Keratoconus. In contrast, Holladay 2 Original had the highest MPE (Figure 4A). The forest plot demonstrated that the Kane Keratoconus formula had a mean difference of 0.0004 (95% CI: −1.05, 1.05), slightly favoring Barrett True-K Measured. A comprehensive comparison of all formulas is provided in Figure 4B. A sensitivity analysis was conducted to check whether excluding any single study would change the MPE results. When one study was removed from the analysis, the Barrett Universal II (BU II) formula showed the lowest MPE compared to Barrett True-K Measured, with a difference of −0.0572 (95% CI: −0.664, 0.554).
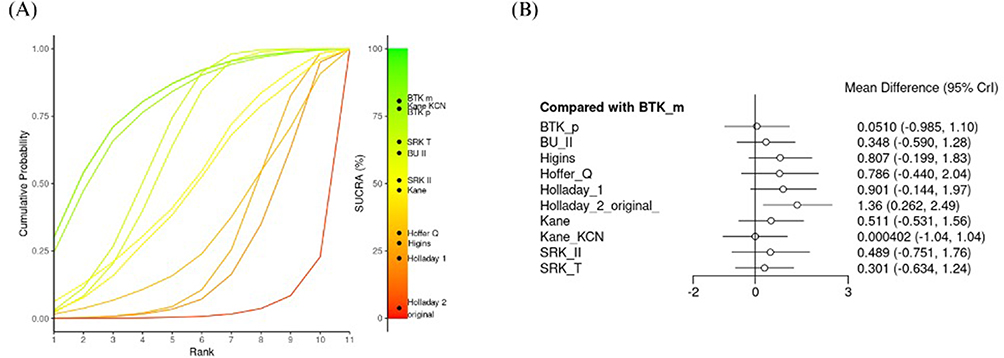 |
Figure 4 (A) SUCRA ranking of intraocular lens (IOL) power calculation formulas based on Mean Prediction Error (MPE). (B) Forest plot comparing MPE across formulas, displaying mean differences and 95% credible intervals (CrI). |
Mean Absolute Error (MAE)
A network meta-analysis (NMA) assessing Mean Absolute Error (MAE) included three studies,14,16,19 accounting for 40% of the participants. The SUCRA ranking plot in Figure 5A indicated that Barrett True-K Predicted was the formula with the lowest MAE, followed by Barrett True-K Measured, SRK/T, Kane Keratoconus, Barrett Universal II, and Kane. Conversely, the Higgins formula exhibited the highest MAE. The forest plot (Figure 5B) demonstrated that Barrett True-K Predicted had a mean difference of −0.00876 (95% CI: −0.486, 0.461) compared to Barrett True-K Measured.
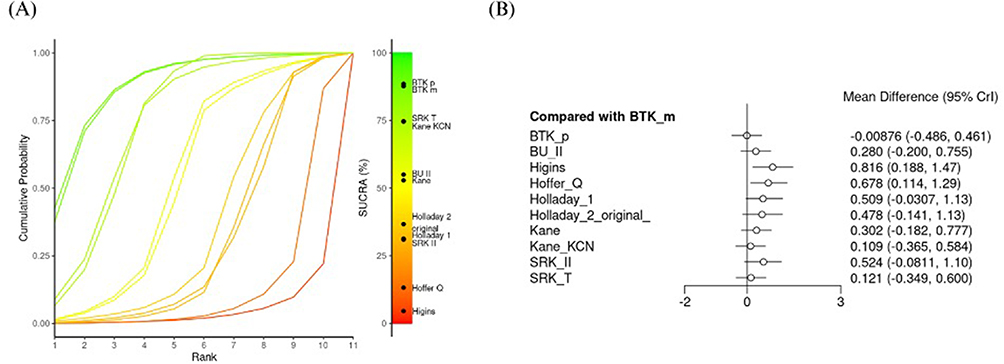 |
Figure 5 (A) SUCRA ranking of intraocular lens (IOL) power calculation formulas based on Mean Absolute Error (MAE). (B) Forest plot comparing MAE across formulas, showing mean differences and 95% credible intervals (CrI). |
Predictive Error (PE) Within ± 0.50 D and ± 1.00 D
A network meta-analysis (NMA) was conducted to assess prediction error (PE) within ±0.50 D and ±1.00 D, utilizing data from four studies for each outcome and covering 71.13% of the participants.9,15,16,19 The SUCRA ranking plot Figure 6A showed that the three highest-ranked formulas for PE within ±0.50 D were Barrett True-K Measured, Barrett True-K Predicted, and Kane Keratoconus. In contrast, Holladay 2 Keratoconus Adjusted exhibited the lowest rate of PE within ±0.50 D. The forest plot Figure 6B revealed that all formulas, except Barrett True-K Predicted, exhibited lower PE rates within ±0.50 D when compared to Barrett True-K Measured. Among these, Holladay 2 Keratoconus Adjusted had the lowest mean difference of 0.323 (95% CI: 0.168, 0.568), followed by Hoffer Q with a mean difference of 0.390 (95% CI: 0.237, 0.613), both favoring Barrett True-K Measured. In contrast, Barrett True-K Predicted demonstrated a mean difference of 1.13 (95% CI: 0.599, 2.11), favoring Barrett True-K Predicted over Barrett True-K Measured. Further details are presented in Figure 6B.
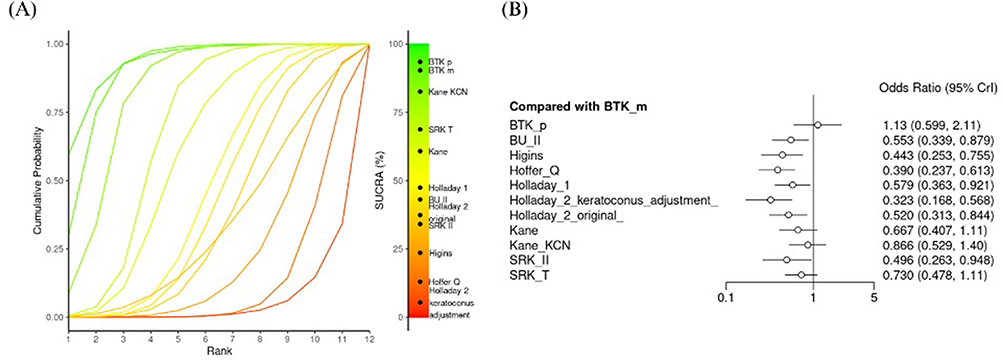 |
Figure 6 (A) SUCRA ranking of intraocular lens (IOL) power calculation formulas based on the proportion of eyes achieving a prediction error (PE) within ±0.50 D. (B) Forest plot comparing PE within ±0.50 D across formulas, displaying mean differences and 95% credible intervals (CrI). |
The final NMA assessed PE rates within ±1.00 D using SUCRA analysis. The ranking plot (Figure 7A) indicated that Barrett True-K Predicted had the highest PE rates within ±1.00 D, followed by Kane Keratoconus and Barrett True-K Measured. Consistent with the findings for PE within ±0.50 D, Holladay 2 Keratoconus Adjusted exhibited the lowest rates of PE within ±1.00 D. The forest plot (Figure 7B) showed that Barrett True-K Predicted, when compared to Barrett True-K Measured, had a mean difference of 1.32 (95% CI: 0.661, 2.59), favoring Barrett True-K Predicted. Additionally, Kane Keratoconus exhibited a higher PE rate within ±1.00 D with a mean difference of 1.25 (95% CI: 0.723, 2.14), followed by SRK/T with a mean difference of 1.03 (95% CI: 0.664, 1.65). In contrast, the remaining formulas did not show significantly higher PE rates within ±1.00 D, with the lowest rates observed for Holladay 2 Keratoconus Adjusted, which had a mean difference of 0.605 (95% CI: 0.313, 1.15), favoring Barrett True-K Measured. Further details regarding all formulas are illustrated in Figure 7B.
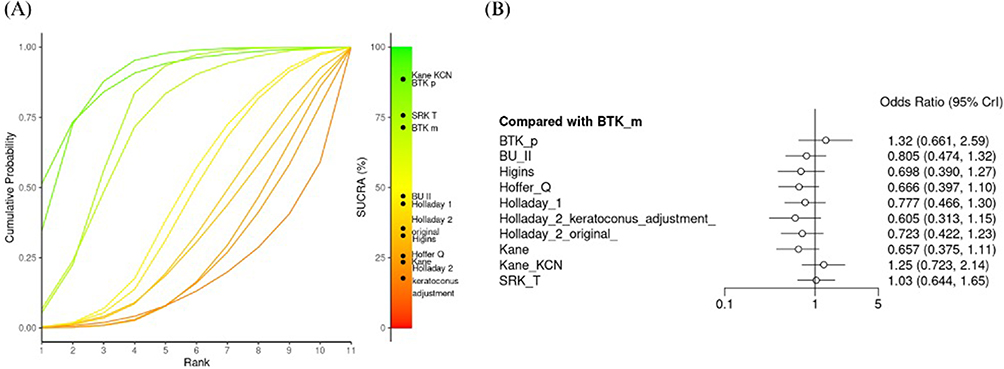 |
Figure 7 (A) SUCRA ranking of intraocular lens (IOL) power calculation formulas based on the proportion of eyes achieving a prediction error (PE) within ±1.00 D. (B) Forest plot comparing PE within ±1.00 D across formulas, displaying mean differences and 95% credible intervals (CrI). |
Sub-Grouping Based on Keratoconus Severity
Figure 8A illustrates the overall Mean Prediction Error (MPE) outcomes stratified by the severity of keratoconus (KCN). In cases of mild KCN, the Barrett True-Kane Predicted (BTKP) formula demonstrated the lowest MPE, followed by Barrett True-Kane Measured (BTKM), SRK/T, Barrett Universal II, Kane Keratoconus, Kane, and Holladay 1, respectively. For eyes with moderate KCN, the Kane Keratoconus formula yielded the lowest MPE (0.15), followed by BTKP (0.19) and BTKM (0.28).9,14–19 Conversely, the Holladay 1 formula exhibited the highest MPE in this subgroup. In severe KCN cases, BTKM achieved the lowest MPE (0.46), followed by BTKP and Kane Keratoconus. Holladay 1 again reported the highest MPE (3.38), surpassing all other formulas, with Holladay 2, Kane, and SRK/T following sequentially.
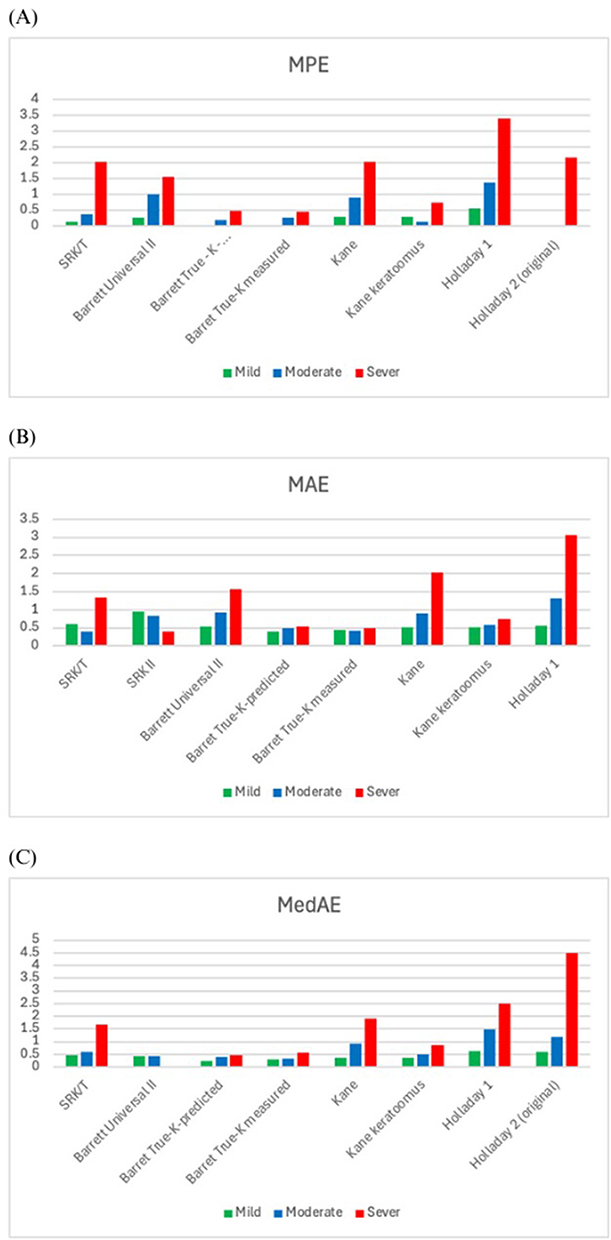 |
Figure 8 Chart (A) represents the MPE in eight different formulas based on keratoconus severity stage. Also, both charts (B and C) represent the MAE and the MedAE respectively in eight formulas based on keratoconus severity. |
Figure 8B presents the Mean Absolute Error (MAE) outcomes relative to KCN severity. For mild KCN, both BTKP and BTKM exhibited significantly lower MAE values (0.39 and 0.44, respectively) compared to other formulas. In contrast, Holladay 1, SRK/T, and SRK II showed substantially higher MAE values. Among moderate KCN patients, BTKM resulted in the lowest MAE, followed by BTKP and Kane Keratoconus. Notably, Holladay 1 exhibited the highest MAE in this group, followed by Barrett Universal II. In severe KCN cases, SRK II unexpectedly recorded the lowest MAE, with BTKM and BTKP following. Holladay 1, however, remained the formula with the highest MAE, succeeded by Kane and Barrett Universal II.9,14–19
Figure 8C depicts the Median Absolute Error (MedAE) outcomes as stratified by KCN severity. In mild KCN, BTKM and BTKP recorded the lowest MedAE values, followed by Kane Keratoconus and Kane. Conversely, Holladay 1 and Holladay 2 presented the highest MedAE values at 0.64 and 0.58, respectively. Among moderate KCN patients, Holladay 1 yielded significantly higher MedAE values relative to other formulas, whereas BTKP and BTKM demonstrated the lowest MedAE. In severe KCN, Holladay 2 reported an extreme MedAE of 4.50, followed by Holladay 1 and Kane. Conversely, BTKP showed the lowest MedAE, followed by BTKM, Kane Keratoconus, and SRK/T.9,14–19
Discussion
Managing cataracts in patients with keratoconus presents unique challenges. Since most intraocular lens (IOL) calculation formulas are designed for eyes with normal corneal structures, their application in keratoconus eyes often results in inaccurate refractive predictions and suboptimal visual outcomes following cataract surgery.21 A new generations of IOL calculation formulas, including keratoconus-specific formulas, have been developed to improve the refractive predictive accuracy.19
This systematic review and network meta-analysis included seven studies involving a total of 560 eyes, comparing the predictive accuracy of 11 intraocular lens (IOL) power calculation formulas in keratoconus patients undergoing cataract surgery. Multiple refractive outcomes were assessed, including mean prediction error (MPE), mean absolute error (MAE), Median Absolute Error (MedAE), and prediction error (PE) within ±0.50 D and ±1.00 D. Overall, the Barrett True-K formulas, particularly the Measured (BTKM) and Predicted (BTKP), demonstrated the highest accuracy in terms of MPE, MAE, MedAE, and PE within ±0.50 D and ±1.00 D. in terms of mean prediction error (MPE), the Barrett True-K formulas outperformed newer keratoconus-adjusted formulas like Kane Keratoconus, and surpassing older generations formulas such as Holladay 1, Holladay 2 Original, Haigis, and Hoffer Q. When stratified by keratoconus severity, BTKP was the most accurate in mild disease, Kane Keratoconus in moderate disease, and BTKM in severe cases. This stage-dependent performance highlights that no single formula is optimal for all keratoconus patients. Rather, selecting the appropriate formula based on disease severity may significantly enhance postoperative refractive outcomes and reduce prediction errors.
Similarly, when assessing mean absolute error (MAE), BTKP showed the highest accuracy across all formulas, followed closely by BTKM, SRK/T, and Kane Keratoconus, while Hoffer Q and SRK II exhibited the poorest performance, interestingly, SRK/T showed unexpectedly favorable results in severe keratoconus, suggesting potential value in certain advanced cases. This may be explained by the findings of Melles et al who showed that the SRK/T formula tends to produce a significant myopic prediction error in normal eyes as keratometry values increase.22 This myopic tendency at higher corneal powers may help counteract the hyperopic shift commonly seen in keratoconus patients, as noted by Kane et al9 In terms of predictive error within ±0.50 D and ±1.00 D, BTKM and BTKP ranked consistently among the top performers, particularly in achieving high rates of refractive outcomes within acceptable error margins. In contrast, Holladay 2 Keratoconus Adjusted, Hoffer Q, and Higgins formulas demonstrated lower predictive accuracy with greater margins of error. MedAE analysis based on keratoconus severity had consistent findings, with BTKM and BTKP maintaining top performance across mild and moderate keratoconus, while BTKP demonstrated the best performance in severe disease.
Collectively, these findings emphasize the superior performance of keratoconus-adjusted formulas, particularly the Barrett True-K formulas, in achieving accurate refractive outcomes across keratoconus severities. This is consistent with finding of previous studies that displayed the superior performance of Barret True-K formulas.18,19,23 Our results also suggest that no single formula performs best in all Keratoconus severities level, highlighting the importance of tailoring formula selection based on the stage of the disease.
The superior performance of keratoconus-specific IOL formulas, such as Barrett True-K and Kane Keratoconus, may be explained by their design, which takes into account the irregular corneal structure and the altered effective lens position (ELP) often seen in keratoconus eyes. These formulas incorporate multiple biometric parameters to improve the accuracy of lens power prediction. For example, the Barrett True-K formula includes posterior corneal curvature and central corneal thickness, allowing for a more customized calculation. Similarly, the Kane Keratoconus formula uses a modified corneal power based on the anterior corneal radius in steep corneas to adjust for the abnormal ratio between anterior and posterior curvature found in keratoconus, leading to more reliable corneal power estimates.19 In contrast, older IOL calculations formulas like Hoffer Q and Holladay 1 rely on keratometry values. Simulated keratometry reading is determined as the average keratometry readings obtained by a corneal topographer or an autokeratometer for IOL power calculation. However, in keratoconus, keratometry values often overestimate the actual corneal refractive power due to corneal distortion caused by ectasia, even though the visual axis may pass through a flatter region with less refractive power. This leads to an underestimation of the required IOL power, and a final effective lens position that is more posterior than expected. All these factors lead to an increased risk of postoperative hyperopia and inaccurate refractive outcomes.21,24 These factors may explain the poor performance of older formulas in predicting refractive outcomes in patients with keratoconus.
To the best of our knowledge, this is the first systematic review and network meta-analysis comprehensively evaluated multiple refractive outcomes, including mean prediction error (MPE), mean absolute error (MAE), median absolute error (MedAE), and prediction error within ±0.50 D and ±1.00 D, providing a detailed assessment of the predictive accuracy of various intraocular lens (IOL) formulas. Additionally, the study included a stratified analysis based on keratoconus severity, offering valuable insights into formula performance across different stages of the disease.
While our systematic review and network meta-analysis provide valuable insights into the accuracy of IOL power calculation formulas for keratoconus patients undergoing cataract surgery, certain limitations should be acknowledged. Most of the currently available evidence originates from retrospective studies with relatively small sample sizes, which may limit the generalizability of the findings. In addition, some formulas appear underrepresented in the literature not necessarily due to inferior performance, but rather because of limited comparative reporting or restricted availability of proprietary algorithms. Moreover, the variability in preoperative measurement techniques utilizing different optical biometers devices, and differences in keratoconus severity classification may introduce heterogeneity across studies. Although SUCRA rankings were used to provide a relative hierarchy of formula performance, these should not be interpreted as definitive evidence of clinical superiority, particularly in the presence of overlapping credible intervals. In addition, key assumptions underlying network meta-analysis, including transitivity and consistency, may not be fully satisfied. Therefore, the results especially subgroup analyses should be considered exploratory and hypothesis-generating rather than definitive guidance for clinical decision-making.
Finally, multiple formulas were excluded due to the limited number of studies presenting them, preventing a comprehensive assessment of their accuracy. The variability in predictive performance across formulas highlights the need for careful selection, particularly in patients with moderate to severe keratoconus. To further refine these findings, future research should focus on larger, well-controlled studies with standardized biometry methods and longer follow-up durations to ensure the long-term stability and clinical reliability of keratoconus-specific formulas.
Conclusion
This systematic review and network meta-analysis demonstrated that Barrett True-K Measured and Barrett True-K Predicted showed the highest predictive accuracy across multiple refractive outcomes, followed by Kane Keratoconus. Subgroup analyses suggested that Barrett True-K formulas performed consistently well across different keratoconus severity levels, although predictive accuracy declined with increasing disease severity. In contrast, traditional formulas, including Hoffer Q, Holladay 1 and 2, and Higgins, generally showed larger refractive errors, particularly in moderate to severe keratoconus.
These findings suggest that keratoconus-specific formulas may improve refractive predictability in patients with keratoconus undergoing cataract surgery and may help reduce the risk of postoperative hyperopic surprise. Additionally, this network meta-analysis provides a comprehensive comparison of available formulas and helps clarify previously inconsistent findings reported in the literature. Nevertheless, given the limited number of studies and methodological heterogeneity among included studies, these findings should be interpreted cautiously. Future research should focus on larger prospective studies, longer follow-up periods, and standardized biometric measurement techniques to further improve the accuracy of IOL power prediction in keratoconus.
Author Contributions
All authors made a significant contribution to the work reported, whether that is in the conception, study design, execution, acquisition of data, analysis and interpretation, or in all these areas; took part in drafting, revising or critically reviewing the article; gave final approval of the version to be published; have agreed on the journal to which the article has been submitted; and agree to be accountable for all aspects of the work.
Funding
There is no funding to report.
Disclosure
The authors report no conflicts of interest in this work.
References
1. Davidson AE, Hayes S, Hardcastle AJ, Tuft SJ. The pathogenesis of keratoconus. Eye. 2014;28(2):189–16. PMID: 24357835; PMCID: PMC3930280. doi:10.1038/eye.2013.278
2. Romero-Jiménez M, Santodomingo-Rubido J, Wolffsohn JS. Keratoconus: a review. Contact Lens Anterior Eye. 2010;33(4):157–166. doi:10.1016/j.clae.2010.04.006
3. Hashemi H, Heydarian S, Hooshmand E, et al. The prevalence and risk factors for keratoconus: a systematic review and meta-analysis. Cornea. 2020;39(2):263–270. doi:10.1097/ICO.0000000000002189
4. Lucas SEM, Burdon KP. Genetic and environmental risk factors for keratoconus. Annu Rev Vis Sci. 2020;6(1):25–46. PMID: 32320633. doi:10.1146/annurev-vision-121219-081723
5. Ghiasian L, Abolfathzadeh N, Manafi N, Hadavandkhani A. Intraocular lens power calculation in keratoconus; A review of literature. J Curr Ophthalmol. 2019;31(2):127–134. PMID: 31317089; PMCID: PMC6611933. doi:10.1016/j.joco.2019.01.011
6. Zare Mehrjerdi MA, Hashemi H, Kalantari F, Rajabi MB, Fallah Tafti MR. Comparison of refractive outcomes of different intraocular lens power calculation formulas in keratoconic patients undergoing phacoemulsification. Iran J Ophthalmol. 2014;26(2):66–71.
7. Haigis W, Lege B, Miller N, Schneider B. Comparison of immersion ultrasound biometry and partial coherence interferometry for intraocular lens calculation according to Haigis. Graefes Arch Clin Exp Ophthalmol. 2000;238(9):765–773. doi:10.1007/s004170000188
8. Barrett GD. An improved universal theoretical formula for intraocular lens power prediction. J Cataract Refract Surg. 1993;19(6):713–720. doi:10.1016/s0886-3350(13)80339-2
9. Kane JX, Connell B, Yip H, et al. Accuracy of intraocular lens power formulas modified for patients with keratoconus. Ophthalmology. 2020;127(8):1037–1042. doi:10.1016/j.ophtha.2020.02.008
10. Abulafia A, Hill WE, Koch DD, Wang L, Barrett GD. Accuracy of the Barrett true-K formula for intraocular lens power prediction after laser in situ keratomileusis or photorefractive keratectomy for myopia. J Cataract Refract Surg. 2016;42(3):363–369. doi:10.1016/j.jcrs.2015.11.039
11. Page MJ, McKenzie JE, Bossuyt PM, et al. The PRISMA 2020 statement: an updated guideline for reporting systematic reviews. BMJ. 2021;29:n71. doi:10.1136/bmj.n71
12. Higgins JPT, Thomas J, Chandler J, et al. Cochrane Handbook for Systematic Reviews of Interventions. Wiley; 2019. doi:10.1002/9781119536604
13. Hutton B, Salanti G, Caldwell DM, et al. The PRISMA extension statement for reporting of systematic reviews incorporating network meta-analyses of health care interventions: checklist and explanations. Ann Intern Med. 2015;162(11):777–784. doi:10.7326/M14-2385
14. Hashemi H, Heidarian S, Seyedian MA, Yekta A, Khabazkhoob M. Evaluation of the results of using toric IOL in keratoconus patients. CLAO J. 2015;41(6):369–375.
15. Savini G. Accuracy of intraocular lens power formulas in keratoconus. J Cataract Refract Surg. 2018;44(10):1183–1189.
16. Kamiya K, Iijima K, Nobuyuki S, et al. Predictability of IOL power calculation in keratoconus. Sci Rep. 2018;8(1):20040. doi:10.1038/s41598-018-20040-w
17. Wang KM, Jun AS, Ladas JG, et al. Accuracy of intraocular lens formulas in eyes with keratoconus. Am J Ophthalmol. 2020;212:26–33. doi:10.1016/j.ajo.2019.11.019
18. Heath MT, Mulpuri L, Kimiagarov E, et al. Intraocular lens power calculations in keratoconus eyes comparing keratometry, total keratometry, and newer formulae. Am J Ophthalmol. 2023. doi:10.1016/j.ajo.2023.03.037
19. Vandevenne MMS, Webers VSC, Segers MHM, et al. Accuracy of intraocular lens calculations in eyes with keratoconus. J Cataract Refract Surg. 2023;49(3):229–233. doi:10.1097/j.jcrs.0000000000001088
20. Yahalomi T, Achiron A, Hecht I, et al. Refractive outcomes of non-toric and toric intraocular lenses in mild, moderate and advanced keratoconus: a systematic review and meta-analysis. J Clin Med. 2022;11(9):2456. doi:10.3390/jcm11092456
21. Bozorg S, Pineda R. Cataract and keratoconus: minimizing complications in intraocular lens calculations. Semin Ophthalmol. 2014;29(5–6):376–379. doi:10.3109/08820538.2014.959193
22. Melles RB, Holladay JT, Chang WJ. Accuracy of intraocular lens calculation formulas. Ophthalmology. 2018;125(2):169–178. doi:10.1016/j.ophtha.2017.08.027
23. Kozhaya K, Chen AJ, Joshi M, et al. Comparison of keratoconus-specific to standard IOL formulas in patients with keratoconus undergoing cataract surgery. J Refract Surg. 2023;39(4):242–248. doi:10.3928/1081597X-20230124-01
24. Kamiya K, Kono Y, Takahashi M, Shoji N. Comparison of simulated keratometry and total refractive power for keratoconus according to the stage of Amsler-Krumeich classification. Sci Rep. 2018;8(1):12436. doi:10.1038/s41598-018-31008-1
25. Voytsekhivskyy OV, Hoffer KJ, Tutchenko L, Cooke DL, Savini G. Accuracy of 24 IOL power calculation methods. J Refract Surg. 2023;39(4):249–256. doi:10.3928/1081597X-20230131-01
26. Aliño JL, Peña-García P, Guliyeva FA, Soria FA, Zein G, Abu-Mustafa SK. MICS with toric intraocular lenses in keratoconus: outcomes and predictability analysis of postoperative refraction. Br J Ophthalmol. 2014;98(3):365–370. doi:10.1136/bjophthalmol-2013-303765
27. Ton Y, Barrett GD, Kleinmann G, Levy A, Assia EI. Toric intraocular lens power calculation in cataract patients with keratoconus. J Cataract Refract Surg. 2021;47(11):1389–1397. doi:10.1097/j.jcrs.0000000000000638
28. Heath MT, Mulpuri L, Kimiagarov E, et al. Intraocular lens power calculations in keratoconus eyes comparing keratometry, total keratometry, and newer formulae. Am J Ophthalmol. 2023;253:206–214. doi:10.1016/j.ajo.2023.03.037
29. Nicholson M, Singh VM, Murthy S, et al. Current concepts in the management of cataract with keratoconus. Indian J Ophthalmol. 2024;72(4):508–519. doi:10.4103/IJO.IJO_1241_23
 © 2026 The Author(s). This work is published and licensed by Dove Medical Press Limited. The
full terms of this license are available at https://www.dovepress.com/terms
and incorporate the Creative Commons Attribution
- Non Commercial (unported, 4.0) License.
By accessing the work you hereby accept the Terms. Non-commercial uses of the work are permitted
without any further permission from Dove Medical Press Limited, provided the work is properly
attributed. For permission for commercial use of this work, please see paragraphs 4.2 and 5 of our Terms.
© 2026 The Author(s). This work is published and licensed by Dove Medical Press Limited. The
full terms of this license are available at https://www.dovepress.com/terms
and incorporate the Creative Commons Attribution
- Non Commercial (unported, 4.0) License.
By accessing the work you hereby accept the Terms. Non-commercial uses of the work are permitted
without any further permission from Dove Medical Press Limited, provided the work is properly
attributed. For permission for commercial use of this work, please see paragraphs 4.2 and 5 of our Terms.
Recommended articles
Case Report: Implantable Collamer Lens for Keratoconus with Splinter Cataract
Aldahan D, AlHilali S
International Medical Case Reports Journal 2024, 17:1009-1011
Published Date: 8 December 2024