Back to Journals » Cancer Management and Research » Volume 12
Prediction and Monitoring Method for Breast Cancer: A Case Study for Data from the University Hospital Centre of Coimbra
Received 12 December 2019
Accepted for publication 29 February 2020
Published 13 March 2020 Volume 2020:12 Pages 1887—1893
DOI https://doi.org/10.2147/CMAR.S242027
Checked for plagiarism Yes
Review by Single anonymous peer review
Peer reviewer comments 2
Editor who approved publication: Dr Antonella D'Anneo
Jin Yue, 1, 2,* Na Zhao, 3,* Liu Liu 1
1School of Mathematics and VC & VR Key Laboratory of Sichuan Province, Sichuan Normal University, Chengdu, People’s Republic of China; 2School of Mathematics, Sichuan University of Arts and Science, Dazhou, People’s Republic of China; 3Department of Clinical Laboratory and Guangdong Provincial Key Laboratory of Occupational Disease Prevention and Treatment, Guangdong Province Hospital for Occupational Disease Prevention and Treatment, Guangzhou, People’s Republic of China
*These authors contributed equally to this work
Correspondence: Liu Liu
Email [email protected]
Abstract: Breast cancer is the second most common cancer in women after skin cancer. Breast cancer can occur in both men and women, but it is far more common in women. Real-time monitoring of breast cancer indicators is becoming increasingly important. It can help create advances in the diagnosis and treatment of breast cancer. In this paper, we provide a nonparametric statistical method to predict and detect breast cancer occur. The exponentially weighted moving average (EWMA) control scheme is based on rank methods so that it is completely nonparametric. It is efficient in detecting the shifts for multivariate processes. A real example data from the University Hospital Centre of Coimbra is given to illustrate this method.
Keywords: nonparametric, EWMA, rank-based method, breast cancer
Introduction
Breast cancer is a malignant tumor (a collection of cancer cells) arising from the cells of the breast.1 Although breast cancer predominantly occurs in women, it can also affect men. This article addresses breast cancer in women. Breast cancer and its complications can affect nearly every part of the body. Breast cancer screening is an important strategy for early detection and to ensure a greater probability of having a good treatment outcome. Robust predictive models based on data that may be collected in routine consultations and blood analysis are sought to provide an important contribution by offering more screening tools, and are important for detecting whether there is a change in the breast cancer index.2,3
Statistical process control (SPC) has been frequently used for fault detection.4–6 One major concern of SPC is whether there has been a change of distribution from the target in the process, that is, the process has gone out of control. Many researchers have discussed and proposed useful charts for detecting whether there is a change in a process. The most commonly used control schemes include the Shewhart chart,7 the CUSUM chart8 and the EWMA chart.9 These proposed control schemes are efficient for fault diagnosis in practice. Statistical properties of a control chart are usually evaluated in terms of the average run length (ARL), that is, the average number of observations required to signal a change for a particular size of the shift. When a process stays IC, control charts with larger ARL (ARL0) are considered performing better. Otherwise, when the process is OC, these charts with smaller ARL (ARL1) are considered better.
Control chart schemes attach increasing importance to biosurveillance studies. For example, Rogerson and Yamada10 proposed a multivariate cumulative sum approach to detect changes in spatial patterns and applied it to county-level breast cancer data in the Northeastern United States. The comparison results suggested that the multivariate chart performed well. Abdollahian and Hayati Rezvan11 applied a multivariate EWMA control chart to monitor patients’ progress after cardiac surgery, in which the multivariate EWMA chart can detect an out-of-control signal that was missed by the univariate EWMA charts. Yue et al12 proposed a new combined risk-adjusted EWMA and Variable life-adjusted display (VLAD) chart for detecting Surgical Outcome Monitoring and Improvement Program (SOMIP) data. In addition, Various kinds of control charts have been used to monitor surgical outcomes.13–15 However, in most surgical contexts, the risk of mortality estimated pre-operatively would vary from patient to patient. Considering this fact, Cook et al16 proposed a risk-adjusted chart to track outcomes in intensive care. Steiner17 proposed a new CUSUM chart to monitor surgical performance in which the risk is adjusted to reflect the surgical risk of each patient. Moreover, many researchers have studied the application of risk-adjusted control charts to assess surgical outcomes.18–20
Otherwise, most control charts require that the monitoring observations be univariate and usually assume that the observations follows a normal distribution. With data becoming complex and high dimensional, the monitoring of multivariate data has become increasingly important in quality control. The classical chart includes the T2 control chart, which was proposed by Hotelling and assumes that the dataset distributions are multivariate normal.21 That is, both the mean vector and variance matrix are known. In addition, a multivariate CUSUM chart based on T2 statistics was proposed by Lowry et al.22 These methods perform well under the multivariate normal distribution assumption. When the underlying distribution and the magnitude of the shifts are both unknown, Yue and Liu23 used the Mahalanobis data depth method to propose a chart for monitoring processes with multivariate quality measurements. In addition, Liu et al24 proposed a new multivariate EWMA chart based on ranks. Their method performs well for detecting a range of changes.
In this paper, based on Liu et al24 we provide a nonparametric statistical method to predict and detect breast cancer occur. The remainder of this paper is organized as follows: in Section 2, we review the existing proposed rank-based control chart. In Section 3, the Breast Cancer Coimbra data are studied to illustrate the performance of the proposed chart. Finally, several remarks conclude the article in Section 4.
Review
Rank-Based Methods
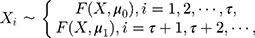
Liu et al25 introduced the rank-based method and assumed that observations  , which are independent, follow the model below:
where  and
and  are the IC location parameter and the OC location parameter, respectively.
  represents the unknown change point.
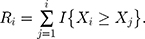
  is an unknown continuous distribution function. Let
  denote the
  th sequential rank; the formula for the rank of
  among
among  is as follows25
The standardized sequential rank is given by
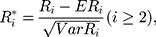
where

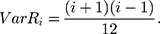

Therefore,

Therefore, the distribution of  is defined in the interval
The asymptotic distribution of  is
is  as
as  25.
25.
EWMA Chart for a Multivariate Process
An EWMA control scheme begins with a time series graph. It is based on the statistic

together with UCL’s and LCL’s.  is a smoothing parameter. The sequentially recorded observations,
  , can be individually observed values from the process. The process is considered OC and action should be taken whenever
  falls outside the range of the control limits. The EWMA chart performs well for small shifts with an appropriate smoothing parameter.26
We cite this method proposed by Liu et al27 in the context of a multivariate process, and they supposed that there are  independent observations from an unknown multivariate continuous distribution with dimensionality
  . That is,
  where
where  There are
  characteristics of interest to be examined. For a set of variables,
  which represents the
  th characteristic with
  observations, the rank-based method can be used to construct statistics. When the observations are
  -dimensional, the
  th observation is
  For the
  th component,
 denotes the
  th standardized sequential rank with the arrival of the
  th component
  Therefore, the vectors
  can be obtained. In addition, each component
  follows the same uniform distribution as
  Then, the EWMA statistics can be constructed, which are based on T2 statistics. We cite the the method proposed by Liu et al0,27 and the EWMA statistics are given by

where  represents the smoothing parameter.
  represents the
  -dimensional identity matrix. If there is no a priori information given, different smoothing parameters are needed for different components; then,
  are used, and the starting value is
  The process is considered to be out of control, and action should be taken whenever
  where
where  is the control limit. We cite the method proposed by Liu et al27 the covariance matrix of
  is as follows:
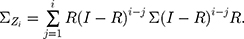
In particular, 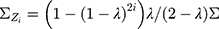 when
when 
 is a fixed value. Usually, we take the limit form,
 , the covariance matrix of
  , is estimated from samples in practice. We use this method for detection in the Breast Cancer Coimbra dataset.
Beast Cancer Coimbra Data
Data Source
For each of the 116 participants several clinical features were observed or measured. Clinical features were observed or measured for 64 patients with breast cancer and 52 healthy controls. Quantitative attributes including age (years), BMI (kg/m2), glucose (mg/dL), insulin ( U/mL), HOMA, leptin (ng/mL), adiponectin (
 g/mL), resistin (ng/mL), and MCP-1 (pg/dL).28 The characteristics are anthropometric data and parameters which can be gathered in routine blood analysis. The characteristics can potentially be used as a biomarker of breast cancer. The data are publicly available in the “ Breast Cancer Coimbra Data Set” from the UCI Machine Learning Repository and can be downloaded from the web site http://archive.ics.uci.edu/mL/datasets/Breast+Cancer+Coimbra. In this work, we aim to monitor the Beast Cancer Coimbra data and identify whether there are changes.
 |
Figure 1 The corresponding normal Q-Q plots. |
A quantile-quantile (Q-Q) plot of each region, which includes 116 historical observations, is presented in Figure 1. Figure 1 suggests that the normality assumption for the data are invalid, which leads us to reject the null hypothesis that the data are normally distributed. Therefore, a nonparametric control chart might be more suitable for this dataset. The correlation of nine attributes is shown in Figure 2 for a total of  lines. Figure 2 shows that the cross-correlation is not stable. Therefore, we update the covariance matrix with the arrival of new observations. It should be noted that the covariance matrix
  is updated, as presented in Section 3.2.
 |
Figure 2 Correlations of the nine attributes. |
Data Analysis
The proposed multivariate EWMA control chart is used to monitor the Breast Cancer Coimbra data, which may have a certain correlation. We cite the spectral analysis,29,30 which is used to identify interepidemic periods. Based on the spectral analysis, the trend in the incidence data are determined. Inspired by Liu et al27 the procedure comprises the following 3 steps. First, the Breast Cancer Coimbra data are preprocessed. In step II, the temporal behavior of the period is investigated. Second, nonlinear least squares fitting is used for the fitting analysis. This trend is then removed by subtracting the nonlinear least squares fitted curve from the data, thereby yielding the residual time-series data. Third, the obtained residual time-series datasets are monitored. The vertical coordinates of Figure 3 represent the power spectral density (PSD). Figure 3 indicates the numbers of the maximum entropy method (MEM) spectral periods.
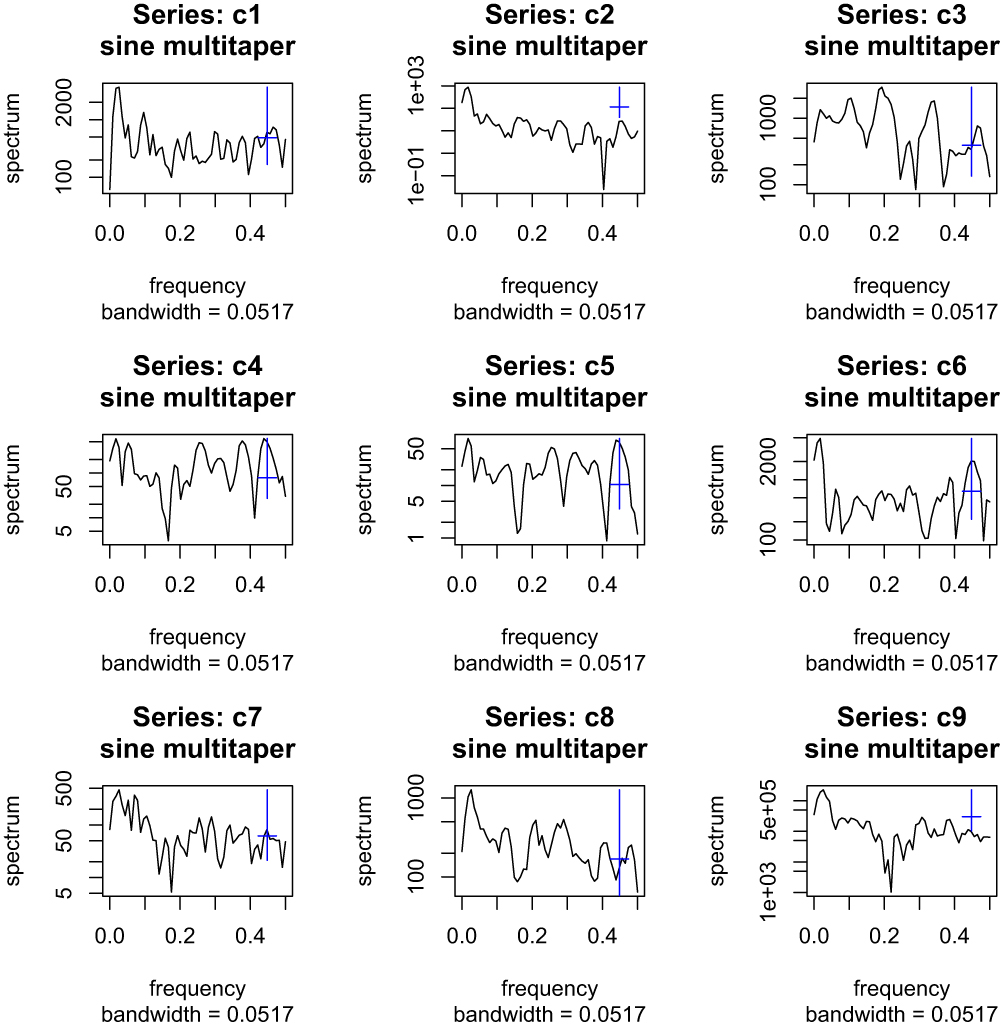 |
Figure 3 Spectral analysis of the breast cancer coimbra data series. |
The Breast Cancer Coimbra data indicate changes after observation 52. Therefore, we use the 1~50 IC data to find the control limits. These control charts have the same IC zero-state ARL. Then, we use the control limits to monitor the remainder of the process. The EWMA control chart of the residual data are presented in Figure 4. Figure 4 shows that the EWMA statistics fall outside the range of the control limits at observation 53, suggesting that the proposed method can provide relatively early detection in a process.
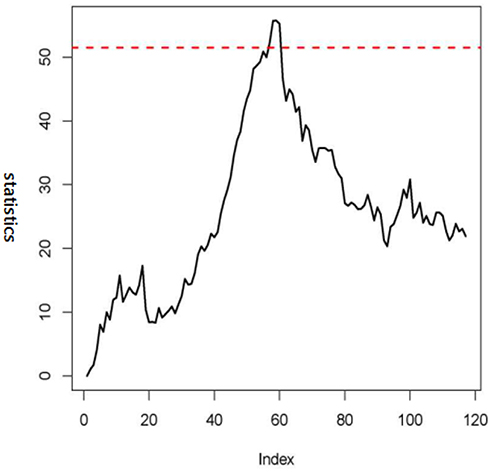 |
Figure 4 EWMA control chart for the breast cancer coimbra data. |
Conclusions
In this paper, the Breast Cancer Coimbra data are provided for analysis. We use a nonparametric statistical process control chart to monitor them. Spectral analysis is also reviewed and conducted to investigate the periodicities of shorter time series, and then nonlinear least squares fitting is used for the fitting analysis. Finally, the residual data series are obtained and monitored. The Breast Cancer Coimbra data show that the statistics fall outside the control limit at observation 53. It means there is a significant sign at this point to show one has high risk to get the Breast Cancer. Future diagnosis should be done by relevant medicine specialist.
Acknowledgments
The authors thank Dr Hongying Qu for his many helpful comments that have resulted in significant improvements to the article; Zhao’s research was supported by the Natural Sciences Foundation of China (81903269), Natural Science Foundation of Guangdong (2018A030313569) and Guangdong Provincial Key Laboratory of Occupational Disease Prevention and Treatment (2017B030314152). Liu’s research was supported by the Natural Sciences Foundation of China (71872146) and the Grant of the VC & VR Key Laboratory of Sichuan Province.
Disclosure
The authors report no conflicts of interest in this work.
References
1. Sarfstein R, Nagaraj K, LeRoith D, Werner H. Differential effects of insulin and IGF1 receptors on ERK and AKT subcellular distribution in breast cancer cells. Cells. 2019;8(12):1499. doi:10.3390/cells8121499
2. Dettin M, Sieni E, Zamuner A, et al. A novel 3D scaffold for cell growth to asses electroporation efficacy. Cells. 2019;8(11):1470. doi:10.3390/cells8111470
3. Schochter F, Friedl TWP, deGregorio A, et al. Are Circulating Tumor Cells (CTCs) ready for clinical use in breast cancer? An overview of completed and ongoing trials using CTCs for clinical treatment decisions. Cells. 2019;8(11):1412. doi:10.3390/cells8111412
4. Das S, Duggal P, Roy R, et al. Identification of hot and cold spots in genome of Mycobacterium tuberculosis using Shewhart control charts. Sci Rep. 2012;2(1):297. doi:10.1038/srep00297
5. Liu L, Chen B, Zhang J, Zi X. Adaptive Phase II nonparametric EWMA control chart with variable sampling interval. Qual Reliab Eng Int. 2015;31(1):15–26. doi:10.1002/qre.v31.1
6. Monmasson E, Idkhajine L, Cirstea M, et al. FPGAs in industrial control applications. IEEE Trans Ind Inf. 2011;7(2):224–243. doi:10.1109/TII.2011.2123908
7. Champ CW, Woodall WH. Signal probabilities for runs supplementing a shewhart control chart. Commun Stat Simul Comput. 1997;26(4):1347–1360.
8. Crosier RB. A new two-sided cumulative sum quality control scheme. Technometrics. 1986;28(3):187–194. doi:10.1080/00401706.1986.10488126
9. Hunter JS. The exponentially weighted moving average. J Qual Technol. 1986;18(4):203–210. doi:10.1080/00224065.1986.11979014
10. Rogerson PA, Yamada I. Monitoring change in spatial patterns of disease: comparing univariate and multivariate cumulative sum approaches. Stat Med. 2004;23(14):2195–2214. doi:10.1002/(ISSN)1097-0258
11. Abdollahian M, Hayati Rezvan P. Multivariate exponentially weighted moving average chart for monitoring patient’s progress after cardiac surgery.
12. Yue J, Lai X, Liu L, Lai PB. A new VLAD-based control chart for detecting surgical outcomes. Stat Med. 2017;36(28):4540–4547. doi:10.1002/sim.7362
13. Treasure T, Taylor K, Black N. Independent Review of Adult Cardiac Surgery-United Bristol. Bristol: Health Care Trust; 1997.
14. Nix AB, Rowlands RJ, Kemp KW, Wilson DW, Griffiths K. Internal quality control in clinical chemistry: a teaching review. Stat Med. 1987;6(4):425–440. doi:10.1002/(ISSN)1097-0258
15. Grigg OA, Farewell VT, Spiegelhalter DJ. Use of risk-adjusted CUSUM and RSPRT charts for monitoring in medical contexts. Stat Methods Med Res. 2003;12(2):147–170. doi:10.1177/096228020301200205
16. Cook DA, Steiner SH, Cook RJ, Farewell VT, Morton AP. Monitoring the evolutionary process of quality:~risk-adjusted charting to track outcomes in intensive care. Crit Care Med. 2003;31(6):1676–1682. doi:10.1097/01.CCM.0000065273.63224.A8
17. Steiner SH, Cook RJ, Farewell VT, Treasure T. Monitoring surgical performance using risk adjusted cumulative sum charts. Biostatistics. 2000;1(4):441–452. doi:10.1093/biostatistics/1.4.441
18. Steiner SH, Jones M. Risk-adjusted survival time monitoring with an updating exponentially weighted moving average (EWMA) control chart. Stat Med. 2010;29(4):444–454. doi:10.1002/sim.3788
19. Grigg OA, Farewell VT. A risk-adjusted sets method for monitoring adverse medical outcomes. Stat Med. 2004;23(10):1593–1602. doi:10.1002/(ISSN)1097-0258
20. Grigg OA, Spiegelhalter DJ. A sample risk-adjusted exponentially weighted moving average. J Am Stat Assoc. 2007;102(477):140–152. doi:10.1198/016214506000001121
21. Hotelling H. Multivariate quality control–illustrated by air testing of sample bombsights. In: Eisenhart C, Hastay MW, Wallis WA, editors. Techniques of Statistical Analysis. New York: McGraw Hill; 1947:111–184.
22. Lowry CA, Woodall WH, Champ CW, Rigdon SE. A multivariate exponentially weighted moving average control chart. Technometrics. 1992;34(1):46–53. doi:10.2307/1269551
23. Yue J, Liu L. Multivariate nonparametric control chart with variable sampling interval. Appl Math Model. 2017;52:603–612. doi:10.1016/j.apm.2017.08.005
24. Liu L, Zi X, Zhang J, Wang Z. A sequential rank–based nonparametric adaptive EWMA control chart. Commun Stat Simul Comput. 2013;42(4):841–859. doi:10.1080/03610918.2012.655829
25. Liu L, Zhang J, Zi X. Dual nonparametric CUSUM control chart based on ranks. Commun Stat Simul Comput. 2015;44:756–772. doi:10.1080/03610918.2013.784985
26. Lucas JM, Saccucci MS. Exponentially weighted moving average control schemes: properties and enhancements. Technometrics. 1990;32(1):1–12. doi:10.1080/00401706.1990.10484583
27. Liu L, Yue J, Huang JP, Lai X, Zhang J. Multivariate nonparametric chart for influenza epidemic monitoring. Sci Rep. 2019;9(1):17472. doi:10.1038/s41598-019-53908-6
28. Patricio M, Pereira JR, Crisostomo J, et al. Using resistin, glucose, age and BMI to predict the presence of breast cancer. BMC Cancer. 2018;18(1):29. doi:10.1186/s12885-017-3877-1
29. Seidou T, Ohtomo N. Maximum entropy spectral analysis of time–series data from combustion MHD plasma. Jpn J Appl Phys. 1985;24(Part 1, No. 9):1204–1211. doi:10.1143/JJAP.24.1204
30. Sawada Y, Ohtomo N, Tanaka Y, et al. New technique for time series analysis combining the maximum entropy method and non–linear least squares method: its value in heart rate variability analysis. Med Biol Eng Comput. 1977;35(4):318–322. doi:10.1007/BF02534083
 © 2020 The Author(s). This work is published and licensed by Dove Medical Press Limited. The
full terms of this license are available at https://www.dovepress.com/terms
and incorporate the Creative Commons Attribution
- Non Commercial (unported, 3.0) License.
By accessing the work you hereby accept the Terms. Non-commercial uses of the work are permitted
without any further permission from Dove Medical Press Limited, provided the work is properly
attributed. For permission for commercial use of this work, please see paragraphs 4.2 and 5 of our Terms.
© 2020 The Author(s). This work is published and licensed by Dove Medical Press Limited. The
full terms of this license are available at https://www.dovepress.com/terms
and incorporate the Creative Commons Attribution
- Non Commercial (unported, 3.0) License.
By accessing the work you hereby accept the Terms. Non-commercial uses of the work are permitted
without any further permission from Dove Medical Press Limited, provided the work is properly
attributed. For permission for commercial use of this work, please see paragraphs 4.2 and 5 of our Terms.