Back to Journals » Clinical Interventions in Aging » Volume 15
Predicting the One-Year Prognosis and Mortality of Patients with Acute Ischemic Stroke Using Red Blood Cell Distribution Width Before Intravenous Thrombolysis
Authors Ye WY ![]() , Li J, Li X, Yang XZ, Weng YY, Xiang WW, Zhang O, Ke BX, Zhang X
, Li J, Li X, Yang XZ, Weng YY, Xiang WW, Zhang O, Ke BX, Zhang X
Received 9 October 2019
Accepted for publication 28 December 2019
Published 20 February 2020 Volume 2020:15 Pages 255—263
DOI https://doi.org/10.2147/CIA.S233701
Checked for plagiarism Yes
Review by Single anonymous peer review
Peer reviewer comments 2
Editor who approved publication: Dr Zhi-Ying Wu
Wei-Yi Ye,1,2 Jia Li,2 Xiang Li,2 Xue-Zhi Yang,2 Yi-Yun Weng,2 Wei-Wei Xiang,3 Ou Zhang,2 Bo-Xi Ke,4,* Xu Zhang2,*
1Shaoxing People’s Hospital (Shaoxing Hospital, Zhejiang University School of Medicine), Zhejiang, People’s Republic of China; 2Department of Neurology, The First Affiliated Hospital of Wenzhou Medical University, Wenzhou, People’s Republic of China; 3School of Mental Health, Wenzhou Medical University, Wenzhou, People’s Republic of China; 4Taizhou Central Hospital (Taizhou University Hospital), Zhejiang, People’s Republic of China
*These authors contributed equally to this work
Correspondence: Xu Zhang
Department of Neurology, The First Affiliated Hospital of Wenzhou Medical University, Wenzhou 325000, People’s Republic of China
Tel +86 577 5557 9372
Fax +86 577 5557 9318
Email [email protected]
Bo-Xi Ke
Taizhou Central Hospital (Taizhou University Hospital), Zhejiang 318000, People’s Republic of China
Tel +86 139 5769 8220
Email [email protected]
Purpose: Red blood cell (RBC) distribution width (RDW) is known to reflect the heterogeneity of RBC volume, which may be associated with cardiovascular events or mortality after myocardial infarction. However, the association between RDW and stroke, especially regarding endpoints such as death, remains ambiguous. This study aimed to explore the prognostic value of RDW and its effect on mortality among patients with acute ischemic stroke (AIS) undergoing intravenous thrombolysis (IVT) after one year.
Patients and Methods: We retrospectively reviewed patients with AIS treated with IVT between January 2016 and March 2018. We grouped the patients according to modified ranking scale (MRS) scores as follows:0– 2, favorable functional outcome group; and 3– 6, unfavorable functional outcome. Predictors were determined using multivariate logistic regression (MVLR). The area under receiver-operating characteristic curve (AUC) was used to evaluate the predictive capability of variables. Furthermore, the Cox proportional hazard model was used to assess the contribution of risk factors to the outcome of death at one year later.
Results: MVLR analysis showed that RDW (odds ratio [OR], 1.179; 95% confidence interval [CI], 0.900– 1.545; p = 0.232) was not an independent predictor of unfavorable functional outcome, but it (OR 1.371; 95% CI 1.109– 1.696; p = 0.004) was an independent biomarker for all-cause mortality. The optimal RDW cut-off value to predict mortality was 14.65% (sensitivity: 42%, specificity: 88.3%, AUC: 0.649, p < 0.001). Furthermore, higher RDW (hazard ratio, 2.860; 95% CI, 1.724– 4.745; p < 0.001) indicated a greater risk of death.
Conclusion: The baseline RDW is a potential predictor of mortality in patients with AIS undergoing IVT, but RDW might not be associated with worse survival function among stroke survivors, which will help us to improve treatments and the management of patients with AIS.
Keywords: red blood cells, death, inflammatory, cerebrovascular accident, fibrinolytic therapy, predictor
Introduction
Red blood cell distribution width (RDW) is the most reliable index for differentiating between iron deficiency anemia and thalassemia trait.1 It has recently been shown to predict mortality in patients with severe sepsis or septics hock,2 acute kidneyinjury,3 acute heart failure, and acute myocardialinfarction4,5 as well as in critically ill and elderly patients.6,7 In fact, RDW is associated with an increased risk of perioperative stroke-related death in patients with valvular heart disease undergoing elective valvular surgery.8 A previous study has demonstrated a marked increase in the incidence of new-onset heart failure and subsequent death after discharge from hospital in patients with increased RDW.4 In addition, a recent report has hypothesized that RDW is a dynamic marker of risk in patients with sepsis based on the finding that an increase in RDW from baseline showed a correlation with prolonged hospital stay.2 Another epidemiologic cohort study has speculated that RDW may be a reliable marker of death not only in chronic conditions, but also in acute diseases.3
Increased RDW may comprehensively represent a variety of harmful biological mechanisms. Elevated RDW values have been shown to reflect malnutrition, liver failure, and renal dysfunction9 and to be a possible marker for accelerated red blood cell (RBC) destruction or ineffective RBC production.10 Emerging literature points to the potential association of RDW with inflammation.11 Abnormal increases in RDW can lead to carotid intima thickening, which accelerates atherosclerosis—a major risk factor for cerebral infarction.12,13
Stroke has been known to be the second leading cause of death and the third leading cause of disability worldwide,14 however, previous studies have failed to identify the prognostic role of RDW in patients with stroke, especially regarding endpoints such as death, remains ambiguous. In laboratories, RDW is a routinely used index of whole blood count. This parameter can be dynamically monitored with ease because the procedure involved in RDW determination is rapid and inexpensive. If the increased RDW can be used to detect major complications in time to strengthen comprehensive treatment and reduce mortality, the validation of RDW as an effective parameter for predicting outcomes of clinical conditions could have far-reaching implications in clinical diagnostics. The present study was designed to assess the prognostic role of RDW on 1-year mortality in patients with acute ischemic stroke (AIS).
Materials and Methods
Study Design and Population
We retrospectively analyzed the clinical and relevant imaging data of 570 patients with AIS who were treated consecutively with intravenous thrombolysis (IVT) in the First Affiliated Hospital of Wenzhou Medical University between January 2016 and March 2018. The diagnosis of AIS was performed by a neurologist specializing in stroke.
The main inclusion criteria were as follows: age, ≥18 years; onset-to-treatment time, <4.5 h; symptoms of neurological impairment caused by acute cerebral infarction; and informed consent signed by the patient or family member.
Exclusion criteria were as follows: thrombectomy after thrombolysis, active internal hemorrhage, intracranial tumor, cerebral aneurysm or recent cerebral hemorrhage, evidence of active bleeding or trauma (such as fracture) on physical examination, and major surgery in the past two weeks. In addition, cases with incomplete follow-up data and clinical data were excluded.
Finally, 480 patients were included in the current study after excluding 90 patients (20, beyond the therapeutic window; 13, recent cerebral hemorrhage; 6, intracranial tumor; 21, incomplete follow-up data; and 30, incomplete clinical data). The study was approved by the ethics committee of our institution.
The NIH Stroke Scale (NIHSS) score, which has a score range of 0–42, was used to assess the degree of neurological deficit in patients with stroke; the higher the score, the greater the severity of neurological damage. We recorded the patients’ NIHSS scores on admission and at discharge. Trial of ORG 10172 in acute stroke treatment classification was performed in all patients.
We grouped the patients according to the modified ranking scale (MRS) scores as follows: 0–2, favorable functional outcome; and 3–6, unfavorable functional outcome.
Patients underwent cranial baseline brain computed tomography (CT)/magnetic resonance (MR) imaging or cerebral vascular examinations (for example, CT angiography, CT perfusion, and MR angiography).
Primary Predictor Variable
Emergency blood samples were collected on admission using an ethylene diamine tetra acetic acid catheter. Within one hour after the sample was collected, the whole blood cell count was performed using an automatic hematology analyzer (Sysmex Company, XE-2100, Japan). We also documented existing comorbidities, such as hypertension, diabetes, hyperlipidemia, and heart disease, and blood pressure and blood sugar at the time of admission, which are risk factors for stroke. The expected value of RDW was 0.0% to 15.0%.
Follow- Up and Study Endpoints
In this study, the recovery of neurological function of all patients after one year was recorded. We classified the MRS scores of 0–2 as a favorable functional outcome and 3–6 as an unfavorable functional outcome; one-year all-cause mortality was the primary endpoint. The follow-updata were collected during outpatient visits or using standardized telephone questionnaires.
Statistical Analysis
Continuous variables that followed a normal distribution were expressed as means ± standard deviation (SD) and analyzed by one-way analysis of variance, while continuous variables with a non-normal distribution were represented as median (interquartile range [IQR]) and analyzed by Mann–Whitney U-test. Categorical variables are expressed as percentage numbers and analyzed by χ2 test or Fischer’s exact test. Variables that differed significantly with p values of <0.05 were selected as covariates for univariate and multivariate logistic regression analysis. Odds ratios (ORs) and their 95% confidence intervals were calculated. The optimal cut-off values were calculated based on the area under the receiver-operating characteristic (ROC) curve (AUC). The risk of a future clinical event in an individual patient was assessed by Cox multivariate proportional hazards regression analysis. All statistical analyses with p values of <0.05 were considered statistically significant. We conducted all statistical analyses using SPSS version 25.0 (SPSS Inc., Chicago, Illinois, USA).
Results
Clinical Characteristics
In this study, medical records of 480 patients were reviewed and included. The baseline features of all the included patients are shown in Table 1. Briefly, the median age of the studied patients was 71 (IQR, 16) years, and 37.5% of the patients were women. The median NIHSS score on admission was 7 (IQR, 10) and the mean RDW score was 13.76 (SD, 1.21). Furthermore, 159 subjects were smokers and 144 subjects consumed alcohol.
 |
Table 1 Detailed Baseline and Clinical Features of the Patients |
Association Between RDW Values and Clinical Prognosis
Among the 480 patients included, 242 (MRS,0–2) had a good prognosis and 238 (MRS,3–6) had a poor prognosis. Detailed baseline and clinical characteristics of the patients are summarized in Table 1. By comparison (favorable functional outcome group vs unfavorable functional outcome group), NIHSS score at admission (median: 13 [IQR, 11] vs 4 [IQR, 5]; p < 0.001), NIHSS score at discharge (median: 10 [IQR, 9] vs 2 [IQR, 3]; p < 0.001), age (median: 75 [IQR, 15] vs 68 [IQR, 15]; p < 0.001), RDW values (13.95 ± 1.37 vs 13.57 ± 0.99; p = 0.001), and sex (women: 43.7% vs 31.4%; p = 0.005) were significantly different between the two groups.
Then we screened out the factors that predicted the outcome of poor function, according to a logistic regression analysis of variables that differed significantly (p < 0.05), only three factors were screened out, which were NIHSS score at discharge (multivariate analysis OR, 1.400; 95% CI, 1.268–1.546; p < 0.001), age (multivariate analysis OR, 1.058; 95% CI, 1.028–1.088; p < 0.001) and previous stroke or transient ischemic attack (multivariate analysis OR, 2.533; 95% CI, 1.279–5.016; p = 0.008) (Table 2). RDW did not show a significant correlation with clinical outcome after one year (multivariate analysis OR, 1.179; 95% CI, 0.900–1.545; p = 0.232).
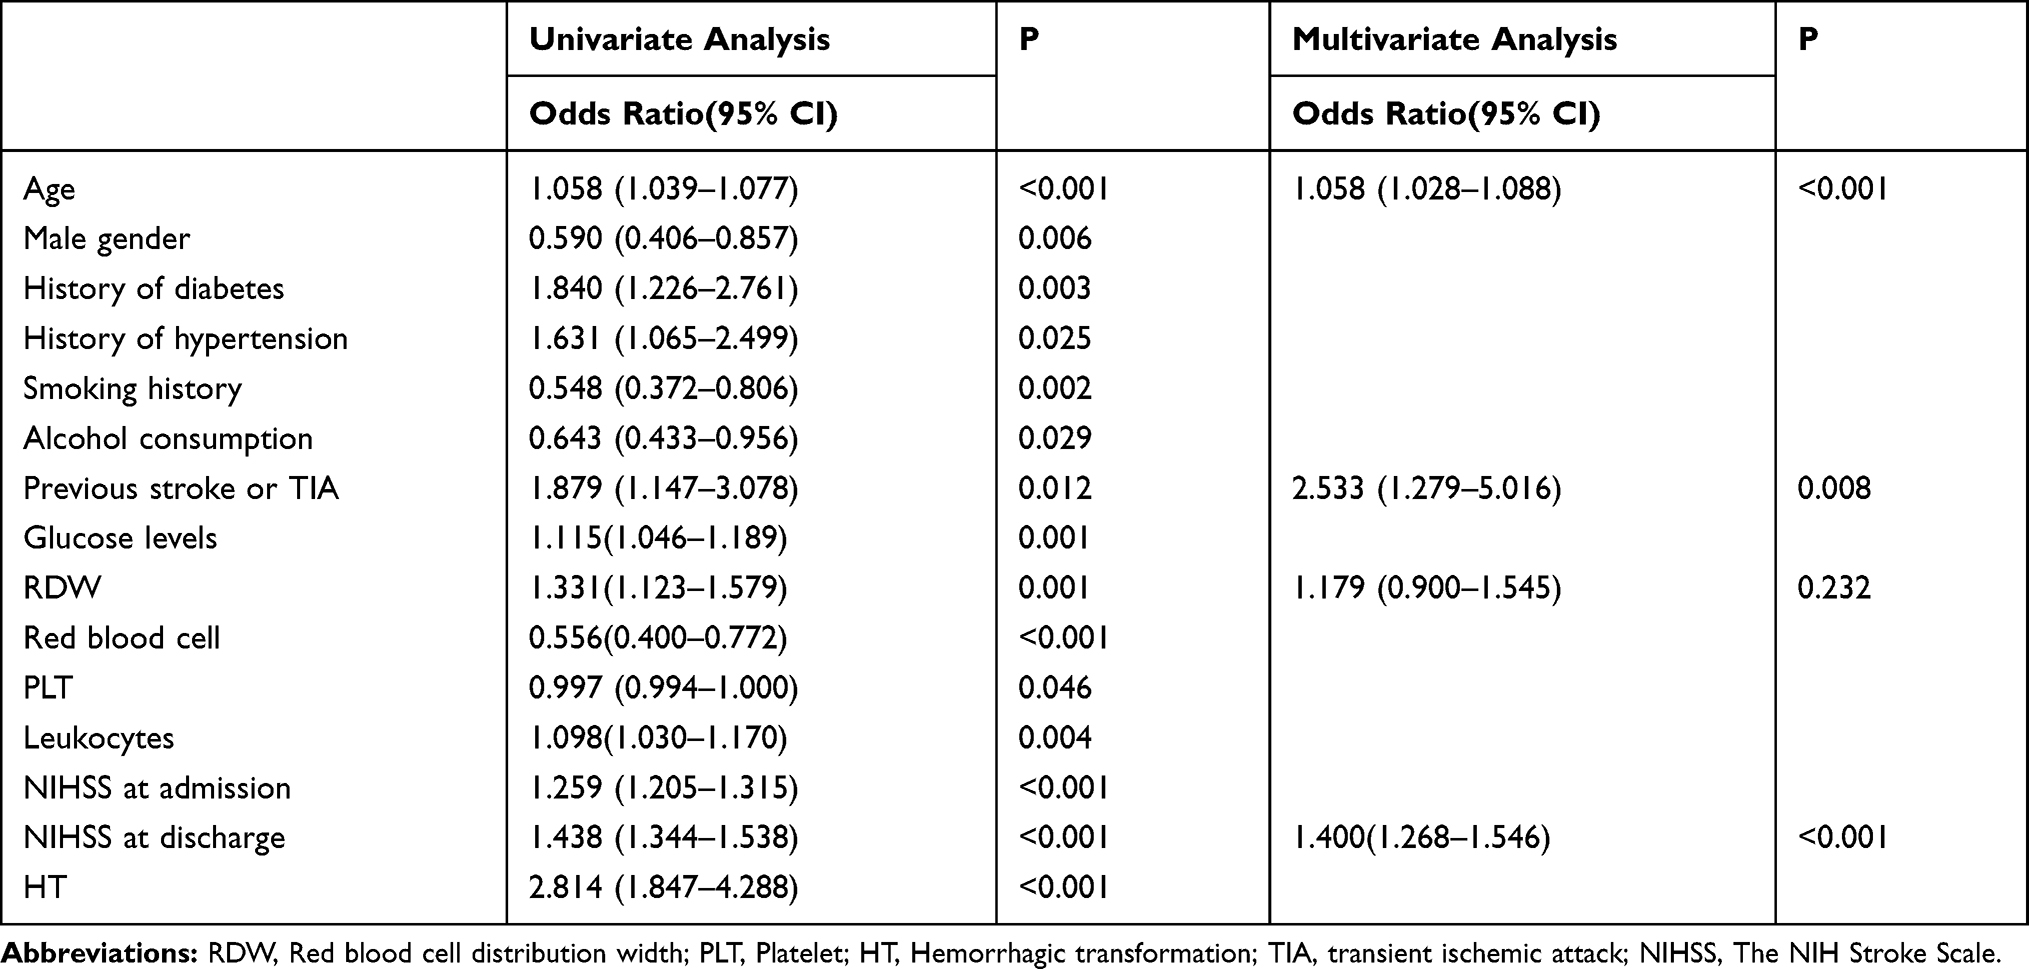 |
Table 2 The Logistic Regression Analyses of Predictors to Unfavorable Functional Outcome in 1 Year |
Association Between RDW Values and Mortality
The primary endpoint (death) was observed in 55 patients. NIHSS scores at admission (p < 0.001) and discharge (p < 0.001), age (p < 0.001), diabetes (p = 0.026), bleeding transformation (p = 0.011), RDW (p < 0.001), and RBC (p = 0.001) were significantly different, as shown by the univariate analysis. Multivariate analysis showed that NIHSS score at discharge (OR, 1.211; 95% CI, 1.129–1.299; p < 0.001) and age (OR, 1.087; 95% CI, 1.048–1.128; p < 0.001) remained important prognostic factors of mortality. Besides, individuals with higher RDW (OR, 1.371; 95% CI, 1.109–1.696; p = 0.004) had a higher risk of all-causemortality. The final multivariable model is shown in Table 3.
 |
Table 3 The Logistic Regression Analyses of Predictors to Mortality in 1 Year |
Age was highly significant in death assessment. For further analysis, we divided the patients into two groups depending on their age (high: age > 70; low: age ≤ 70) according to the median age. Then, we evaluated the relationship between RDW and death outcome in both the age-basedgroups. It is interesting to know that after adjusting various confounding variables, RDW value was significantly different in both the groups (age > 70 group: multivariate OR, 1.342; 95% CI, 1.008–1.788; p = 0.044; age ≤ 70 group: multivariate OR, 1.445; 95% CI, 1.034–2.021; p = 0.031).
Based on ROC analysis, the best cut-off RDW value that predicts mortality was 14.65% (AUC = 0.649; 95% CI, 0.569–0.730; p < 0.001). At this threshold, a sensitivity of 42.0% and specificity of 88.3% were observed (Table 4).
 |
Table 4 The Baseline and Procedural Characteristics According to the Biomarker |
We drew the ROC curve based on the traditional markers of risk (basic NIHSS score + age) and another RDW-richmodel (Figure 1). After adding new risk markers, there were higher significant correlations with unfavorable clinical outcome (AUC = 0.813; 95% CI, 0.767–0.859; p < 0.001).
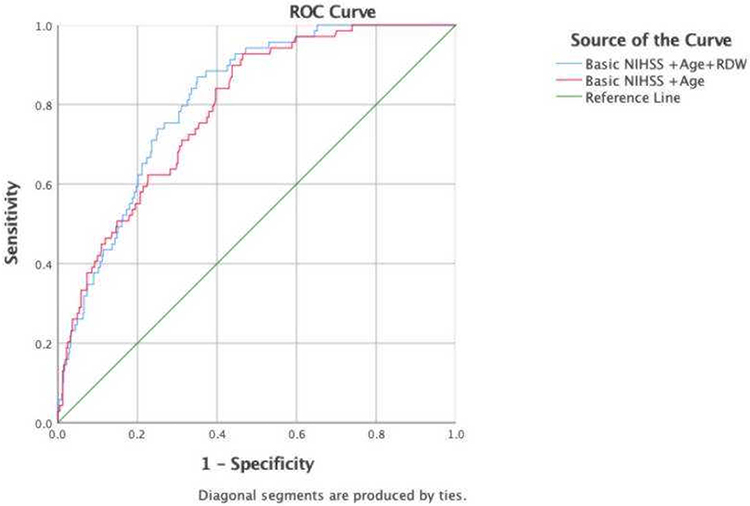 |
Figure 1 Receiver-operating characteristic (ROC) curve displayed of multivariate model features The receiver-operating characteristic (ROC) curve based on the classic risk factors (NIHSS+Age) and multivariable model enriched with RDW. After adding RDW, there were higher significant correlations with mortality (AUC =0.813; 95% CI 0.767–0.859; p<0.001). Abbreviations: RDW, red blood cell distribution width; NIHSS, The NIH Stroke Scale; AUC, area under the ROC curve. |
Multivariate Cox regression proportional hazard model analyses were further performed after adjusting the possible confounding effect. As predicted, there was a positive correlation between RDW (HR, 2.860; 95% CI, 1.724–4.745; p < 0.001) and mortality risk (Table 5, Figure 2).
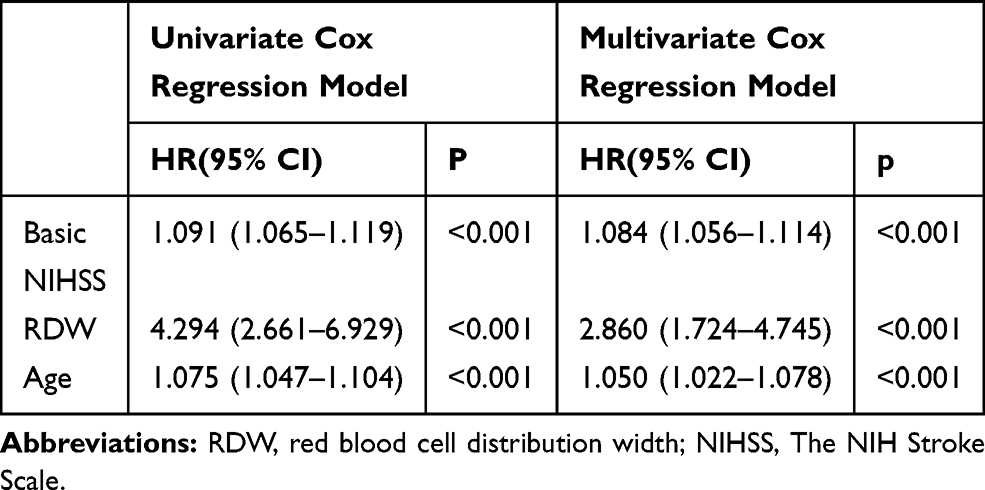 |
Table 5 The Cox Regression Model Analyses Assessment the Death Risk |
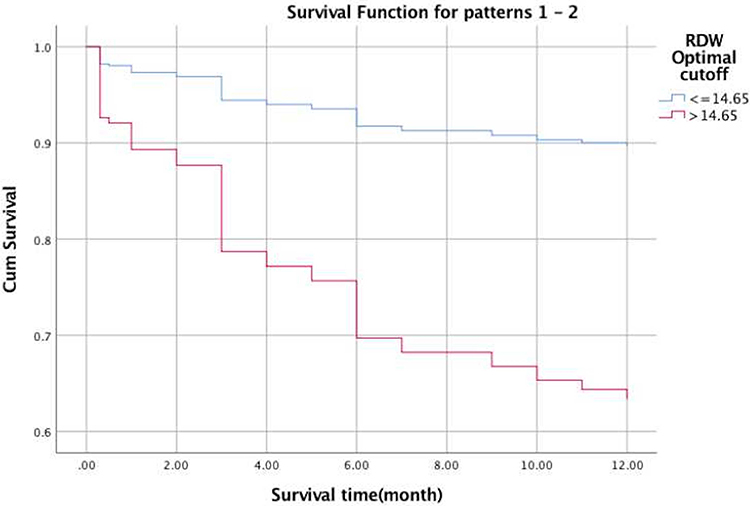 |
Figure 2 Death risk assessment using multivariate cox regression model analyses. Using cox survival curves after adjusting confounding effect. As shown in the figure, higher RDW indicated greater risk of death (HR 2.860; 95% CI 1.724–4.745; p <0.001). Abbreviation: RDW, Red blood cell distribution width. |
Discussion
The study suggests that RDW assessment at admission in emergency department (ED) may be an independent biomarker of death in patients with AIS who are treated with IVT.
A study involving 15,852 community-dwellingadults showed that higher RDW was strongly associated with the risk of all-cause mortality.15 Two previous studies have shown that an increase in RDW values may increase the incidence rate of a cardiovascular event in people with a coronary disease or heart failure.9,16 Furthermore, evidence suggests that RDW could be a novel prognostic biomarker in esophageal and hepatocellular cancer.17,18 In addition, two recent reports have demonstrated the effectiveness of RDW in predicting postoperative damage to the central nervoussystem.19,20 Moreover, other previous studies have reported that RDW may provide prognostic information for the functional outcome of stroke patients.21,22
The cause and mechanism underlying the association between RDW and mortality risk are not clearly known yet. Salvagno et al recently summarized the clinical significance of RDW in several biological and metabolic abnormalities, including shorter telomere lengths, increased erythrocyte fragmentation, and release of iron contained in the hemoglobin molecules.10 Felker et al provided a variety of novel insights into the relationship between RDW and outcome under conditions, such as nutritional deficiencies, renal dysfunction, hepatic congestion, and inflammatory stress.9 If the patient has a high RDW initially, parenteral nutrition should be actively provided, and the daily energy supply should be guaranteed after admission, which may be helpful in improving the one-yearsurvival rate. In addition, it was reported that oxidative stress might contribute to anisocytosis.23
A number of indicators, including anemia and RBC levels, have been proposed as strong predictors of cardiovascular disease and mortality in different populations.24–26 However, the association between RDW and death was found to be independent of baseline hemoglobin level and mean corpuscularvolume.27 In addition, in individuals with asymptomatic heart failure, the risk of all-cause mortality from the highest quartile of baseline RDW is nearly 80% higher than that of the lowest quartile, similar to C-reactive protein (CRP). Unlike the detection of new cardiovascular risk factors, RDW detection is cost-effective.16 RDW was observed to be a better prognostic marker than NT-pro-BNPin patients with pulmonary hypertension and right-sidedheart failure.27 In particular, RDW was found to be an effective and independent predictor of death in pulmonary embolism, which usually requires accurate and rapid identification and timely risk stratification under emergencyconditions.28 Therefore, in patients with high RDW before thrombolysis, other cardiac indicators may require special attention, and this information can be used to help actively treat the primary disease and identify the cause of stroke. Among the proposed functional outcome measures, higher neutrophil-lymphocyte ratio and platelet distribution width are known to be predictive of clinical outcomes and 3-month mortality in patients with AIS.29–31 These indicators, along with RDW values, can be easily measured by conventional whole blood analysis. Therefore, using a prognostic approach that combines these outcome measures to predict long- or short-term mortality in patients with AIS who are treated with IVT would be a more effective, convenient, and innovative alternative to existing clinical diagnostic methods.
Nonetheless, the exact physiological mechanism of the relationship between RDW and mortality from ischemic stroke after IVT is unclear. RDW has recently been related to adverse outcomes in patients with atherosclerosis.12,13 The RDW value is positively correlated with cholesterol content of the erythrocyte membrane,32 which increases the volume of the necrotic lipid core and leads to the rupture of atherosclerotic plaque.33 This information suggests that hyperlipidemia can be observed as early as possible before the vascular condition is evaluated in patients with high RDW, which may be beneficial to their prognosis. Inflammation is a critical issue in atherosclerosis, ischemia, and ischemic stroke.34,35 RDW increases the levels of plasma inflammatory biomarkers such as interferon γ and colony-forming unit erythroid cells to reduce endothelial nitric oxide production.35 Recent studies have shown that RDW levels are correlated with CRP levels.23,36,37 However, because CRP is not a routinely used index for diagnosis in emergencies, the relationship between RDW and CRP was not discussed. This also reminds us that the CRP level should be included in emergency routine evaluation, lung CT scan should be completed as soon as possible, patients’ state of inflammatory stress should be acutely observed, and anti-inflammatory treatment should be actively administered. Interestingly, in this study, there was no apparent difference in the level of leukocytes between the two RDW groups. This indicates that the mechanism of association between RDW and mortality is inflammation; to confirm this, further investigation is necessary. Meanwhile, recent studies reported the response of patients with AIS to IVT,38,39 higher RBC fraction group showed higher IVT responsiveness. RBC can affect clot stabilization and tPA-inducedfibrinolysis.40 However, there are very few studies on the effect of RDW on IVT reactivity and lysis of blood clots; thus, further experiments are needed to confirm these findings.
We acknowledge that our study has some limitations. First, because of differences in treatment procedures of discharged patients, unknown factors might have affected the results. Second, we did not discuss the relationship between RDW and age in depth, which limited the generalizability of the study’s results. Last, we did not explore the role of RDW in inflammation. In future experiments, we will address the above-mentioned limitations to obtain results that are more reliable.
Conclusions
Our study demonstrated that RDW before thrombolysis is an independent predictor of one-year mortality in patients with AIS, rather than a prognostic factor for the severity of stroke-based clinical outcomes. Thus, RDW before thrombolysis may be one of the future areas of development that will have potential implications on the stroke mechanism and therapeutic strategy after IVT for patients who are identified as having a high risk of mortality within the first year through RDW testing.
Abbreviations
RDW, red blood cell distribution width; AIS, acute ischemic stroke; IVT, intravenous thrombolysis; ED, emergency department; IDA, iron deficiency anemia; TT, thalassemia trait; IQR, interquartile range; CI, confidence interval; OR, odds ratio; SD, standard deviation; AUC, area under the ROC curve; PLT, platelet; NIHSS, The NIH Stroke Scale; CRP, C-reactive protein; NT-pro-BNP,N-terminal pro–B-type natriuretic peptide; TOAST, Trial of org 10172 in acute stroke treatment; OTT, onset-to-treatment time; HT, hemorrhagic transformation; CVD, cardiovascular disease; IAT, intra-arterial treatment; RBC, red blood cell; SBP, systolic blood pressure; DBP, diastolic blood pressure; TIA, transient ischemic attack.
Ethics Approval and Consent to Participate
The study was approved by the Ethics Committee of The First Affiliated Hospital of Wenzhou Medical University. Due to the retrospective nature of this study, no written informed consent was obtained. All patient data were anonymously analyzed.
Data Sharing Statement
The datasets used and/or analyzed during the current study are available from the corresponding author on reasonable request.
Acknowledgments
We thank all the participants in the study. Our study was supported by the Zhejiang Medical and Health Science and Technology Program (2014KYB312).
Author Contributions
WYY was responsible for the concept and design of the study, data collection and analysis and the first draft of the paper and further manuscript; WWX, OZ and BXK collected and analyzed the data, critically revised important intellectual content; XL performed the statistical analysis; JL and YYW participated the design of the study and explanation of the data; XZY and XZ were responsible for all aspects of the work in ensuring that questions related to the accuracy. All authors contributed to data analysis, drafting or revising the article, gave final approval of the version to be published, and agree to be accountable for all aspects of the work.
Disclosure
The authors report no conflicts of interest in this work.
References
1. Demir A, Yarali N, Fisgin T, Duru F, Kara A. Most reliable indices in differentiation between thalassemia trait and iron deficiency anemia. Pediatr Int. 2002;17:612–616. doi:10.1046/j.1442-200X.2002.01636.x
2. Kim CH, Park JT, Kim EJ, et al. An increase in red blood cell distribution width from baseline predicts mortality in patients with severe sepsis or septic shock. Crit Care.2013;17(6):R282. doi:10.1186/cc13145
3. Oh HJ, Park JT, Kim JK, et al. Red blood cell distribution width is an independent predictor of mortality in acute kidney injury patients treated with continuous renal replacement therapy. Nephrol Dial Transplant. 2012;17:589–594. doi:10.1093/ndt/gfr307
4. Dabbah S, Hammerman H, Markiewicz W, Aronson D. Relation between red cell distribution width and clinical outcomes after acute myocardial infarction. Am J Cardiol. 2010;17:312–317. doi:10.1016/j.amjcard.2009.09.027
5. Sotiropoulos K, Yerly P, Monney P, et al. Red cell distribution width and mortality in acute heart failure patients with preserved and reduced ejection fraction. ESC Heart Fail. 2016;3:198–204. doi:10.1002/ehf2.12091
6. Meynaar IA, Knook AH, Coolen S, et al. Red cell distribution width as predictor for mortality in critically ill patients. Neth J Med. 2013;71(9):488.
7. Patel KV, Semba RD, Ferrucci L, et al. Red cell distribution width and mortality in older adults: a meta-analysis. J Gerontol a Biol Sci Med Sci. 2010;65:258–265. doi:10.1093/gerona/glp163
8. Duchnowski P, Hryniewiecki T, Kuśmierczyk M, Szymański P. Red cell distribution width is a prognostic marker of perioperative stroke in patients undergoing cardiac valve surgery. Interact Cardiovasc Thorac Surg. 2017;25:925–929. doi:10.1093/icvts/ivx216
9. Felker GM, Allen LA, Pocock SJ, et al. Red cell distribution width as a novel prognostic marker in heart failure: data from the CHARM program and the Duke databank. J Am Coll Cardiol. 2007;50(1):40–47. doi:10.1016/j.jacc.2007.02.067
10. Salvagno GL, Sanchis-Gomar F, Picanza A, Lippi G. Red blood cell distribution width: a simple parameter with multiple clinicalapplications.Crit Rev Clin Lab Sci. 2015;52(2):86–105. doi:10.3109/10408363.2014.992064
11. Lippi G, Targher G, Montagnana M, Salvagno GL, Zoppini G, Guidi GC. Relation between red blood cell distribution width and inflammatory biomarkers in a large cohort of unselected outpatients.Arch Pathol Lab Med. 2009;133:628–632. doi:10.1043/1543-2165-133.4.628
12. Ren D, Wang J, Li H, Li Y, Li Z. Red blood cell distribution width and carotid intima-media thickness in patients with metabolicsyndrome. BMC Cardiovasc Disord.2017;17:44. doi:10.1186/s12872-017-0481-x
13. Soderholm M, Borne Y, Hedblad B, Persson M, Engstrom G. Red cell distribution width in relation to incidence of stroke and carotid atherosclerosis: a population-based cohort study. PLoS One.2015;10(5):e124957. doi:10.1371/journal.pone.0124957
14. Lozano R, Naghavi M, Foreman K, et al. Global and regional mortality from 235 causes of death for 20 age groups in 1990 and 2010: a systematic analysis for the Global burden of disease study 2010.Lancet. 2012;380:2095–2128. doi:10.1016/S0140-6736(12)61728-0
15. Perlstein TS, Weuve J, Pfeffer MA, et al. Red blood cell distribution width and mortality risk in a community-based prospective cohort. Arch Intern Med. 2009;169(6):588–594. doi:10.1001/archinternmed.2009.55
16. Tonelli M, Sacks F, Arnold M, et al. Relation between red blood cell distribution width and cardiovascular event rate in people with coronary disease. Circulation. 2008;117:163–168. doi:10.1161/Circulationaha.107.727545
17. Chen GP, Huang Y, Yang X, Feng JF. A nomogram to predict prognostic value of red cell distribution width in patients with esophageal cancer. Mediators Inflamm. 2015;854670.
18. Smirne C, Grossi G, Pinato DJ, et al. Evaluation of the red cell distribution width as a biomarker of early mortality in hepatocellularcarcinoma. Dig Liver Dis. 2015;47:488–494. doi:10.1016/j.dld.2015.03.011
19. Duchnowski P, Hryniewiecki T, Kuśmierczyk M, et al. Red cell distribution width as a predictor of multiple organ dysfunction syndrome in patients undergoing heart valve surgery. Biol Open. 2018;7(10):
20. Duchnowski P, Hryniewiecki T, Kuśmierczyk M, et al. The usefulness of selected biomarkers in aortic regurgitation. Cardiol J. 2018. doi:10.5603/CJ.a2018.0108
21. Kara H, Degirmenci S, Bayir A, et al. Red cell distribution width and neurological scoring systems in acute stroke patients. Neuropsychiatr Dis Treat. 2015;11:733–739. doi:10.2147/NDT.S81525
22. Turcato G, Cappellari M, Follador L, et al. Red blood cell distribution width is an independent predictor of outcome in patients undergoing thrombolysis for ischemic stroke. Semin Thromb Hemost. 2017;43(1):30–35. doi:10.1055/s-0036-1592165
23. Patel KV, Ferrucci L, Ershler WB, Longo DL, Guralnik JM. Red blood cell distribution width and the risk of death in middle-aged and olderadults. Arch Intern Med. 2009;169(5):515–523. doi:10.1001/archinternmed.2009.11
24. Menk M, Giebelhäuser L, Vorderwülbecke G, et al. Nucleated red blood cells as predictors of mortality in patients with acute respiratory distress syndrome (ARDS): an observational study. Ann Intensive Care.2018;8:42. doi:10.1186/s13613-018-0387-5
25. Sarnak MJ, Tighiouart H, Manjunath G, et al. Anemia as a risk factor for cardiovascular disease in the atherosclerosis risk in communities (ARIC)study. J Am Coll Cardiol. 2002;40(1):27–33. doi:10.1016/S0735-1097(02)01938-1
26. Zakai NA, Katz R, Hirsch C, et al. A prospective study of anemia status, hemoglobin concentration, and mortality in an elderly cohort: the cardiovascular health study. Arch Intern Med. 2005;165(19):2214–2220. doi:10.1001/archinte.165.19.2214
27. Hampole CV, Mehrotra AK, Thenappan T, Gomberg-Maitland M, Shah SJ. Usefulness of red cell distribution width as a prognostic marker in pulmonary hypertension. Am J Cardiol. 2009;17:868–872. doi:10.1016/j.amjcard.2009.05.016
28. Zorlu A, Bektasoglu G, Guven FM, et al. Usefulness of admission red cell distribution width as a predictor of early mortality in patients with acute pulmonary embolism. Am J Cardiol. 2012;109(1):128–134. doi:10.1016/j.amjcard.2011.08.015
29. Petrone AB, Eisenman RD, Steele KN, et al. Temporal dynamics of peripheral neutrophil and lymphocytes following acute ischemic stroke.Neurol Sci. 2019;40:1877–1885. doi:10.1007/s10072-019-03919-y
30. Gao F, Chen C, Lyu J, et al. Association between platelet distribution width and poor outcome of acute ischemic stroke after intravenousthrombolysis. Neuropsychiatr Dis Treat. 2018;14:2233–2239. doi:10.2147/NDT.S170823.
31. Yu S, Arima H, Bertmar C, et al. Neutrophil to lymphocyte ratio and early clinical outcomes in patients with acute ischemic stroke.J Neurol Sci. 2018;387:115–118. doi:10.1016/j.jns.2018.02.002
32. Tziakas DN, Chalikias GK, Stakos D, et al. Independent and additive predictive value of total cholesterol content of erythrocyte membranes with regard to coronary artery disease clinical presentation.Int J Cardiol. 2011;150:22–27. doi:10.1016/j.ijcard.2010.02.022
33. Tziakas DN, Kaski JC, Chalikias GK. Total cholesterol content of erythrocyte membranes is increased in patients with acute coronary syndrome: a new marker of clinical instability? J Am Coll Cardiol. 2007;49:2081–2089. doi:10.1016/j.jacc.2006.08.069
34. Chamorro A, Dirnagl U, Urra X, Planas AM. Neuroprotection in acute stroke: targeting excitotoxicity, oxidative and nitrosative stress, and inflammation lancet. Neurol. 2016;15:869–881. doi:10.1016/S1474-4422(16)00114-9.23
35. Libby P, Loscalzo J, Ridker PM, et al. Inflammation, immunity, and infection in atherothrom bosis: JACC review topic of the week.J Am Coll Cardiol. 2018;72(17):2071–2081. doi:10.1016/j.jacc.2018.08.1043
36. Rost NS, Wolf PA, Kase CS, et al. Plasma concentration ofC-reactive protein and risk of ischemic stroke and transient ischemic attack: the Framingham study. Stroke. 2001;32(11):2575–2579. doi:10.1161/hs1101.098151
37. Forhecz Z, Gombos T, Borgulya G, et al. Red cell distribution width in heart failure: prediction of clinical events and relationship with markers of ineffective erythropoiesis, inflammation, renal function, and nutritional state. Am Heart J. 2009;158:659–666. doi:10.1016/j.ahj.2009.07.024
38. Choi MH, Park GH, Lee JS, et al. Erythrocyte fraction within retrieved thrombi contributes to thrombolytic response in acute ischemic stroke. Stroke. 2018;49(3):652–659. doi:10.1161/STROKEAHA.117.019138
39. Kimura K, Sakamoto Y, Aoki J, Iguchi Y, Shibazaki K, Inoue T. Clinical and MRI predictors of no early recanalization within 1 hour aftertissue-type plasminogen activator administration. Stroke. 2011;42:3150–3155. doi:10.1161/STROKEAHA.111.623207
40. Wohner N, Sotonyi P, Machovich R, et al. Lytic resistance of fibrin containing red blood cells. Arterioscler Thromb Vasc Biol. 2011;31:2306–2313. doi:10.1161/ATVBAHA.111.229088
 © 2020 The Author(s). This work is published and licensed by Dove Medical Press Limited. The
full terms of this license are available at https://www.dovepress.com/terms
and incorporate the Creative Commons Attribution
- Non Commercial (unported, 3.0) License.
By accessing the work you hereby accept the Terms. Non-commercial uses of the work are permitted
without any further permission from Dove Medical Press Limited, provided the work is properly
attributed. For permission for commercial use of this work, please see paragraphs 4.2 and 5 of our Terms.
© 2020 The Author(s). This work is published and licensed by Dove Medical Press Limited. The
full terms of this license are available at https://www.dovepress.com/terms
and incorporate the Creative Commons Attribution
- Non Commercial (unported, 3.0) License.
By accessing the work you hereby accept the Terms. Non-commercial uses of the work are permitted
without any further permission from Dove Medical Press Limited, provided the work is properly
attributed. For permission for commercial use of this work, please see paragraphs 4.2 and 5 of our Terms.