Back to Journals » Clinical Interventions in Aging » Volume 16
Predicting Sarcopenia of Female Elderly from Physical Activity Performance Measurement Using Machine Learning Classifiers
Authors Ko JB, Kim KB, Shin YS, Han H, Han SK, Jung DY, Hong JS ![]()
Received 8 June 2021
Accepted for publication 1 September 2021
Published 27 September 2021 Volume 2021:16 Pages 1723—1733
DOI https://doi.org/10.2147/CIA.S323761
Checked for plagiarism Yes
Review by Single anonymous peer review
Peer reviewer comments 3
Editor who approved publication: Dr Maddalena Illario
Jeong Bae Ko,1,* Kwang Bok Kim,1,* Young Sub Shin,1 Hun Han,1 Sang Kuy Han,2 Duk Young Jung,3 Jae Soo Hong1
1Digital Health Care R&D Department, Korea Institute of Industrial Technology, Cheonan, Chuncheongnam-do, South Korea; 2Robotics R&D Department, Korea Institute of Industrial Technology, Ansan, Gyeonggi-do, South Korea; 3Seongnam Senior Experience Complex, Eulji University, Seongnam, Gyeonggi-do, South Korea
*These authors contributed equally to this work
Correspondence: Jae Soo Hong
Digital Health Care R&D Department, Korea Institute of Industrial Technology, Cheonan, Chuncheongnam-do, South Korea
Tel +82 41-589-8412
Fax +82 41-589-8413
Email [email protected]
Duk Young Jung
Seongnam Senior Experience Complex, Eulji University, Seongnam, Gyeonggi-do, South Korea
Tel +82 41-589-8412
Email [email protected]
Purpose: Sarcopenia is a symptom in which muscle mass decreases due to decreasing in the number of muscle fibers and muscle cross-sectional area as aging. This study aimed to develop a machine learning classification model for predicting sarcopenia through a inertial measurement unit (IMU)-based physical performance measurement data of female elderly.
Patients and Methods: Seventy-eight female subjects from an elderly population (aged: 78.8± 5.7 years) volunteered to participate in this study. To evaluate the physical performance of the elderly, the experiment conducted timed-up-and-go test (TUG) and 6-minute walk test (6mWT) with worn a single IMU. Based on literature review, 132 features were extracted from collected data. Feature selection was performed through the Kruskal–Wallis test, and features datasets were constructed according to feature selection. Three major machine learning-based classification algorithms classified the sarcopenia group in each dataset, and the performance of classification models was compared.
Results: As a result of comparing the classification model performance for sarcopenia prediction, the k-nearest neighborhood algorithm (kNN) classification model using 40 major features of TUG and 6mWT showed the best performance at 88%.
Conclusion: This study can be used as a basic research for the development of self-monitoring technology for sarcopenia.
Keywords: sarcopenia, physical activity, machine learning, inertial measurement unit
Introduction
Sarcopenia is a symptom in which the muscle mass of the skeletal muscles decreases due to a decrease in the number of muscle fibers and muscle cross-sectional area with aging.1 Sarcopenia affects the physical activity performance ability as the muscle function is reduced as the muscle mass decreases due to aging. Sarcopenia mainly occurs among the elderly. It can appear in approximately 24% of the elderly aged 65 years or older and approximately 50% of the elderly aged 80 years or older.2 When the physical activity performance ability is reduced, it can limit the elderly’s independent performance of the activities of daily living and this can have a negative effect on the quality of life of the elderly. With the progress of sarcopenia, the possibility of falls increases. Falls can not only cause a bodily burden but also an economic burden due to treatment to the elderly.3
The term sarcopenia was first introduced in 1989 by Rosenberg.4 The diagnosis criteria for sarcopenia vary by the group. They are based on the reports of the European Working Group on Sarcopenia in Older People (EWGSOP2) and the Asian Working Group for Sarcopenia (AWGS).5,6 According to the diagnosis criteria suggested by these two groups, three factors are measured to diagnose sarcopenia: muscle mass, muscle strength, and physical activity performance ability. For muscle mass measurement methods, bioelectric impedance analysis (BIA), dual energy x-ray absorptiometry (DXA), and computed tomography (CT) were suggested. Among the muscle mass measurement methods, the measurement of muscle mass using DXA is most recommended.6 As the criterion for muscle mass measurement, the skeletal muscle index (SMI) is derived by dividing the sum of appendicular skeletal muscle mass (ASM) measured by DXA by the square of height. The criterion of EWGSOP2 is 7.0kg/m2 for men and 5.5kg/m2 for women. The criterion of AWGS is 7.0kg/m2 for men and 5.4kg/m2 for women. For the measurement of muscle strength, the EWGSOP2 suggested the method of handgrip strength measurement, which can be easily used in clinical settings. After measuring the handgrip strength several times, the highest result is used as the muscle strength measurement for diagnosis. As the criterion for handgrip strength, the EWGSOP2 suggested 27.0kg for men and 16.0kg for women, and the AWGS suggested 28.0kg for men and 18.0kg for women. For the physical activity performance ability, the EWGSOP2 suggested the gait speed measurement, Timed-Up and Go test, Short physical performance battery (SPPB), and 400 meter walk test. The EWGSOP2 reported the cut-off points as 0.8m/s or less, 20s or more, 8 point score or less, and 6 minutes or more, respectively. Additionally, the AWGS suggested the 6-meter walk test, 5-time chair stand test, and SPPB for the physical activity performance ability measurement. The AWGS reported the cut-off points as less than 1.0m/s, 12s or more, and 9-point score or less, respectively.
Furthermore, the EWGSOP2 defined the sarcopenia stages into “sarcopenia probable”, “sarcopenia confirmed”, and “sarcopenia severe” according to the three factors for diagnosing sarcopenia. “Sarcopenia probable” is a stage where the muscle strength is only lower than the muscle strength criterion among the three factors of sarcopenia diagnosis. The “sarcopenia confirmed” stage is defined when the muscle strength and the muscle mass are lower than the criterions. “Sarcopenia severe” is a stage where all the three factors for sarcopenia diagnosis are lower than the EWGSOP2 criterion. Meanwhile, the AWGS defined the sarcopenia stages into “sarcopenia”, and “severe sarcopenia” as the three factors for diagnosing sarcopenia.5 In the “sarcopenia” stage, the muscle mass is lower than the AWGS criterion, and the muscle strength or physical activity performance ability is lower than the AWGS criterion. “Severe sarcopenia” is a stage where all the three factors for sarcopenia diagnosis are lower than the AWGS criterion. The stage distinction of sarcopenia can assist the selection of appropriate treatment according to the sarcopenia stage, and can be also used to specify symptoms for each stage of sarcopenia.
With the recent development of the micro-electro mechanical systems (MEMS), small wearable devices with excellent measurement accuracy are being developed. Among them, the inertial measurement unit (IMU) is mainly used to estimate human body motions. The IMU is composed of a three-dimensional (3D) accelerometer, a gyroscope, and a geomagnetic machine, and can measure the acceleration, angular velocity, and direction of moving objects. Recently, many studies have been actively conducted including the prediction of the physical activity performance ability, fall prediction, prediction of frailty status, and the perception of the activities of daily living of the elderly based on acceleration and angular velocity signals measured by the IMU. Green et al predicted the frailty status of the elderly using timed-up-and-go test (TUG) and handgrip strength measurement data with IMUs.7 To compare the frailty status prediction methods, Coni et al compared the prediction results using the standard clinical method and the prediction result based on 30-s chair stand test and TUG measurement data using IMUs.8 Lepetit et al developed a physical function assessment tool for the elderly through sit-to-stand test using IMUs.9 Buisseret et al conducted TUG and 6-minute walking test (6mWT) with IMUs and predicted the fall risk of the elderly.10
To prevent and treat sarcopenia, continuous dietary management and regular exercise, and self-management of the patients are crucial. However, the conventional sarcopenia diagnosis and monitoring methods are difficult for regular monitoring by the patients themselves because they have to visit a medical institution and it requires many procedures and special devices such as DXA, handgrip strength measurement, and walking speed measurement. To improve this shortcoming of the conventional method, this study implemented a classification model for predicting the sarcopenia stage with machine learning techniques only using IMU data which are measured when assessing the physical activity performance ability used in clinical studies of the elderly and compared the performances of different models.
Materials and Methods
Participants and Data Collection
For this study, we recruited 105 elderly women (age: 78.8 ± 5.7 years). All the participants volunteered. The recruited women were in their 70s who could live independently, could walk without assistive devices, did not have cardiovascular diseases, and could understand and perform experiments. This experiment was approved by the Public Institutions Bioethics Committee designated by the Ministry of Health and Welfare of the Republic of Korea (P01-201902-13-001).
Instead of recruiting sarcopenia patients, we recruited participants among the general elderly and measured their muscle mass, handgrip strength, and physical activity performance ability. Then, their sarcopenia stages were distinguished through consultation with professional medical staff. To measure the muscle mass, the DXA device Prodigy (GE Healthcare, USA) was used. For muscle strength, the handgrip strength of the dominant hand was measured using an electronic handgrip strength measuring instrument (TKK-5401, TAKEI, Japan) and used the highest result. Regarding the walking speed, the mean walking speed was determined after the participants performed 6mWT.
To measure the physical activity performance, one IMU (Research PRO, Noraxon, USA) was worn at the second lumbar vertebra (L2) of the participants using an elastic band (Figure 1). The IMU for measuring the physical activity performance consists of a 3D accelerometer, a gyroscope, and a geomagnetic machine. The 3D accelerometer can measure up to ± 16G and its maximum data-sampling rate is 400Hz. The gyroscope can measure up to ± 2000 deg/s in three-axis directions and its maximum data-sampling rate is 400Hz. The data-sampling rate was set to 100Hz. The data were collected using MR 3.12 (Noraxon, USA).
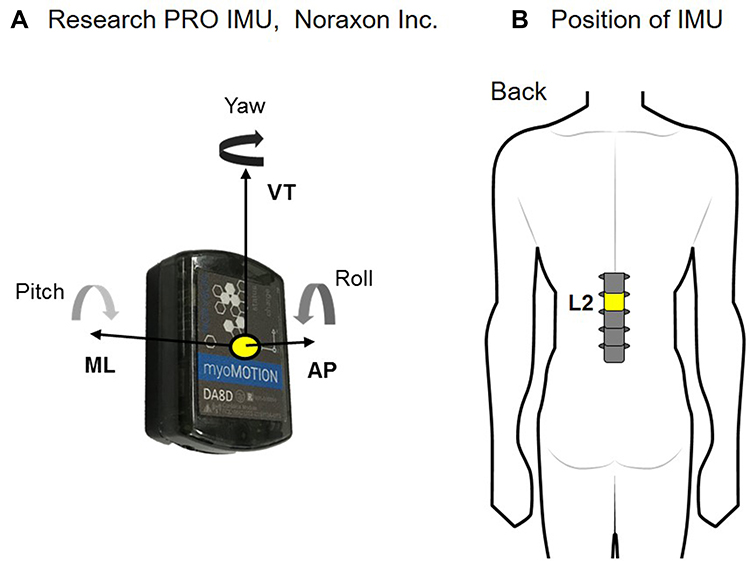 |
Figure 1 Information of the IMU: (A) 3-axis of IMU and (B) the position of the IMU. Abbreviations: IMU, Inertial measurement unit; VT, Vertical; ML, Mediolateral; AP, Anterior-posterior; L2, Second lumbar vertebra. |
For physical activity ability measurement, TUG and 6mWT were performed, which are mainly used to assess the functional performance of the elderly in clinical settings.11 TUG is an assessment in which the participant stands up from the chair, walks to the return point, turns around the return point, walks back to the chair, and sits down on the chair.12 The TUG assessment is mainly used to assess the balance ability of the elderly in clinical settings because it includes various motions that can appear during the activities of daily living. 6mWT is an assessment in which participants walk in a round trip of a straight distance specified by the experimenter for 6 minutes.13 It is widely used to evaluate aerobic capacity, as well as mobility disability in the frailty people.14–16 The participants can take a rest when they ask for it during the assessment. In this study, the distance from the chair to the return point for TUG was set to 3m and the round trip distance of 6mWT was set to 30m.
The data collection process is illustrated in Figure 2. First, we explained the purpose of experiment to the participants and asked for their consent to participate in this experiment, which was approved by the Public Institutions Bioethics Committee designated by the Ministry of Health and Welfare of the Republic of Korea (P01-201902-13-001) and was performed in accordance with the Declaration of Helsinki. All participants gave their written informed consent. Next, their handgrip strength was measured three times. After handgrip strength measurement, they moved to a room in which the DXA equipment is installed and their muscle mass was measured. After DXA imaging, they moved to a place for TUG. They wore an IMU and performed TUG three times. When performing TUG, the participants were asked to perform it as quickly as possible. The participants took a rest for 30 seconds before performing the next trial. After finishing the TUG, they performed 6mWT one times. The participants were allowed to rest in place if they thought it difficult to proceed with the 6mWT, and the rest time and number of rests were recorded. However, the participants who rested during 6mWT were not identified. After completion of 6mWT, we terminated the experiment. The total experiment took approximately one hour.
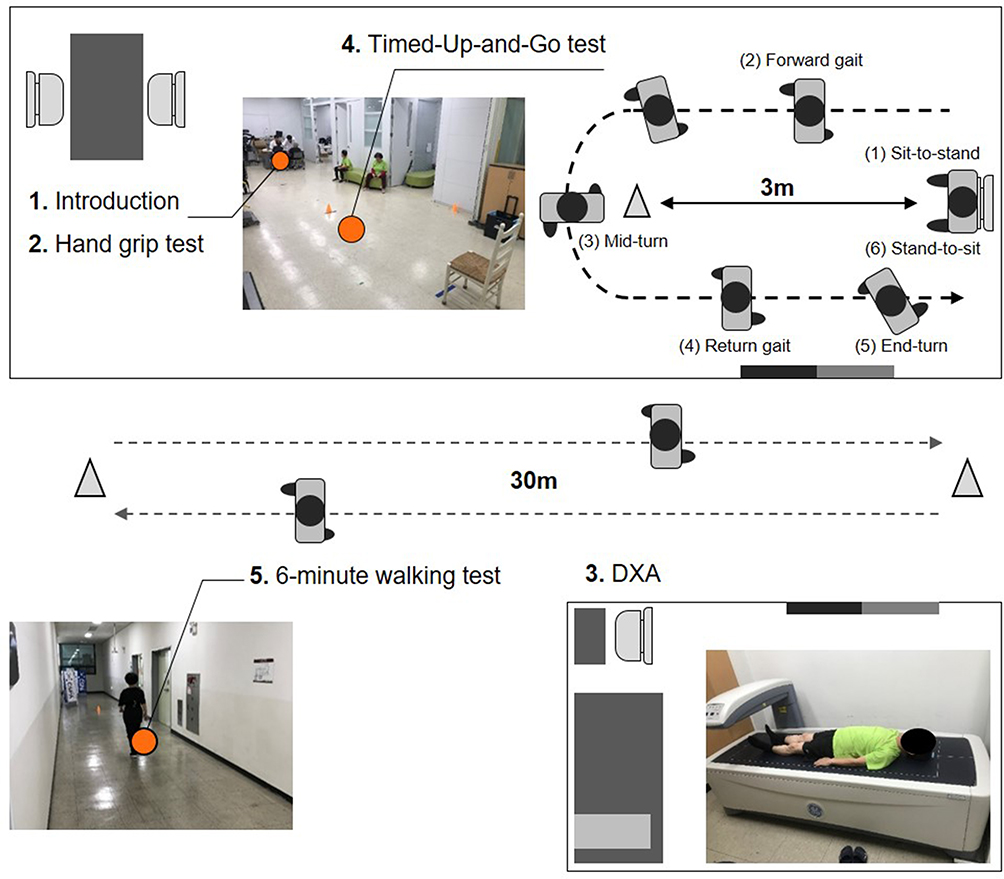 |
Figure 2 Experimental set-up for collecting physical data of the elderly. Abbreviation: DXA, dual energy X-ray absorptiometry. |
Data Analysis
To implement the sarcopenia prediction model, the data of 78 persons were used among the data of 105 persons in total. The data of 27 persons of which the physical activity data were missing or erroneous were excluded from the data for implementing the sarcopenia prediction model. The SMI, handgrip measurement data, and walking speed data of 78 persons were used as the sarcopenia diagnosis criteria of the AWGS to distinguish the sarcopenia stage which is classified into “sarcopenia” and “severe sarcopenia”. It was finally determined through consultation with professional medical staff. Sarcopenia was not determined for 58 of 78 persons. The number of participants corresponding to the “sarcopenia” stage was 20 persons. However, there was no participant who corresponded to the “severe sarcopenia” stage (Table 1.).
 |
Table 1 Sarcopenia Stage Grouping, According to AWGS Criterion for Female |
Figure 3 shows the framework of the sarcopenia prediction model using machine-learning techniques. To carry out the total framework, MATLAB R2018a (MathWorks, USA) was used.
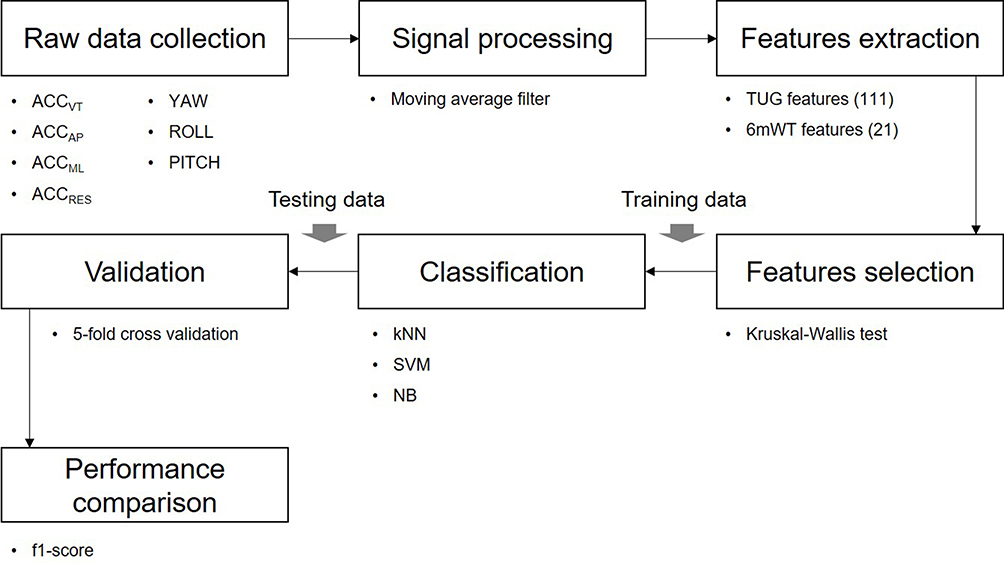 |
Figure 3 The framework of identifying the optimal classification model for predicting sarcopenia-stage. Abbreviations: ACCVT, vertical linear acceleration; ACCAP, anterior-posterior acceleration; ACCML, mediolateral acceleration; ACCRES, resultant acceleration; YAW, Vertical axis angular velocity; ROLL, anterior-posterior axis angular velocity; PITCH, mediolateral axis angular velocity; kNN, k-nearest neighborhood algorithm; SVM, support vector machines; NB, Naïve Bayes algorithm. |
For raw data, vertical linear acceleration (ACCVT), anterior-posterior acceleration (ACCAP), and mediolateral acceleration (ACCML), the resultant acceleration (ACCRES) of the 3D linear acceleration and 3D angular velocities were used. ACCRES is derived using the following equation:

The 3D angular velocities are distinguished based on the rotational axis in each direction, for which vertical axis angular velocity (YAW), anterior-posterior axis angular velocity (ROLL), and mediolateral axis angular velocity (PITCH) were used. All the raw data were filtered using a moving average filter to remove data noise.
Feature Extraction
To develop a classification model for predicting sarcopenia-stage groups, we extracted 132 features from the raw data collected from IMUs during physical activity. Among the 132 features, 111 were TUG-related features and 21 were 6mWT-related features.
To extract TUG-related features, the sub-tasks included in the TUG need to be distinguished based on the raw data collected from IMUs. The method for distinguishing the sub-tasks of TUG using data collected from one IMU suggested by Beyea et al was referenced.17 According to the proposed method, among the sub-tasks of TUG, those related to chair activity were distinguished using PITCH, and the sub-tasks related to turn activity were distinguished using YAW (Figure 4). After the sub-tasks of TUG were distinguished, the performance time of each sub-task was determined and the total TUG performance time was estimated. For TUG features, the features related to the TUG performance time and the descriptive statistic features of the TUG raw data were used (Table 2). The number of features related to the TUG performance time was 6. For the descriptive statistic features, the Root mean square, Min and Max values of the seven raw data (ACCVT, ACCAP, ACCML, ACCRES, YAW, PITCH, ROLL) measured during the five TUG sub-tasks were calculated.
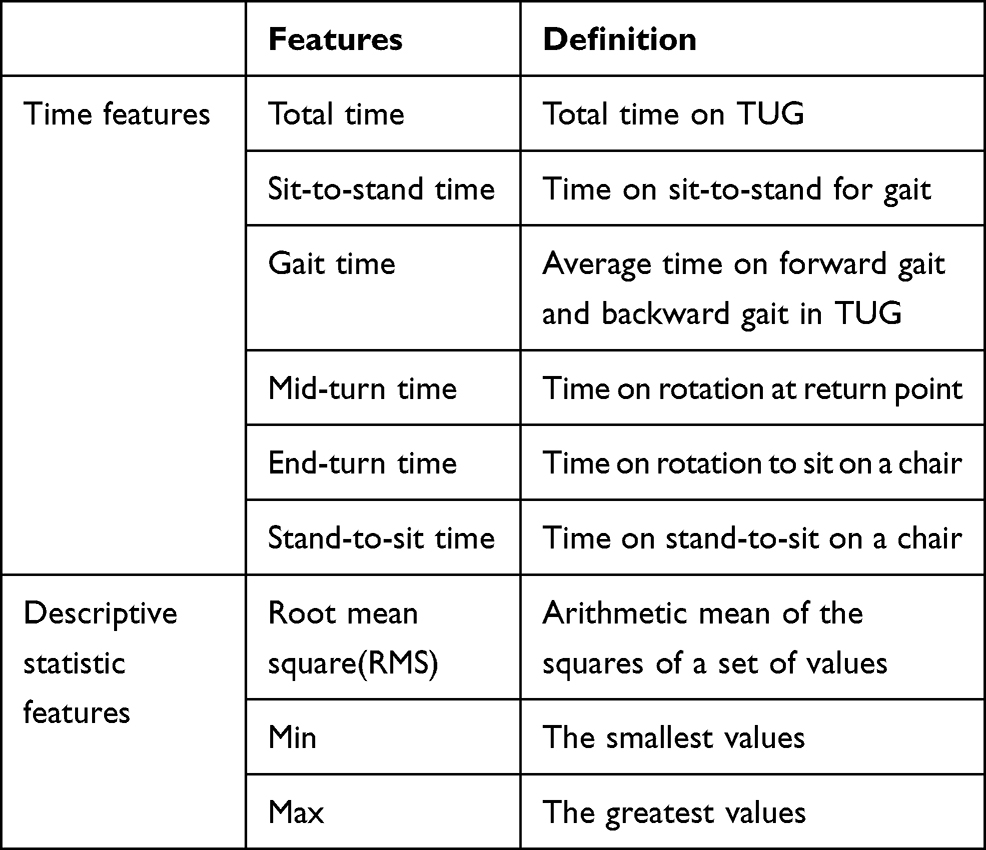 |
Table 2 Features of TUG |
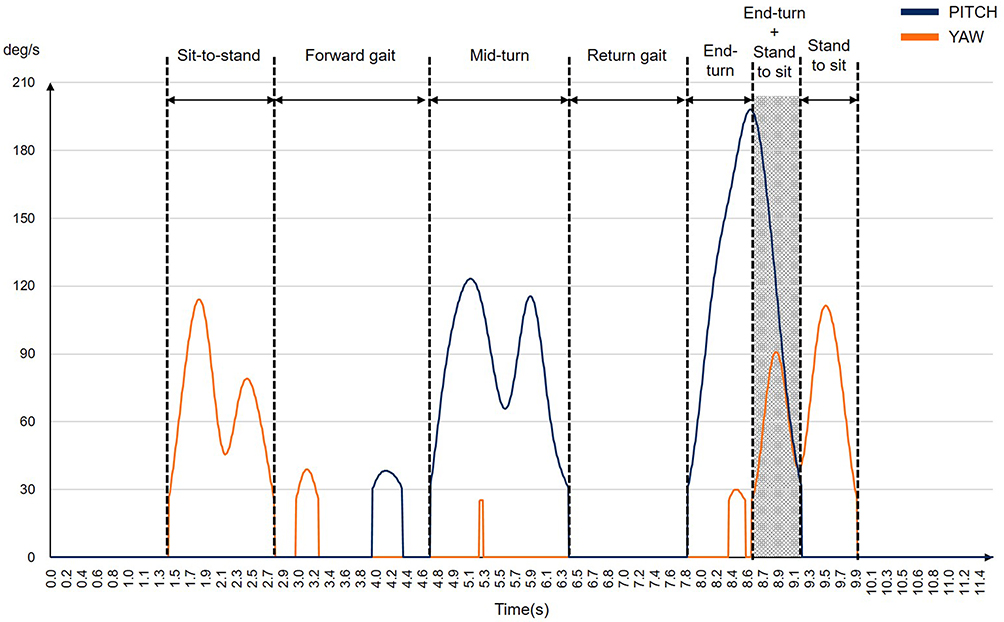 |
Figure 4 The example of identification the TUG sub-tasks using angular velocity. Abbreviations: PITCH, mediolateral axis angular velocity; YAW, Vertical axis angular velocity. |
For the features related to 6mWT, the gait parameter (GT), gait symmetry parameter (GS), harmonic parameter (HR), and approximate entropy parameter (ApEn) were used (Table 3). To extract the 6mWT-related features, only the 3D linear accelerations and resultant acceleration were used among the raw data. GT represents the spatio-temporal characteristics that appear during gait. For GT, the steps were recognized through the peak value of ACCVT collected from the IMU during the 6-minute walking to determine the total number of steps during the 6-minute walking. Then the inter-step distance was inferred from the height of the participants to finally estimate the walking distance for 6 minutes. The walking speed was calculated using the estimated walking distance.
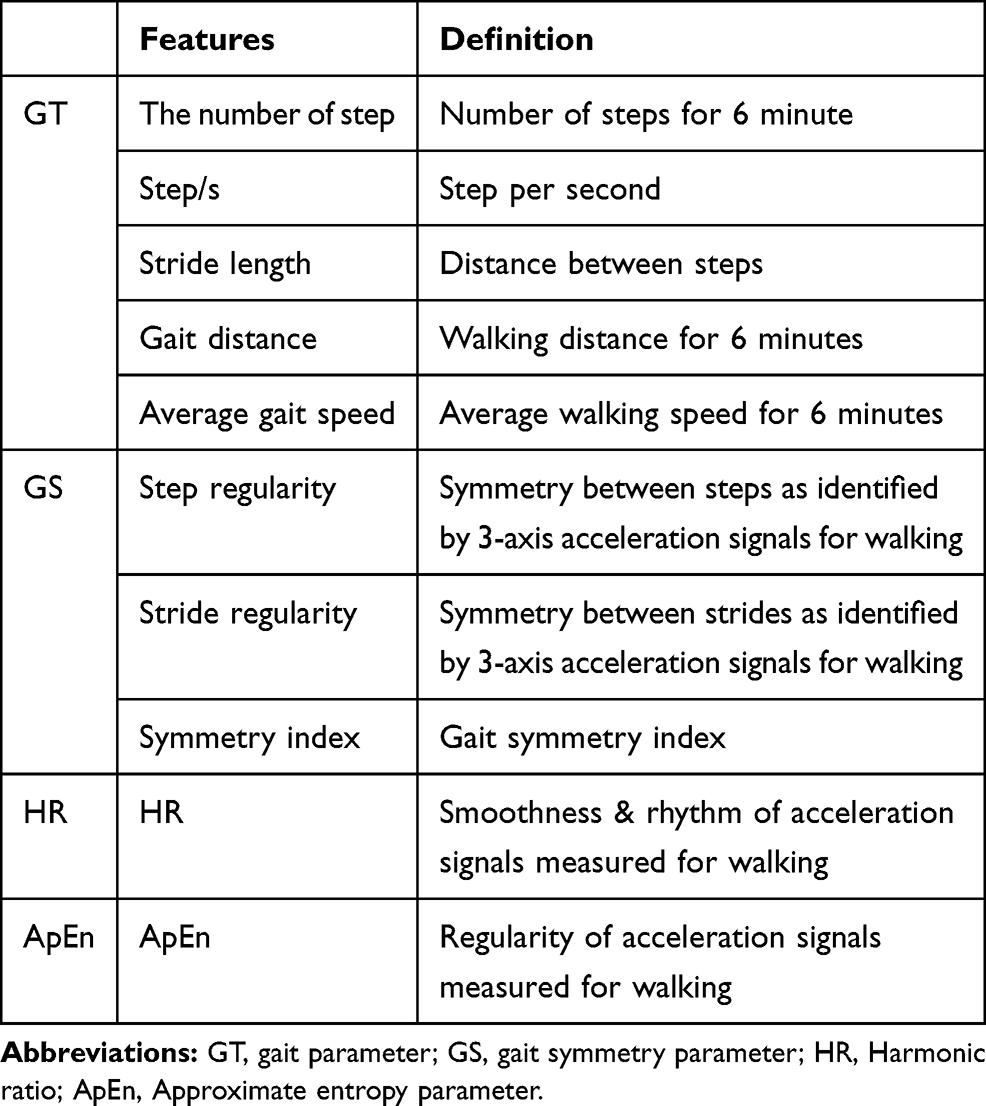 |
Table 3 Features of 6mWT |
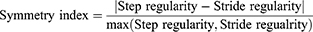
GS is used to quantify the degree of the gait symmetry.18,19 GS is represented by step regularity, stride regularity, and symmetry index. Step regularity is defined as the symmetry between steps. Stride regularity indicates the symmetry between strides. Symmetry index is an index that indicates the overall degree of symmetry of gait. Step regularity and stride regularity can be obtained through the coefficient derived during unbiased-autocorrelation for the vertical acceleration and anterior-posterior acceleration signal x. The unbiased-autocorrelation coefficient Aunbiased can be calculated using the following equation:
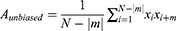
where N is the total number of the collected data samples, m is the lag parameter,  is the acceleration at i, and
  is the acceleration at the time delayed by m. Step regularity and stride regularity can be determined by the peaks of Aunbiased. The first peak of Aunbiased after zero lag is defined as the step regularity, and the second peak as the stride regularity. The symmetry index was derived by normalizing to the maximum value between step regularity and stride regularity.20
HR is used to evaluate the smoothness and rhythm for the pattern of acceleration signals measured during gait.21,22 Harmonic coefficients can be derived through discrete Fourier transform of acceleration signals for 10 strides. HR is calculated differently depending on the direction of acceleration signals. The HR of the vertical acceleration and the anterior-posterior acceleration is calculated by dividing the sum of even harmonic coefficients among 20 harmonic coefficients by the sum of odd harmonic coefficients. In contrast, the HR of the left and right acceleration is calculated by dividing the sum of odd harmonic coefficients by the sum of even harmonic coefficients.
ApEn is used to estimate the regularity of acceleration signals collected from the IMU during gait.23 ApEn is one of the entropies that measure the complexity of time series data. The more regular the gait is, the smaller the calculated ApEn becomes. ApEn was calculated in accordance with the algorithm suggested by Pincus.24
Feature Selection
Among the various features found through literature review, main features that influence the classification of sarcopenia were screened. Many features that have a small effect on the objects to be classified can degrade the performance of the classification model.25 The Kruskal–Wallis test was performed for feature selection. The Kruskal–Wallis test is one of analysis of variance (ANOVA) techniques used to select features when the amount of collected data for each data class is not equal or the collected data do not follow normal distribution.26 When p-value derived from the Kruskal–Wallis test is closer to zero, the feature importance coefficient becomes higher. A feature that has a high feature importance coefficient is considered a feature that has a great effect on the object to be classified.
A feature selection dataset was configured to verify the performance of the sarcopenia classification model based on the result of the Kruskal–Wallis test (Table 4). The feature selection datasets were classified into a dataset when all the TUG and 6mWT features were used (FALL), a dataset when only TUG features were used (FTUG), and a dataset when only the 6mWT features were used (F6mWT). Each feature selection dataset was configured with top 10, 20, 30, 40, or 50 features depending on the feature importance coefficient value, and the performance of the sarcopenia classification model according to the number of features was compared.
 |
Table 4 Feature Selection Datasets |
Classification
To identify a machine learning classification model algorithm that is most suitable for predicting sarcopenia, the performance of the classification model was compared using three classification algorithms that are mainly used in the analysis of gait and balance of the elderly. For classification algorithms, support vector machines (SVM), k-nearest neighborhood algorithm (kNN), and Naïve Bayes algorithm (NB) were used.
The performance of the classification model was compared by calculating the f1-score (F1). F1 is used to estimate the performance of a model when implementing a classification model when the amount of collected data according to the classification class is uneven.27 F1 has a value between 0 and 1, and a value closer to 1 indicates a higher performance. F1 is determined by the harmonic mean of precision and recall calculated from a confusion matrix. The procedure for deriving F1 is as follows:
where TP (true positive) is the number of true data that were correctly predicted as true, FP is the number of false data that were incorrectly predicted as true, and FN is the number of true data that were incorrectly predicted as false.
Results
For FALL, when 40 features selected by feature selection were used, the kNN classification model showed the highest performances with F1 values of 0.881. In contrast, when all features were used, the NB classification model showed the lowest performances with F1 values of 0.648 (Figure 5A). The performance of the three classification models according to the number of features was the best with an average F1 of 0.864 ± 0.002 when using 30 features selected by feature selection, and the lowest with an average F1 of 0.777 ± 0.114 when using all features. The performance of algorithms for implementing the classification models showed the best performance in kNN (mean F1: 0.844 ± 0.035) and the lowest performance in NB (mean F1: 0.780 ± 0.074). SVM showed moderate performance (mean F1: 0.815 ± 0.042).
 |
Figure 5 Classification models performance depending on feature selection datasets: (A) Results of FALL, (B) Results of FTUG, (C) Results of F6mWT, and (D) Final results. Abbreviations: FALL, dataset consisted of both TUG features and 6mWT features; FTUG, dataset consisted of only TUG features; F6mWT, dataset consisted of only 6mWT features; kNN, k-nearest neighborhood algorithm; SVM, support vector machines; NB, Naïve Bayes algorithm; FALL40features(kNN), the kNN classification model using 40 features on FALL; FTUG40features(SVM), the SVM classification model using 50 features on FTUG;; F6mWT15features(kNN), the kNN classification model using 15 features on F6mWT. |
For FTUG, when 40 features selected according to feature selection were used, the SVM classification model showed the highest performance with F1 values of 0.860. However, when all features were used, the NB classification model showed the lowest performance with F1 value of 0.697 (Figure 5B). The performance of the three classification models according to the number of features was the best with an average F1 of 0.845 ± 0.014 when using 30 features selected by feature selection, and the lowest with an average F1 of 0.778 ± 0.030 when using 50 features selected by feature selection. The performance of the algorithm for implementing the classification models showed similar performance with the average F1 of SVM and kNN at 0.810 ± 0.038 and 0.805 ± 0.038 respectively, and the lowest performance of NB at 0.773 ± 0.047.
For F6mWT, when 15 features were used, the kNN classification model showed the highest performance with F1 values of 0.807. When all features were used, the NB classification models showed the lowest performances with F1 values of 0.566 (Figure 5C). The performance of the three classification models according to the number of features was the best with an average F1 of 0.751 ± 0.085 when using 15 features selected by feature selection, and the lowest with an average F1 of 0.658 ± 0.083 when using all features. The performance of algorithms for implementing the classification models showed the best performance in SVM (mean F1: 0.757 ± 0.030) and the lowest performance in NB (mean F1: 0.656 ± 0.066). kNN showed moderate performance (mean F1: 0.726 ± 0.060).
In summary, the kNN classification model using 40 features of FALL showed the highest performance with a F1 value of 0.881 (Figure 5D). In contrast, the kNN classification model using 15 features of F6mWT showed the lowest performance with a F1 value of 0.807. The SVM classification model using 40 features of FTUG showed a moderate performance with a F1 value of 0.860.
Discussion
This study developed a classification model based on machine learning techniques for predicting sarcopenia by measuring the physical activity performance of female elderly using IMUs. When the major features of FALL were examined in the feature selection steps performed to improve the performance of the classification model, top five features that influence the classification of sarcopenia were all related to TUG features. Top 5 features were the minimum YAW of end-turn, the average ACCVT of sit-to-stand, the maximum YAW of end-turn, the time of end-turn and the minimum ACCAP of gait. This result suggests that the decreased muscle function affected the sit-to-stand and turning abilities as well as walking ability. Gadelha et al reported that sarcopenia patients had lower abilities for sit-to-stand and postural balance than the general elderly.28 Furthermore, Kurz et al reported that sarcopenia patients received lower TUG scores than the general elderly.29
This study verified that the kNN classification model using top 40 features of FALL is the most appropriate model for classifying sarcopenia. The performances of the three classification models SVM, kNN, and NB using top 40 features of FTUG were 0.86, 0.84, and 0.83, respectively, showing relatively moderate performances. However, the SVM, kNN, and NB classification models using all features of F6mWT showed the lowest performances among the three datasets at 0.73, 0.68, and 0.57. Greene et al implemented a frailty status classification model for the elderly by conducting logistic regression based on the TUG data collected using IMUs (Accuracy: 71.2%).7 The performance of the classification model of Greene et al was lower than the performance of the SVM classification model using 50 features of FTUG in this study (F1: 86.0%). Coni et al distinguished between older individuals with a High and Very High Functional Status stratified by the Late-Life Function and Disability Instrument, conducting logistic regression based on the TUG data and 30-s Chair Stand Test data collected by smartphone IMU (Accuracy: 69.0%).8 The performance of the classification model of Coni et al was lower than the performance of our the kNN classification model using top 40 features of FALL(F1: 88.1%). Compared with previous studies, kNN and SVM performed better than logistic regression algorithms for classification with frailty of the elderly. In addition, the classification models using TUG and 6mWT data showed better performance than the classification model using only TUG data or TUG combined 30-s Chair Stand Test data.
Kim et al developed a sarcopenia classification model by performing SVM algorithm from data collected by 2 IMU during walking (Accuracy: 95%).30 The sarcopenia classification model showed a higher performance than that of the sarcopenia classification model developed in this study. However, the reason for such performance difference is that more IMUs were used for measuring physical activity. Bourdenas and Sloman reported that the performance of the classification model can be improved by using more sensors in the implementation of a classification model.31 However, attaching many sensors to the body for self-monitoring of sarcopenia in real life can cause physical discomfort in the user.
The classification models cannot classify the severe sarcopenia due to the failure of recruiting the subjects in the severe sarcopenia stage. Therefore, we should recruit the subjects in the severe sarcopenia stage for improving the classification model. We plan to recruit additional the subjects in the sarcopenia stage and the severe sarcopenia stage to equalize the number of samples between classes. Furthermore, this study cannot predict the sarcopenia of men because the sarcopenia classification model of this study was developed only for women. In our future study, we will develop a sarcopenia classification model for men as well. The findings of this study can be useful for developing sarcopenia prediction techniques and for simplifying the sarcopenia diagnosis method.
Conclusion
This study aimed to develop a sarcopenia classification model for predicting sarcopenia of the elderly based on physical activity data measured by IMUs. The major IMU data features that affect the classification of sarcopenia were verified and a sarcopenia classification model that is most suitable for predicting sarcopenia was developed. When a sarcopenia classification model is developed, both TUG and 6mWT physical activities should be performed to improve the performance of the classification model. The results of this study can be used as basic data for developing sarcopenia self-monitoring techniques.
Acknowledgments
This research was supported by the Ministry of Trade, Industry & Energy (MOTIE), Korea Institute for Advancement of Technology (KIAT) through the Encouragement Program for The Industries of Economic Cooperation Region (NK200031).
Disclosure
Jeongbae Ko, Youngsub Shin, Hun Han, and Jaesoo Hong report grants from Korea Institute for Advancement of Technology (KIAT), during the conduct of the study. The authors report no other potential conflicts of interest in this work.
References
1. Baumgartner RN, Stauber PM, McHugh D, Koehler KM, Garry PJ. Cross-sectional age differences in body composition in persons 60 + years of age. J Gerontol A Biol Sci Med Sci. 1995;50A(6):M307–M316. doi:10.1093/gerona/50a.6.m307
2. Baumgartner RN, Koehler KM, Gallagher D, et al. Epidemiology of sarcopenia among the elderly in New Mexico. Am J Epidemiol. 1998;147(8):755–763. doi:10.1093/oxfordjournals.aje.a009520
3. Park HM. Current status of sarcopenia in Korea: a focus on Korean geripausal women. Ann Geriatr Med Res. 2018;22(2):52–61. doi:10.4235/agmr.2018.22.2.52
4. Ih R. Epidemiologic and methodologic problems in determining nutritional status of older persons. Proceedings of a conference. Albuquerque, New Mexico, October 19-21,1988. Am J Clin Nutr. 1989;50(5 Suppl):1121–1235.
5. Chen L-K, Woo J, Assantachai P, et al. Asian Working Group for Sarcopenia: 2019 consensus update on sarcopenia diagnosis and treatment. J Am Med Dir Assoc. 2020;21(3):
6. Cruz-Jentoft AJ, Bahat G, Bauer J, et al. Sarcopenia: revised European consensus on definition and diagnosis. Age Ageing. 2019;48(1):16–31. doi:10.1093/ageing/afy169
7. Greene BR, Doheny EP, O’Halloran A, Anne Kenny R. Frailty status can be accurately assessed using inertial sensors and the TUG test. Age Ageing. 2014;43(3):406–411. doi:10.1093/ageing/aft176
8. Coni A, Ancum JMV, Bergquist R, et al. Comparison of standard clinical and instrumented physical performance tests in discriminating functional status of high-functioning people aged 61(-)70 years old. Sensors. 2019;19. doi:10.3390/s19030449
9. Lepetit K, Mansour KB, Letocart A, et al. Optimized scoring tool to quantify the functional performance during the sit-to-stand transition with a magneto-inertial measurement unit. Clin Biomech. 2019;69:109–114. doi:10.1016/j.clinbiomech.2019.07.012
10. Buisseret F, Catinus L, Grenard R, et al. Timed up and go and six-minute walking tests with wearable inertial sensor: one step further for the prediction of the risk of fall in elderly nursing home people. Sensors. 2020;20(11):3207. doi:10.3390/s20113207
11. Zarzeczny R, Nawrat-Szoltysik A, Polak A, et al. Aging effect on the instrumented Timed-Up-and-Go test variables in nursing home women aged 80-93 years. Biogerontology. 2017;18(4):651–663. doi:10.1007/s10522-017-9717-5
12. Podsiadlo D, Richardson S. The timed “Up & Go”: a test of basic functional mobility for frail elderly persons. J Am Geriatr Soc. 1991;39(2):142–148. doi:10.1111/j.1532-5415.1991.tb01616.x
13. Laboratories ATSCoPSfCPF. ATS statement: guidelines for the six-minute walk test. Am J Respir Crit Care Med. 2002;166(1):111–117. doi:10.1164/ajrccm.166.1.at1102.
14. Ko V, Naylor JM, Harris IA, Crosbie J, Yeo AE. The six-minute walk test is an excellent predictor of functional ambulation after total knee arthroplasty. BMC Musculoskelet Disord. 2013;14:145. doi:10.1186/1471-2474-14-145
15. Boxer R, Kleppinger A, Ahmad A, Annis K, Hager D, Kenny A. The 6-minute walk is associated with frailty and predicts mortality in older adults with heart failure. Congest Heart Fail. 2010;16(5):208–213. doi:10.1111/j.1751-7133.2010.00151.x
16. Pahor M. Mobility and functional outcomes for sarcopenia trials. J Frailty Aging. 2015;4(3):123–124.
17. Beyea J, McGibbon CA, Sexton A, Noble J, O’Connell C. Convergent validity of a wearable sensor system for measuring sub-task performance during the timed up-and-go test. Sensors. 2017;17:4. doi:10.3390/s17040934
18. Moe-Nilssen R, Helbostad JL. Estimation of gait cycle characteristics by trunk accelerometry. J Biomech. 2004;37(1):121–126. doi:10.1016/s0021-9290(03)00233-1
19. Kobayashi H, Kakihana W, Kimura T. Combined effects of age and gender on gait symmetry and regularity assessed by autocorrelation of trunk acceleration. J Neuroeng Rehabil. 2014;11:109. doi:10.1186/1743-0003-11-109
20. Martinez-Ramirez A, Martinikorena I, Gomez M, et al. Frailty assessment based on trunk kinematic parameters during walking. J Neuroeng Rehabil. 2015;12:48. doi:10.1186/s12984-015-0040-6
21. Menz HB, Lord SR, Fitzpatrick RC. Acceleration patterns of the head and pelvis when walking on level and irregular surfaces. Gait Posture. 2003;18(1):35–46. doi:10.1016/s0966-6362(02)00159-5
22. Bellanca JL, Lowry KA, Vanswearingen JM, Brach JS, Redfern MS. Harmonic ratios: a quantification of step to step symmetry. J Biomech. 2013;46(4):828–831. doi:10.1016/j.jbiomech.2012.12.008
23. Martinikorena I, Martinez-Ramirez A, Gomez M, et al. Gait variability related to muscle quality and muscle power output in frail nonagenarian older adults. J Am Med Dir Assoc. 2016;17(2):162–167. doi:10.1016/j.jamda.2015.09.015
24. Pincus SM. Approximate entropy as a measure of system complexity. Proc Natl Acad Sci USA. 1991;88(6):2297–2301. doi:10.1073/pnas.88.6.2297
25. Guyon I, Elisseeff A. An introduction to variable and feature selection. J Mach Learn Res. 2003;3:1157–1182.
26. Saeys Y, Inza I, Larranaga P. A review of feature selection techniques in bioinformatics. Bioinformatics. 2007;23(19):2507–2517. doi:10.1093/bioinformatics/btm344
27. Attal F, Mohammed S, Dedabrishvili M, Chamroukhi F, Oukhellou L, Amirat Y. Physical human activity recognition using wearable sensors. Sensors. 2015;15(12):31314–31338. doi:10.3390/s151229858
28. Gadelha AB, Neri SGR, de Oliveira RJ, et al. Severity of sarcopenia is associated with postural balance and risk of falls in community-dwelling older women. Exp Aging Res. 2018;44(3):258–269. doi:10.1080/0361073x.2018.1449591
29. Kurz I, Oddsson L, Melzer I. Characteristics of balance control in older persons who fall with injury–a prospective study. J Electromyogr Kinesiol. 2013;23(4):814–819. doi:10.1016/j.jelekin.2013.04.001
30. Kim JK, Bae MN, Lee KB, Hong SG. Identification of patients with sarcopenia using gait parameters based on inertial sensors. Sensors. 2021;21:5. doi:10.3390/s21051786.
31. Bourdenas T, Sloman M. Towards Self-Healing in Wireless Sensor Networks. Proceedings of the Sixth International Workshop on Wearable and Implantable Body Sensor Networks; Berkeley, USA; IEEE; 2009.
 © 2021 The Author(s). This work is published and licensed by Dove Medical Press Limited. The
full terms of this license are available at https://www.dovepress.com/terms
and incorporate the Creative Commons Attribution
- Non Commercial (unported, 3.0) License.
By accessing the work you hereby accept the Terms. Non-commercial uses of the work are permitted
without any further permission from Dove Medical Press Limited, provided the work is properly
attributed. For permission for commercial use of this work, please see paragraphs 4.2 and 5 of our Terms.
© 2021 The Author(s). This work is published and licensed by Dove Medical Press Limited. The
full terms of this license are available at https://www.dovepress.com/terms
and incorporate the Creative Commons Attribution
- Non Commercial (unported, 3.0) License.
By accessing the work you hereby accept the Terms. Non-commercial uses of the work are permitted
without any further permission from Dove Medical Press Limited, provided the work is properly
attributed. For permission for commercial use of this work, please see paragraphs 4.2 and 5 of our Terms.