Back to Journals » Clinical Ophthalmology » Volume 14
Predicting Lifetime Transition Risk of Severe Visual Field Defects Using Monte Carlo Simulation in Japanese Patients with Primary Open-Angle Glaucoma
Authors Nitta K ![]() , Tachibana G, Wajima R, Inoue S, Ohigashi T, Otsuka N, Kurashima H, Santo K, Hashimoto M, Shibahara H, Hirukawa M, Sugiyama K
, Tachibana G, Wajima R, Inoue S, Ohigashi T, Otsuka N, Kurashima H, Santo K, Hashimoto M, Shibahara H, Hirukawa M, Sugiyama K
Received 29 January 2020
Accepted for publication 28 May 2020
Published 10 July 2020 Volume 2020:14 Pages 1967—1978
DOI https://doi.org/10.2147/OPTH.S247618
Checked for plagiarism Yes
Review by Single anonymous peer review
Peer reviewer comments 2
Editor who approved publication: Dr Scott Fraser
Koji Nitta,1,2 Gaku Tachibana,1,2 Ryotaro Wajima,1,2 Sachie Inoue,3 Tatsuya Ohigashi,4 Naomi Otsuka,4 Hiroaki Kurashima,4 Kazunori Santo,4 Masayo Hashimoto,4 Hidetoshi Shibahara,3 Mai Hirukawa,3 Kazuhisa Sugiyama2
1Department of Ophthalmology, Fukui-Ken Saiseikai Hospital, Fukui, Japan; 2Department of Ophthalmology, Kanazawa University Graduate School of Medical Science, Kanazawa, Japan; 3CRECON Medical Assessment Inc., Tokyo, Japan; 4Japan Medical Affairs Group, Santen Pharmaceutical Co., Ltd., Osaka, Japan
Correspondence: Koji Nitta Email [email protected]
Purpose: To maintain visual fields and quality of life over a lifetime, medical practice must be conducted taking into consideration not only visual field progression but also future visual field changes that occur over the patients’ expected lifespan. The purpose of this study is to investigate the feasibility of establishing a model that predicts prognosis, estimating the proportion of glaucoma patients with severe visual field defects.
Patients and Methods: The data of 191 patients with primary open-angle glaucoma, with a predominance of normal-tension glaucoma, were used for this study. The model was developed based on patients’ backgrounds and risk factors, using Monte Carlo simulation. A “severe visual field defect” was defined as ≤-20 dB. The mean deviation (MD) value for 10,000 virtual patients in each simulation pattern (144 patterns) was calculated using a predictive formula to estimate the MD slope, and the effects of risk factors and intraocular pressure (IOP) reduction on the proportion of patients with severe visual field defects were evaluated.
Results: Younger age, later-stage disease, more severe glaucomatous structural abnormalities and the presence of disc hemorrhage were associated with an increase in the progression rate of patients with severe visual field defects. Conversely, lower IOP was associated with a decrease in this rate.
Conclusion: Combining regression analysis with Monte Carlo simulation could be a useful method for developing predictive models of prognosis in glaucoma patients.
Keywords: glaucoma, epidemiology, prognosis, risk factors, simulation
Introduction
Glaucoma is a progressive neurodegenerative disease characterized by the progression of irreversible morphological degeneration in the optic nerve head or retinal nerve fiber layer, and visual field defects.1 In order to maintain the visual fields over a lifetime, we need accurate evaluation of the progression of glaucoma and long-term treatment, with prediction of future outcomes. The number of patients with glaucomatous blindness worldwide in 2010 was reported to be 2.1 million, and those with moderate to severe visual disorders related to glaucoma numbered 4.2 million.2 In the future, societal aging will accelerate worldwide, and thus the treatment duration of glaucoma may be prolonged. Therefore, for future glaucoma management, there will be an increased need to predict the progression of glaucoma and select appropriate therapeutic strategies.
The only evidence-based treatment for glaucoma is intraocular pressure (IOP)-lowering therapy.3–5 Various guidelines recommend setting the target IOP for individual patients based on the rate of disease progression.6–9 Previous studies attempted to predict the rate of visual field progression quantitatively based on risk factors. De Moraes et al reported a formula for predicting the mean deviation (MD) slope, which is commonly used as an index of visual field progression, from variables related to age, central corneal thickness (CCT), disc hemorrhage (DH), IOP, peripapillary atrophy, exfoliation, and glaucoma surgery. This formula was developed using a multiple regression analysis based on patient data obtained from the New York Glaucoma Progression Study.10 Medeiros et al also established a formula to predict the MD slope from variables relating to IOP, CCT, and optic disc progression. This formula was developed using a Bayesian regression analysis based on patient data obtained from the Diagnostic Innovations in Glaucoma Study.11 Furthermore, we reported a formula to predict the MD slope from the severity of glaucomatous structural abnormalities (retinal nerve fiber layer defect [RNFLD] angle and vertical cup-disc ratio [C/D]), presence or absence of DH, and percent change in IOP. This formula was developed using a multiple regression analysis based on data obtained from patients with primary open-angle glaucoma (POAG), mainly comprising normal-tension glaucoma (NTG).12
In the management of glaucoma, it is important to maintain the patient’s visual fields over his/her lifetime to prevent the quality of vision being negatively impacted. In order to achieve this, medical care must be provided in consideration of the future visual fields during the patient’s lifespan, as well as visual field progression.6,8,9 However, methods for lifelong visual field prediction based on the combination of these factors have not yet been examined in detail. Such an approach may contribute to the provision of personalized medication for individual glaucoma patients.
In the present study, we conducted a Monte Carlo simulation to investigate the feasibility of establishing a model that estimates the rate at which individual patient’s transition to severe visual field defects over their lifetime, based on their risk factors and examination of the effect of IOP reduction. The results of this study are also intended to be used as one of the tools that allow shared decision-making in clinical practice.
Materials and Methods
Acquisition of Patient Data
We used data obtained from our previous retrospective, long-term study involving patients diagnosed with POAG (high tension glaucoma [HTG]) or NTG at Fukui-ken Saiseikai Hospital between June 2009 and May 2015. In that study, data were acquired with respect to 20 clinical parameters belonging to six categories: (1) patient background, (2) visual field, (3) RNFLD, (4) optic nerve head findings, (5) IOP and (6) DH. These were collected from 498 eligible eyes of 312 patients, and 191 eyes of 191 patients were selected as the population to be analyzed. Details of the selection criteria and data acquisition methods were previously reported.1 The protocol of this study was approved by the Ethics Review Board of the Fukui-ken Saiseikai Hospital, and was conducted in accordance with the Declaration of Helsinki and Ethical Guidelines for Medical and Health Research Involving Human Subjects (issued by the Ministry of Education, Culture, Sports, Science and Technology and Ministry of Health, Labour and Welfare on December 22, 2014). Informed consent was obtained from patients using “opt-out” prior to the start of this study, under approval from the Ethics Review Board.
Model Development
This prognosis-predicting model was developed to predict changes in the MD value over the lifetime of individual patients using our formula for estimating the MD slope of POAG patients. The details of formula development were previously reported,12 and can be summarized in the outline as follows. This formula was obtained using a multiple regression analysis with data on 20 clinical parameters, belonging to six categories, from the above patient population (191 eyes of 191 patients). The severity of glaucomatous structural abnormalities (baseline RNFLD angle and baseline vertical C/D), presence or absence of DH, and mean percent change in IOP were selected as predictive parameters by stepwise regression and the population of 133 eyes of 133 patients that included all four predictive parameters. The RNFLD angle was defined by constructing a 3.4 mm circle centered on the disc center, and finding the angle subtended at the center by the arc that covered the entire RNFLD (Figure 1).
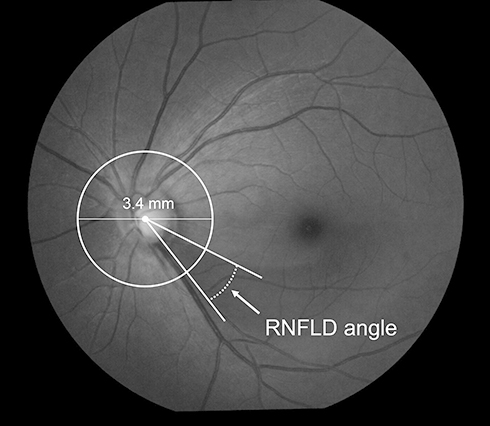 |
Figure 1 Definition of RNFLD Angle. Draw a circle with a diameter of 3.4 mm centered on the disc center. Determine the points where the circle intersects the RNFLD. Draw a line between each point of intersection and the disc center. The RNFLD angle is defined as the angle between the two resulting lines. Abbreviation: RNFLD, retinal nerve fiber layer defect. |
Formula for predicting the MD slope (dB/year)
MD slope = 0.581 + [(Baseline RNFLD angle) × −0.002] + [(Baseline vertical C/D) × −1.079] + [(Presence of DH) × −0.184] + [(Mean IOP change (%)) × −0.006]
The coefficient of determination for this formula was 0.195. Its internal validity was confirmed using a random sampling method (bootstrap method). Furthermore, the discriminative ability was confirmed to have moderate performance by calculating the area under the curve (AUC) of the receiver-operating characteristic (ROC) curves for detecting an MD slope between −0.1 and −0.5 (dB/year), resulting in a calculated AUC that ranged from 0.736 to 0.772.
Lifetime changes in the MD value in individual patients are predicted based on the MD slope estimated using the above formula, taking into account the patient’s age and MD value. This model was developed using Microsoft Excel, and predicts changes in the MD value over the patient’s lifetime until the average Japanese life expectancy, 84 years,13 is reached. The MD slope was recalculated using the RNFLD angle and vertical C/D every 6 years using the rates of change in the two parameters obtained in a previous study (RNFLD angle: +9.3 degrees/6 years, vertical C/D: +0.0096/6 years).
In this model, lifetime changes in the MD value in 10,000 virtual patients were estimated using Monte Carlo simulation of the MD slope in these patients. Monte Carlo simulation is a method used to estimate an output distribution by setting up probability distributions for each input variable in the model. This technique was also used by Anderson et al to estimate the distribution of the rate of visual field progression in a population consisting of glaucoma patients.14 Various range- or incidence-designated simulation conditions can be readily prepared through random sampling from the distribution of each variable.
To predict the MD slope, the baseline RNFLD angle and baseline vertical C/D were set based on normal distributions calculated from the mean and standard deviation (SD) (baseline RNFLD angle: 46.5 ± 25.8, baseline vertical C/D: 0.79 ± 0.1) in the development sample. Based on this distribution, 10,000 combinations of the baseline RNFLD angle and baseline vertical C/D were prepared through random sampling.
Simulation Conditions
To prepare simulation patterns, we defined two conditions (presence and absence) for DH, four conditions (0, −10, −20, and −30%) for the percent change in IOP, six conditions (0, −2.5, −5, −7.5, −10, and −12.5 dB) for the MD value at the initiation of the simulation, and three conditions (40, 50, and 60 years) for age. We performed a lifetime simulation on 10,000 virtual patients designed by combining these conditions (2 x 4 x 6 x 3 = 144 simulation patterns). Regarding the presence or absence of DH, patients with ≥1 episode of DH during the simulation period (every 6 years) were considered to have DH, while those with no episode were not. The same conditions for DH were used for the lifetime simulation. Patients, extracted by random sampling, with a clinically improbable RNFLD angle and vertical C/D (RNFLD angle: <0 degrees, or vertical C/D: >1.0) were excluded from this simulation. Concerning the vertical C/D, there may have been some cases in which values exceeded the upper limit (1.0) during the simulation period with the correction of the rate of change every 6 years. In these cases, the vertical C/D was fixed at the upper limit, and subsequent changes in the MD value were estimated.
Analysis of Results
In this analysis, high-risk patients were defined as those with severe visual field defects (≤-20 dB) at age 84. Severe visual field loss was used as the study outcome because a binary outcome like severe visual field loss is easy for patients to understand. In each simulation pattern, the number and rate of high-risk patients were calculated. In addition, simulation results were divided into 20 groups based on the RNFLD angle (4 grades: 0–30, >30–60, >60–90, and >90 degrees) and vertical C/D (5 grades: ≤0.6, >0.6–0.7, >0.7–0.8, >0.8–0.9, and >0.9–1.0) at the initiation of the simulation of each pattern. In each group, the number and rate of high-risk patients were calculated, and the influence of the percent change in IOP, MD value, age, presence or absence of DH, and severity of glaucomatous structural abnormalities on that rate was examined.
Results
Acquisition of Patient Data
The demographic/ocular characteristics of the 191 eyes of 191 patients investigated in this study are shown in Table 1. Mean ± SD age was 60.9 ± 10.3 years. The disease type was POAG (HTG) with an IOP of >21 mmHg in 23 patients (12.0%) and NTG with an IOP of ≤21 mmHg in 168 patients (88.0%). The MD value at the start of observations was −6.41 ± 5.18 dB. RNFLD was observed in 167 patients (87.4%), with an angle of 46.5 ± 25.8 degrees and vertical C/D of 0.79 ± 0.10. The mean percent change in IOP over 6 years was −19.7 ± 13.3%. DH was observed in 62 patients (32.5%).
 |
Table 1 Demographic/Ocular Characteristics |
Model Development
A predictive model was developed for estimating lifetime change in the MD value in 10,000 virtual patients. The structure of the predictive model is shown in Figure 2.
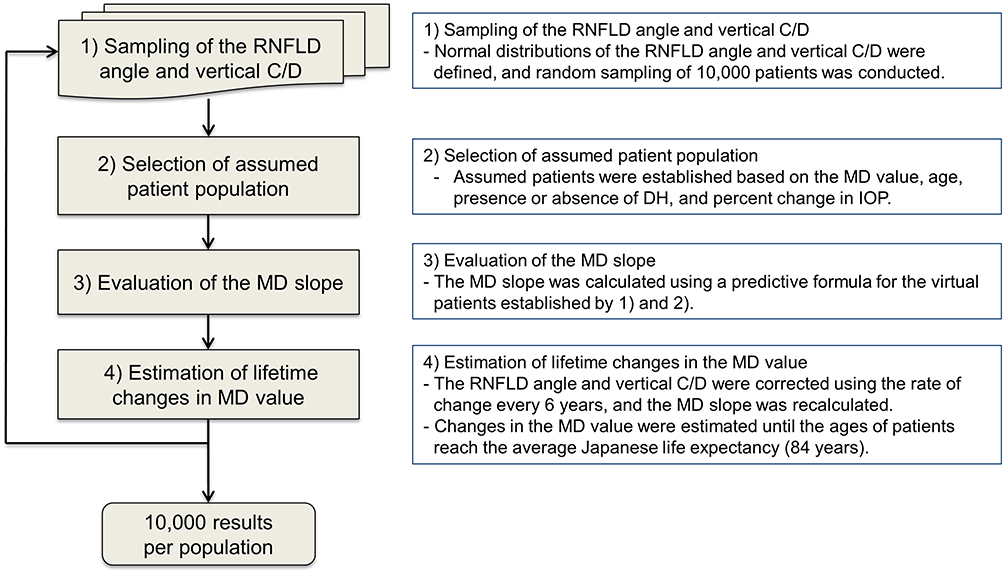 |
Figure 2 Structure of the simulation model. Lifetime changes in the MD value were calculated using these four steps. This process was repeated 10,000 times for each simulation pattern. Abbreviations: RNFLD, retinal nerve fiber layer defect; C/D, cup–disc ratio; MD, mean deviation; IOP, intraocular pressure; DH, disc hemorrhage. |
Simulation Conditions
The number of virtual patients analyzed was 9497, after extraction from the distributions of RNFLD angle and vertical C/D values by random sampling. Five hundred and three virtual patients who were clinically improbable (RNFLD angle: <0 degrees (n = 361), or vertical C/D: >1.0 (n = 147), or both (n = 5)) were excluded from the analysis.
Analysis of Results
With respect to the above 9497 virtual patients, we calculated the rate (%) of high-risk patients in each simulation pattern (total number: 144 patterns), as shown in Figure 3. High-risk patients were defined as those with severe visual field defects (≤-20 dB) at age 84. The influence of each variable on the rate of high-risk patients is described in the following section.
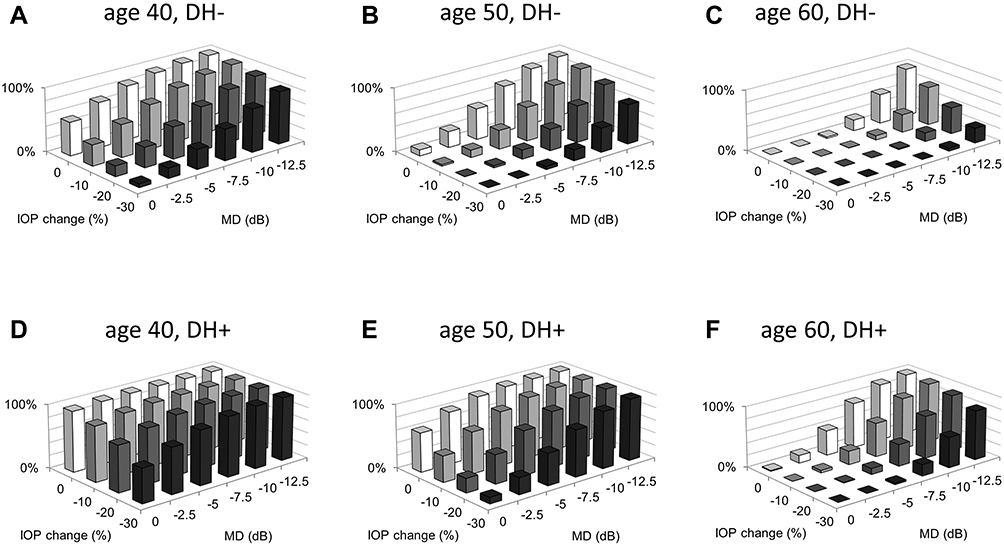 |
Figure 3 The proportion of high-risk patients. The proportions (%) of high-risk patients in 144 simulation patterns are shown. Each bar indicates the proportion of high-risk patients in 9497 virtual patients. (A) age 40, without DH, (B) age 50, without DH, (C) age 60, without DH, (D) age 40, with DH, (E) age 50, with DH, (F) age 60, with DH. Abbreviations: DH, disc hemorrhage; IOP, intraocular pressure; MD, mean deviation. |
Influence of the MD Value at the Initiation of the Simulation
Where the percent change in IOP was 0% in the absence of DH at age 50, the proportions of high-risk patients with MD values of −2.5, −7.5, and −12.5 dB were 25.2%, 72.8%, and 97.1%, respectively (Figure 3B). Similar results were observed in other cases; the proportion of high-risk patients increased with a decrease in the MD value at the initiation of the simulation.
Influence of the Presence or Absence of DH
Where the percent change in IOP was 0% at age 50, with an MD value of −7.5 dB at the initiation of the simulation, the proportion of high-risk patients was 98.7% if DH was present, while in its absence the corresponding figure was 72.8% (Figure 3B and E). Similar results were observed for the other cases; the proportion of high-risk patients was greater in the presence of DH than that where it was absent.
Influence of the Percent Change in IOP
Where the MD value was −7.5 dB in the absence of DH at age 50, the proportions of high-risk patients for a percent change in IOP of 0%, −10%, −20%, and −30% were 72.8%, 53.6%, 33.9%, and 17.2%, respectively (Figure 3B). Similar results were observed in other cases; the proportion of high-risk patients decreased with a reduction in IOP.
Influence of the Severity of Glaucomatous Structural Abnormalities
We analyzed 20 structural abnormalities-based groups, which were classified according to the RNFLD angle (4 grades) and vertical C/D (5 grades) at the initiation of the simulation. A representative case in the presence or absence of DH at ages 50 is presented in Figures 4 and 5. The influence of the severity of glaucomatous structural abnormalities, such as the RNFLD angle and vertical C/D, on the rate of high-risk patients can be evaluated by comparing the proportion in each simulation pattern. For example, in the patients without DH at age 50 when the percent change in IOP was 0%, with an MD value of −7.5 dB and RNFLD angle of 30 to 60 degrees, the proportions of high-risk patients at a vertical C/D of >0.7 to 0.8, >0.8 to 0.9, and >0.9 to 1.0 were 80.7%, 100%, and 100%, respectively (Figures 4B and 5A).
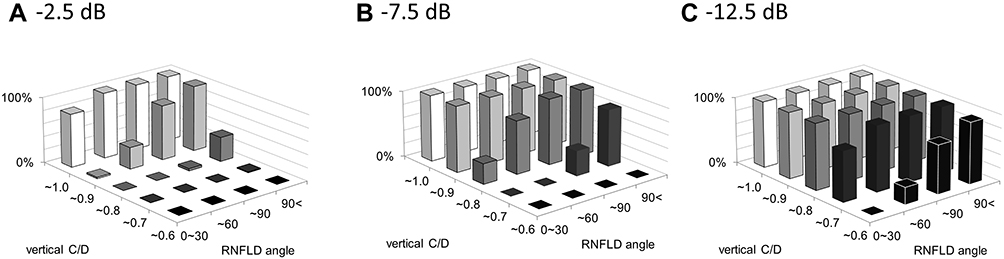 |
Figure 4 The proportion of high-risk patients in representative case at age 50. The proportion (%) of high-risk patients without DH at age 50 where the percent change in IOP is 0%: (A) MD value is −2.5 dB, (B) MD value is −7.5 dB, (C) MD value is −12.5 dB. Abbreviations: DH, disc hemorrhage; MD, mean deviation; RNFLD, retinal nerve fiber layer defect; C/D, cup–disc ratio. |
Discussion
In the present study, we evaluated the feasibility of developing a model to estimate the rate of transition to severe visual field defects by simulating changes in the MD value over the patient’s lifetime based on the disease stage, age, presence or absence of DH, percent change in IOP, and severity of glaucomatous structural abnormalities (RNFLD angle and vertical C/D) using the Monte Carlo method.
Various guidelines recommend that therapeutic strategies should be selected in consideration of the disease stage and life expectancy.6,8,9 However, actual selection methods have not yet been indicated. In the present study, we simulated lifetime changes in the MD value in consideration of these factors. In clinical practice, there is a specific need to identify early- to moderate-stage patients with a long life expectancy. Severe visual field loss was used as the study outcome. Through the use of a clear, binary outcome, results of this study could be used to educate patients. Although there is no clear cut-off value that defines a “severe visual field defect” while concentrating the patient’s quality of life (QoL), previous research indicates that a decrease in the MD value by −20 dB causes decreased QoL in glaucoma patients.15 Therefore, we focused on the proportion of high-risk patients (MD ≤-20 dB) among those with early-to-moderate stage disease (0 to −12.5 dB) and a long life expectancy (aged 40, 50 or 60 years). The results show that the proportion of high-risk patients increases with a decrease in the MD value at the initiation of the simulation, and that it was higher at a younger age (Figure 3). These findings suggest the importance of considering future visual field over the lifespan of the patient in treating glaucoma in order to maintain visual fields for life.
In the present study, we examined the influence of DH on the proportion of high-risk patients. Various studies have investigated risk factors for the progression of visual field loss in glaucoma, and many reports suggest the involvement of DH.16,17 A study using data from long-term (15-year) observations involving POAG patients indicated that the cumulative probability of DH reached a plateau.18 This finding suggests that POAG patients comprise those with and without DH. Therefore, we defined patients with and without DH in this model. The results showed that the proportion of high-risk patients was higher in patients with DH than in those without DH (Figure 3). In our previous retrospective long-term study, DH was observed in 32.5% of patients during the six-year observation period, and we previously reported that the average prevalence of DH was 44.1% over an 8.2-year observation period in Japanese patients with NTG.19 Suh et al also reported that the prevalence of DH was 33.3% and 17.6% averaged over a five-year observation period in Korean patients with NTG and POAG, respectively.18 Based on these findings, patients with DH are not rare in clinical practice. Therefore, in order to accurately evaluate the prognosis of individual patients, it is important to carefully examine funduscopic findings in each patient at every visit.
The only evidence-based treatment for glaucoma is IOP-lowering therapy. A previous large-scale clinical study indicated that a 20% to 30% reduction in IOP was effective for preventing the progression of visual field defects,20 and various guidelines recommend that IOP is adequately targeted based on these findings. The concept of our predictive model is to determine IOP targets for individuals based on demographic (age) and ocular characteristics (MD value, presence or absence of disc hemorrhage, severity of glaucomatous structural abnormalities); we believe that this information will be valuable in daily practice. Therefore, we examined the proportion of high-risk patients by setting the percent change in IOP to 0, −10, −20, and −30%. This resulted in a decrease in the rate proportion of high-risk patients as IOP decreased (Figure 3), indicating that a lower target IOP is needed for patients with risk factors.
In this model, lifetime changes in the MD value were simulated using the RNFLD angle and vertical C/D, which reflect glaucomatous structural abnormalities, as continuous variables. In order to investigate the influence of the severity of structural abnormalities on the proportion of high-risk patients, 20 groups were defined (RNFLD angle: 4 grades, vertical C/D: 5 grades). The results indicate that the proportion of high-risk patients drastically increased with the severity of glaucomatous structural abnormalities; therefore, it is suggested that accurate examination of structural abnormalities is important for prognosis evaluation (Figure 5–7). Furthermore, the proportion of high-risk patients depends on the combination of the RNFLD angle and vertical C/D; hence, both parameters need to be evaluated. It should be noted that improbable combinations of RNFLD angle and vertical C/D could potentially be included in these results because a normal distribution was used in the Monte Carlo simulation. However, patients with a small RNFLD angle (≤30 degrees), with a large vertical C/D (0.9<) and a large RNFLD angle (90<) with small vertical C/D (≤0.6) were observed in actual patient data. Therefore, this classification is considered to be reasonable. In clinical practice, examining RNFLD is difficult in some patients. In such cases, methods using red-free fundus photographs or black and white fundus photographs obtained by extracting just the blue component are useful. Use of RNFLD examinations may contribute to the precise assessment of the prognosis of individual patients. Figures 5 and 7 suggest that even some patients with mild visual field defects show transition to severe visual field defects during their lifetime, depending on the severity of glaucomatous structural abnormalities. Therefore, the severity of structural abnormalities needs to be accurately examined and therapeutic strategies should be selected in consideration of these risk factors. Despite the presence of glaucomatous structural abnormalities, visual field defects are not detected with standard automated perimetry in some patients. These patients are regarded as having preperimetric glaucoma (PPG) and the necessity for treatment is decided by individual physicians.6 This type of model has the potential to help physicians to assess the necessity for treatment of patients with PPG (eg, those with an RNFLD angle of 0 to 30 degrees and a vertical C/D of >0.8 to 0.9), because glaucoma progression is considered to be a continuum from an asymptomatic preperimetric stage to a functionally impaired perimetric stage.21
 |
Figure 5 The proportion of high-risk patients in representative case (age 50). The proportion (%) of high-risk patients at age 50 is shown, (A) without DH, (B) with DH. The risk can be estimated by combining the MD value, percent change in IOP, and the severity of glaucomatous structural abnormalities (RNFLD angle and vertical C/D). Abbreviations: DH, disc hemorrhage; RNFLD, retinal nerve fiber layer defect; C/D, cup–disc ratio; IOP, intraocular pressure; MD, mean deviation. |
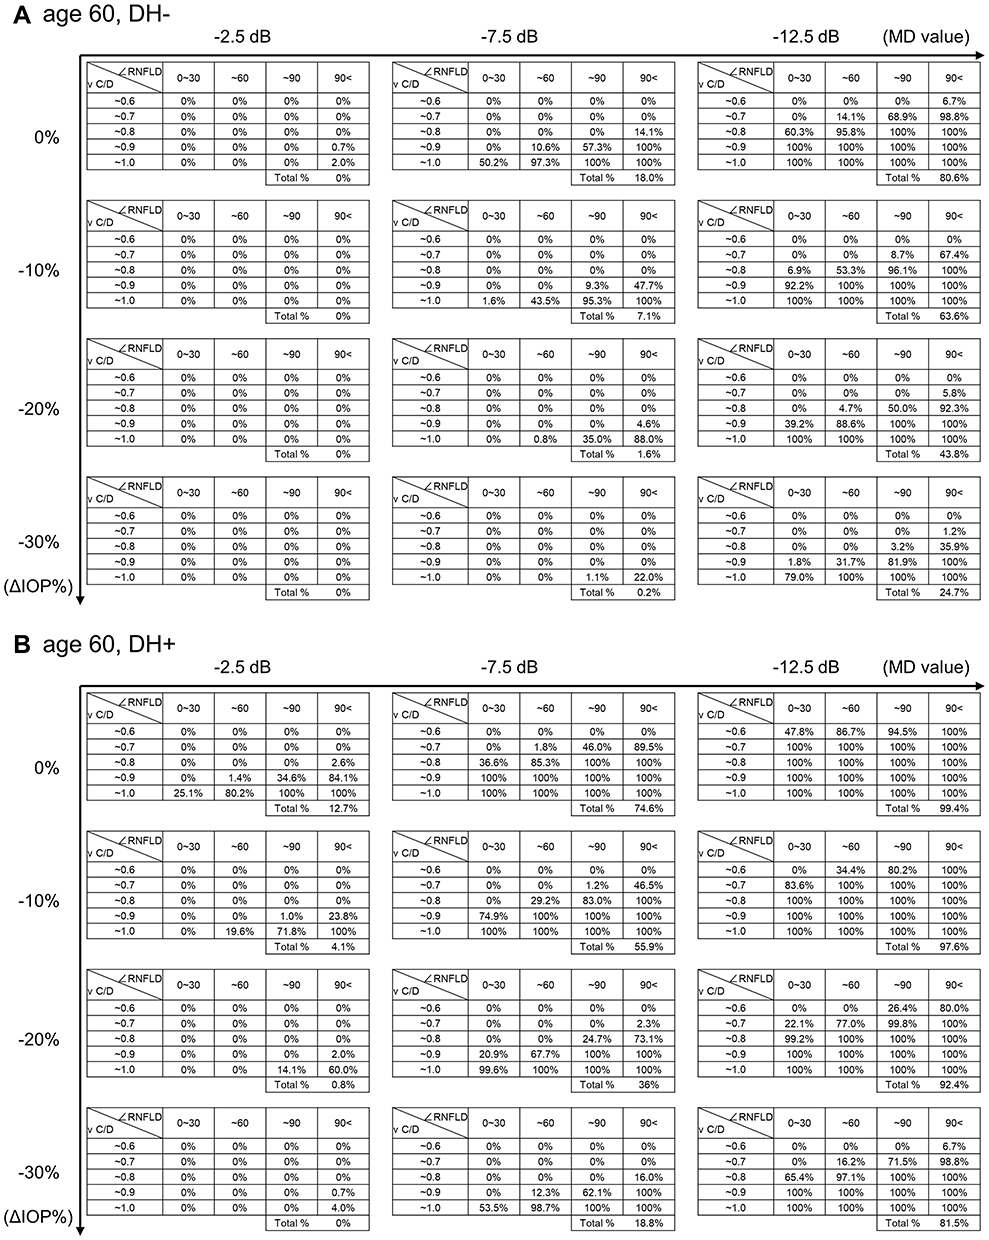 |
Figure 6 The proportion of high-risk patients in representative case (age 60). The proportion (%) of high-risk patients at age 60 is shown, (A) without DH, (B) with DH. The risk can be estimated by combining the MD value, percent change in IOP, and the severity of glaucomatous structural abnormalities (RNFLD angle and vertical C/D). Abbreviations: DH, disc hemorrhage; RNFLD, retinal nerve fiber layer defect; C/D, cup–disc ratio; IOP, intraocular pressure; MD, mean deviation. |
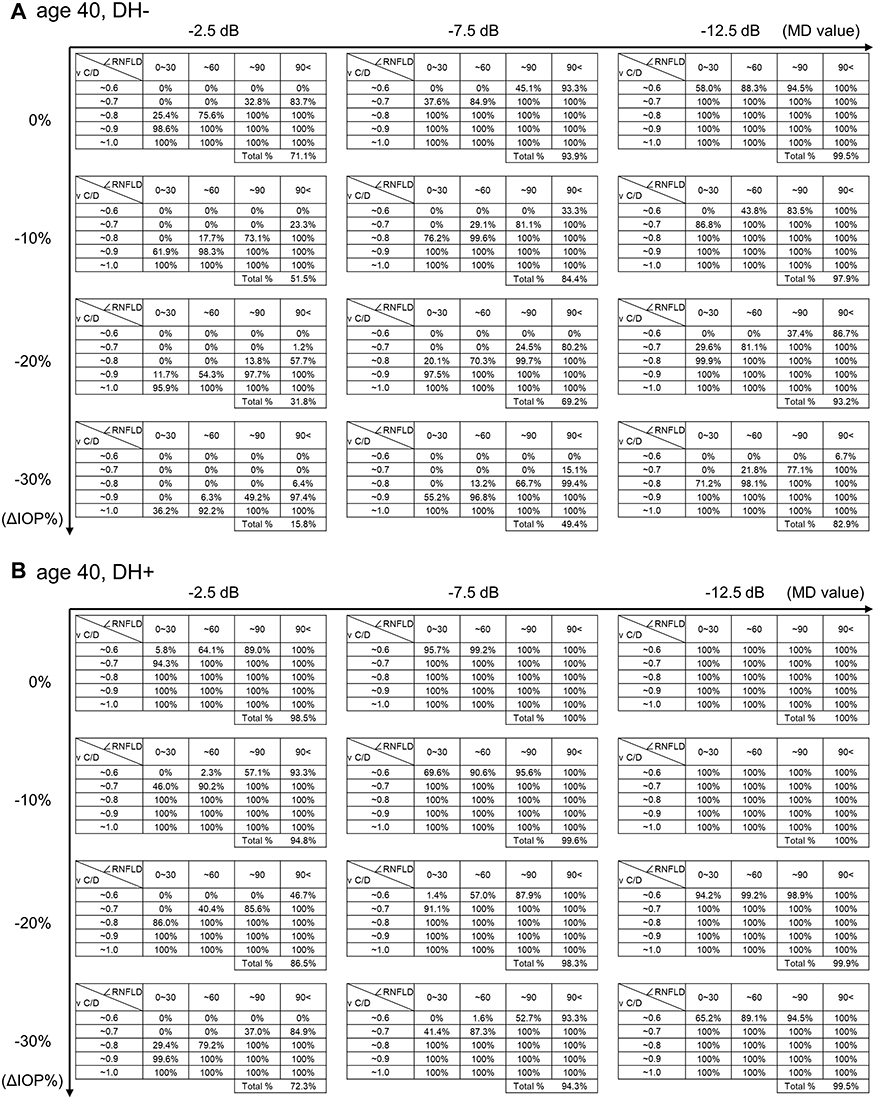 |
Figure 7 The proportion of high-risk patients in representative case (age 40). The proportion (%) of high-risk patients at age 40 is shown, (A) without DH, (B) with DH. The risk can be estimated by combining the MD value, percent change in IOP, and the severity of glaucomatous structural abnormalities (RNFLD angle and vertical C/D). Abbreviations: DH, disc hemorrhage; RNFLD, retinal nerve fiber layer defect; C/D, cup–disc ratio; IOP, intraocular pressure; MD, mean deviation. |
In the present study, we obtained results of 9497 × 144 comprehensive predictions by evaluating various disease stages, ages, the presence or absence of DH, and the percent change in IOP. Some results are shown in Figure 5–7. The proportion of high-risk patients can be estimated based on the MD value, age, presence or absence of DH, percent change in IOP, the RNFLD angle, and vertical C/D in individual patients. Furthermore, a reference value for an adequate target IOP for individual patients could be estimated by comparing results among the percent change in IOP: 0, −10, −20, and −30%. Thus, this type of model could be useful to quantitatively estimate the rate of transition to severe visual field defects in individual patients and also in reviewing the target IOP. It should be noted that a low rate of transition to severe visual field defects in this model does not mean that visual field defects do not progress. Therefore, it is important to select therapeutic strategies while evaluating the rate of visual field progression using the MD slope in clinical practice. Furthermore, since the patient’s quality of vision does not depend on the MD value alone,22,23 the pattern of a visual field defect also needs to be considered.
Glaucoma is a chronic disease, and patient adherence to lifelong medication is essential for adequate treatment of glaucoma. However, the presence of dropout cases or patients with poor adherence is recognized as one of the major issues in glaucoma treatment.24,25 Previous studies showed that understanding of the disease and the necessity for treatment were insufficient in these patients.26,27 A patient’s understanding of the necessity for treatment will be improved by presenting the simulation results, and consequently, this model could contribute to the continuation of treatment, adherence, and acquisition of therapeutic effects.
Although the aim of this study is to investigate the feasibility of establishing a model, it is difficult to apply it directly to clinical use because it has some limitations. First, the predictive formula used in this model was established based on data obtained in a six-year retrospective, observational study; hence, the accuracy of predictions over a few decades has not yet been confirmed. A predictive model for clinical use should be examined by conducting studies using data from long-term observations. Second, the predictive formula itself has some limitations. The formula performs moderately well (coefficient of determination = 0.195, area under the curve = 0.75). The formula was established based on data from a single institution, and its external validity in other populations has not been investigated. In addition, NTG accounted for 88% of the patient population used to establish the formula. Therefore, it currently remains unclear whether the results of predictions using this model apply to all glaucoma patients. Untreated patients and patients with a history of glaucoma surgery were excluded from the development sample; hence, a rate of IOP change of 0% in this study does not mean the absence of treatment, and the effects of a surgery-related IOP reduction currently remain unclear. In this study, the prevalence of DH was carefully observed using a stereo fundus camera at each visit.12 However, it is possible that not all DHs were detected because the interval of the examination was generally every 3 months, and DHs could appear and disappear between examinations.27,28 We have already established a database in our previous study, however the sample size is just 500 patients, and the follow-up period, 6 years. Using our database, it is difficult to predict the lifetime transition risk of severe visual field defects in individual patients. In addition, there is no publicly available, large-scale, long-term, real-world database in Japan. Furthermore, the variables used in the previous study were limited because the dataset was obtained from daily practice.12 In the future, prospective studies with a range of variables such as those obtained from advanced imaging technique (OCTA, etc.) will be needed to establish better predictive accuracy.
In the present study, we confirmed the feasibility of developing a model to estimate the rate of transition to severe visual field defects based on the disease stage, age, presence or absence of DH, percent change in IOP, and severity of glaucomatous structural abnormalities in POAG patients. In the near future, more accurate predictive formulae will be established with cutting-edge technology such as big data analysis and machine learning. Therefore, combining regression analysis with Monte Carlo simulation would be a useful method for establishing a predictive model that allows us to set an adequate target IOP for individual glaucoma patients, thereby contributing to the promotion of personalized medicine.
Conclusion
Combining regression analysis with Monte Carlo simulation is potentially a useful method for developing a predictive model for prognosis in glaucoma patients.
Acknowledgments
This paper was presented at the 7th World Glaucoma Congress 2017 as a poster presentation with interim findings. The poster’s abstract was published in ‘Poster Abstracts’ in 7th World Glaucoma Congress 2017 –Abstract Book; 2017:137: [http://www.worldglaucoma.org/Download/dl_files.php?id=84].
Disclosure
Nitta K, Tachibana G and Wajima R received research grants from Santen. Nitta K and Sugiyama K received honoraria from Santen for lectures. Nitta K, Tachibana G and Sugiyama K received travel fees from Santen. Sugiyama K received consulting fees from Santen, Kow, Senju, and Ohtsuka. Ohigashi T, Otsuka N, Kurashima H, Santo K and Hashimoto M are employees of Santen. Inoue S, Shibahara H, and Hirukawa M are employees of CRECON Medical Assessment Inc. CRECON Medical Assessment Inc. was paid to conduct analyses for this manuscript. The authors report no other conflicts of interest in this work.
References
1. Weinreb RN, Khaw PT. Primary open-angle glaucoma. Lancet. 2004;363(9422):1711–1720. doi:10.1016/S0140-6736(04)16257-0
2. Bourne RR, Taylor HR, Flaxman SR, et al. Number of people blind or visually impaired by glaucoma worldwide and in world regions 1990–2010: a meta-analysis. PLoS One. 2016;11(10):e0162229. doi:10.1371/journal.pone.0162229
3. The AGIS Investigators.The. Advanced Glaucoma Intervention Study (AGIS): 7. The relationship between control of intraocular pressure and visual field deterioration. Am J Ophthalmol. 2000;130(4):429–440. doi:10.1016/S0002-9394(00)00538-9
4. Lichter PR, Musch DC, Gillespie BW, et al. Interim clinical outcomes in the collaborative initial glaucoma treatment study comparing initial treatment randomized to medications or surgery. Ophthalmology. 2001;108(11):1943–1953. doi:10.1016/S0161-6420(01)00873-9
5. Heijl A, Leske MC, Bengtsson B, et al. Reduction of intraocular pressure and glaucoma progression: results from the early manifest glaucoma trial. Arch Ophthalmol. 2002;120(10):1268–1279. doi:10.1001/archopht.120.10.1268
6. Japan Glaucoma Society. [The Japan glaucoma society guidelines for glaucoma (3rd Edition)].. Nihon Ganka Gakkai Zasshi. 2012;116(1):3–46.
7. Prum BE, Rosenberg LF, Gedde SJ, et al. Primary open-angle glaucoma preferred practice pattern(®) guidelines. Ophthalmology. 2016;123(1):41–111. doi:10.1016/j.ophtha.2015.10.053
8. European Glaucoma Society. Terminology and guidelines for glaucoma, 4th edition – chapter 3: treatment principles and options supported by the EGS foundation: part 1: foreword; introduction; glossary; chapter 3 treatment principles and options. Br J Ophthalmol. 2017;101(6):130–195. doi:10.1136/bjophthalmol-2016-EGSguideline.003
9. Asian Pacific Glaucoma Society. Asia Pacific Glaucoma Guidelines.
10. De Moraes CG, Sehi M, Greenfield DS, Chung YS, Ritch R, Liebmann JM. A validated risk calculator to assess risk and rate of visual field progression in treated glaucoma patients. Invest Ophthalmol Vis Sci. 2012;53(6):2702–2707. doi:10.1167/iovs.11-7900
11. Medeiros FA, Zangwill LM, Mansouri K, Lisboa R, Tafreshi A, Weinreb RN. Incorporating risk factors to improve the assessment of rates of glaucomatous progression. Invest Ophthalmol Vis Sci. 2012;53(4):2199–2207. doi:10.1167/iovs.11-8639
12. Nitta K, Wajima R, Tachibana G, et al. Prediction of visual field progression in patients with primary open-angle glaucoma, mainly including normal tension glaucoma. Sci Rep. 2017;7(1):15048. doi:10.1038/s41598-017-15267-y
13. World Health Organization. World Health Statistics 2016: Monitoring Health for the SDGs Sustainable Development Goals. Geneva (Switzerland): WHO Press; 2016:8.
14. Anderson AJ, Cheng AC, Lau S, Le-Pham A, Liu V, Rahman F. The retest distribution of the visual field summary index mean deviation is close to normal. Ophthalmic Physiol Opt. 2016;36(5):558–565. doi:10.1111/opo.12314
15. Asano K, Kawase K, Yamamoto T. Evaluation of quality of life in glaucoma patients. J Eye. 2006;23(5):655–659.
16. Nitta K, Sugiyama K, Tanahashi T. [Relationship between the frequency of disc hemorrhage and the enlargement of nerve fiber layer defects and the deterioration speed of visual field loss in normal-tension glaucoma with wedge-shaped nerve fiber layer defects]. Nihon Ganka Gakkai Zasshi. 2011;115(9):839–847.
17. De Moraes CG, Juthani VJ, Liebmann JM, et al. Risk factors for visual field progression in treated glaucoma. Arch Ophthalmol. 2011;129(5):562–568. doi:10.1001/archophthalmol.2011.72
18. Suh MH, Park KH. Period prevalence and incidence of optic disc hemorrhage in normal tension glaucoma and primary open-angle glaucoma. Clin Exp Ophthalmol. 2011;39(6):513–519. doi:10.1111/j.1442-9071.2010.02482.x
19. Nitta K, Sugiyama K, Higashide T, Ohkubo S, Tanahashi T, Kitazawa Y. Does the enlargement of retinal nerve fiber layer defects relate to disc hemorrhage or progressive visual field loss in normal-tension glaucoma? J Glaucoma. 2011;20(3):189–195. doi:10.1097/IJG.0b013e3181e0799c
20. Collaborative Normal-Tension Glaucoma Study Group. The effectiveness of intraocular pressure reduction in the treatment of normal-tension glaucoma. Am J Ophthalmol. 1998;126(4):498–505. doi:10.1016/S0002-9394(98)00272-4
21. Weinreb RN, Friedman DS, Fechtner RD, et al. Risk assessment in the management of patients with ocular hypertension. Am J Ophthalmol. 2004;138(3):458–467. doi:10.1016/j.ajo.2004.04.054
22. Sawada H, Yoshino T, Fukuchi T, Abe H. Assessment of the vision-specific quality of life using clustered visual field in glaucoma patients. J Glaucoma. 2014;23(2):81–87. doi:10.1097/IJG.0b013e318265bbdc
23. Cheng HC, Guo CY, Chen MJ, Ko YC, Huang N, Liu CJ. Patient-reported vision-related quality of life differences between superior and inferior hemifield visual field defects in primary open-angle glaucoma. JAMA Ophthalmol. 2015;133(3):269–275. doi:10.1001/jamaophthalmol.2014.4908
24. Rossi GC, Pasinetti GM, Scudeller L, Radaelli R, Bianchi PE. Do adherence rates and glaucomatous visual field progression correlate? Eur J Ophthalmol. 2011;21(4):410–414. doi:10.5301/EJO.2010.6112
25. Pleet A, Sulewski M, Salowe RJ, et al. Risk factors associated with progression to blindness from primary open-angle glaucoma in an African-American population. Ophthalmic Epidemiol. 2016;23(4):248–256. doi:10.1080/09286586.2016.1193207
26. Lacey J, Cate H, Broadway DC. Barriers to adherence with glaucoma medications: a qualitative research study. Eye (Lond). 2009;23(4):924–932. doi:10.1038/eye.2008.103
27. Friedman DS, Hahn SR, Gelb L, et al. Doctor-patient communication, health-related beliefs, and adherence in glaucoma results from the glaucoma adherence and persistency study. Ophthalmology. 2008;115(8):
28. Kitazawa Y, Shirato S, Yamamoto T. Optic disc hemorrhage in low-tension glaucoma. Ophthalmology. 1986;93(6):853–857. doi:10.1016/S0161-6420(86)33658-3
 © 2020 The Author(s). This work is published and licensed by Dove Medical Press Limited. The
full terms of this license are available at https://www.dovepress.com/terms
and incorporate the Creative Commons Attribution
- Non Commercial (unported, 3.0) License.
By accessing the work you hereby accept the Terms. Non-commercial uses of the work are permitted
without any further permission from Dove Medical Press Limited, provided the work is properly
attributed. For permission for commercial use of this work, please see paragraphs 4.2 and 5 of our Terms.
© 2020 The Author(s). This work is published and licensed by Dove Medical Press Limited. The
full terms of this license are available at https://www.dovepress.com/terms
and incorporate the Creative Commons Attribution
- Non Commercial (unported, 3.0) License.
By accessing the work you hereby accept the Terms. Non-commercial uses of the work are permitted
without any further permission from Dove Medical Press Limited, provided the work is properly
attributed. For permission for commercial use of this work, please see paragraphs 4.2 and 5 of our Terms.