Back to Journals » Drug Design, Development and Therapy » Volume 20
Preclinical Pharmacokinetics, ADME, and Drug-Drug Interaction Evaluation of S024, a Novel p38/MK2 Inhibitor for Rheumatoid Arthritis
Authors Ye Q, Xing W, Hu X, Liu W, Wu J, Huang H, Xiao Y, Hong Y
Received 19 January 2026
Accepted for publication 3 April 2026
Published 14 April 2026 Volume 2026:20 591017
DOI https://doi.org/10.2147/DDDT.S591017
Checked for plagiarism Yes
Review by Single anonymous peer review
Peer reviewer comments 2
Editor who approved publication: Professor Yan Zhu
Qianlei Ye,1,2,* Wei Xing,2,* Xuefeng Hu,2 Wenjuan Liu,2 Jigang Wu,2 Hailan Huang,2 Ying Xiao,2 Yanjun Hong1
1School of Pharmaceutical Sciences (Shenzhen), Sun Yat-Sen University, Shenzhen, People’s Republic of China; 2Shenzhen Salubris Pharmaceuticals Co., Ltd, Shenzhen, Guangdong, People’s Republic of China
*These authors contributed equally to this work
Correspondence: Ying Xiao, Email [email protected] Yanjun Hong, Email [email protected]
Introduction: S024 is a novel dual p38/MK2 inhibitor with therapeutic potential for rheumatoid arthritis (RA). Unlike existing RA therapies often limited by suboptimal efficacy and safety profiles, S024 selectively targets the p38/MK2 signaling complex, representing a mechanistically distinct treatment strategy. This study aimed to systematically characterize the preclinical pharmacokinetic (PK), absorption, distribution, metabolism, excretion (ADME), and drug-drug interaction (DDI) profiles of S024.
Methods: Permeability was assessed using Caco-2 cell monolayers. PK and oral bioavailability were determined in Sprague-Dawley (SD) rats and beagle dogs. Plasma protein binding (PPB), tissue distribution, in vitro metabolic stability (across species), enzyme phenotyping, excretion mass balance, and DDI potential against major CYP450 enzymes and key ABC/SLC transporters were comprehensively evaluated.
Results: S024 displayed low permeability in Caco-2 assays, likely attributable to P-gp-mediated efflux. Despite this, oral absorption remained efficient, with high bioavailability in rats (F%=56.3~101%) and dogs (F%=40.1~110%). S024 exhibited moderate PPB across species and minimal red blood cell distribution. Extensive tissue distribution was observed in rats, predominantly in the gastrointestinal tract and well-perfused organs. Hepatic clearance varied significantly across species, with values of 320.9, 43.8, < 25.6, 25.7, and < 10.3 mL/min/kg in mice, rats, dogs, monkeys, and humans, respectively. CYP2C8 and CYP3A were identified as the primary metabolic enzymes. Excretion studies confirmed that S024 was eliminated predominantly as metabolites via feces. DDI profiling revealed only modest inhibition of CYP2C8 (IC50 = 77.2 μM) and weak induction of CYP3A4 mRNA at 10 μM without corresponding enzymatic activity increase. Minimal inhibitory potency was observed against key ABC and SLC transporters, with IC50 values generally exceeding predicted therapeutic concentrations.
Conclusion: S024 demonstrated favorable preclinical PK/ADME properties, characterized by robust oral absorption, moderate PPB, extensive distribution, and a low predicted clinical DDI risk. These findings strongly support its further development as a promising clinical candidate for RA therapy.
Keywords: S024, p38/MK2 inhibitor, pharmacokinetics, ADME profiling, rheumatoid arthritis
Introduction
Rheumatoid arthritis (RA) is a chronic autoimmune disorder of unknown etiology, primarily characterized by synovial inflammation, which serves as its key pathological hallmark. It commonly affects the joints of the hands, wrists, and feet, resulting in swelling, pain, and potential joint deformity.1 Globally, RA affects approximately 17.6 million individuals and exhibits a notably higher prevalence in women compared to men,2 with a female-to-male ratio of up to 4:1.3 Current pharmacological interventions for RA mainly include disease-modifying anti-rheumatic drugs (DMARDs), non-steroidal anti-inflammatory drugs (NSAIDs), and glucocorticosteroids.4 Despite their widespread use, these therapies are often limited by significant adverse effects, including cardiovascular complications and disease relapse following drug discontinuation. Given the rising global prevalence of RA, there is an urgent need for safer and more effective therapeutic strategies.
The precise mechanisms driving RA pathogenesis remain incompletely understood, with multiple cell types contributing to its progression. Fibroblast-like synoviocytes (FLS) are particularly critical, as their dysregulated apoptosis—either excessive or insufficient—drives the secretion of proinflammatory mediators and promotes extracellular matrix degradation via protein hydrolases.5,6 The mitogen-activated protein kinase (MAPK) pathway is highly active in FLS and plays a central role in RA pathogenesis.7
p38, a member of the MAPK family, is significantly upregulated in RA.8 The p38 signaling pathway is a key driver of pro-inflammatory cytokines production, positively modulating the expression of genes associated with inflammation, such as TNF-α, IL-1β, IL-6, and IL-8.9 This inflammatory cascade is largely mediated through MAPK-activated protein kinase 2 (MK2), a critical downstream substrate of p38.10,11 MK2, as a primary substrate of p38, is essential for the regulation of pro-inflammatory cytokines release. Studies have demonstrated that MK2 deficiency markedly reduces the expression of inflammatory mediators, while also suppressing p38 activity.9 Importantly, MK2 regulates a narrower range of genes compared to p38, and its inhibition is associated with a significantly lower risk of toxicity, making it a more attractive therapeutic target than direct p38 inhibition.12,13 Hence, targeting the p38/MK2 pathway has emerged as a promising strategy in RA therapy.
Martin et al demonstrated that WIN55, a synthetic non-selective cannabinoid receptor agonist, exerts anti-inflammatory effects through cannabinoid receptor activation, which suppresses the p38/MK2 signaling pathway.9 Wang et al identified and characterized CC-99677, a selective covalent MK2 inhibitor, which demonstrated oral bioavailability and efficacy in a rat model of ankylosing spondylitis. The compound exhibited linear pharmacokinetics and potent TNF-α suppression in healthy human subjects, alongside a favorable safety profile.14 ATI-450 selectively targets the p38/MK2 complex, locking MK2 in an inactive conformation. It demonstrates concentration-dependent inhibition of cytokine production in both RA synovial fibroblasts and human whole blood (HWB) following stimulation with inflammatory triggers such as LPS.15 Wong et al demonstrated that andrographolide potentially binds to the MK2 activation loop at the phosphorylation site Thr222, leading to the dissociation of the p38/MK2 complex.16 This interaction results in the release of p38 and MK2, with the latter being rapidly degraded by the proteasome. Consequently, the downstream inflammatory signaling pathway is effectively inhibited. Abdel-Magid’s patented inventions focus on synthetic compounds designed as MK2 inhibitors, with potential therapeutic applications in a wide range of diseases, including autoimmune, inflammatory, metabolic, oncological, and cardiovascular disorders.17 Despite extensive research, the clinical translation of p38 inhibitors remains challenging; clinical-stage candidates have been halted primarily due to toxicity or insufficient efficacy.18 The Phase II trial of CC-99677 was terminated due to a lack of short-term efficacy.19 Although ATI-450 showed initial promise in early-phase exploratory studies,20 its subsequent pivotal Phase 2b trial did not demonstrate the anticipated therapeutic efficacy.21
The clinical efficacy of p38 MAPK inhibitors has frequently failed to meet expectations, underscoring the urgent need for robust systematic preclinical evaluations to improve translational success rates.10,22 As the research on lead compounds progresses, optimizing their pharmacokinetic properties has become a key focus in drug development.23,24 Compared to ATI-450, the structurally modified compound 36 exhibited significantly improved pharmacokinetic properties.25 S024 is a structurally novel compound derived from the optimization of ATI-450 and represents a derivative of the compound shown in Scheme 1. S024 selectively targets the p38/MK2 complex, inhibiting MK2 activation and downstream expression of cytokines, including TNF-α, IL-6, and IL-17. S024 demonstrates enhanced biological activity with a reduced risk of off-target effects and drug-drug interactions (DDI). It exhibits potent inhibition of key pro-inflammatory cytokines, including IL-6, TNF-α, and IL-17, highlighting its therapeutic potential for RA.
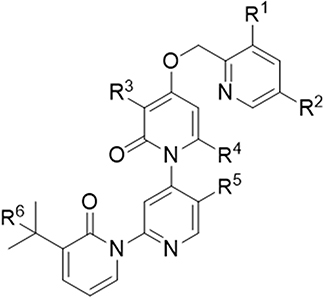 |
Scheme 1 Chemical structure of the parent compound from which S024 is derived. |
Given that the clinical failure of p38/MK2-targeted agents has been largely attributed to insufficient preclinical systematic evaluation, the present study aimed to comprehensively characterize the pharmacokinetics, ADME, and drug-drug interaction properties of S024, a novel p38/MK2 inhibitor, to support its further clinical development. Furthermore, given the well-established female predominance in RA, we incorporated sex-stratified analyses to assess potential sex-based differences in the pharmacokinetic profile of S024.
Experimental Section
Reagents and Chemicals
S024 and S024-D6 were prepared by Shenzhen Salubris Pharmaceuticals Co., Ltd. Amodiaquin dihydrochloride dihydrate, Diclofenac sodium salt, α-Naphthoflavone, Ticlopidine hydrochloride, Ketoconazole, β-nicotinamide adenine dinucleotide phosphate (NADP), 7-Hydroxycoumarin, 0.4% Trypan Blue Solution, Glutamine, Dexamethasone, Formic acid (FA), and Sulfaphenazole were purchased from Sigma Aldrich (St. Louis, MO). Recombinant human cytochrome P450 enzymes (rhCYP) were purchased from Cypex Incorporated. Cynomolgus Monkey Hepatocyte was purchased from Research Institute for Liver Diseases (Shanghai) Co., Ltd. CD-1 mouse, Sprague Dawley (SD) rat, Beagle dog and human Hepatocytes were purchased from BioIVT (Westbury, NY). (S)-Mephenytoin, (S)-(+)-N-3-Benzylnirvanol, Midazolam, Hydroxy Bupropion, Dextrorphan Tartrate Salt, 1′-Hydroxy Midazolam were purchased from Toronto Research Chemicals, Inc (Toronto, Canada). 2-[4-(2-Hydroxyethyl)-1-piperazinyl] ethanesulfonic acid (HEPES), Minimum essential medium (MEM), 0.05% Trypsin-EDTA, and Non-Essential Amino Acids (NEAA) were obtained from Thermo Fisher Scientific (Pittsburgh, PA, United States).
Method Validation
Linearity
The linearity of the method was evaluated by analyzing calibration curves over three consecutive days. For each calibration curve, linearity was assessed by plotting the peak area ratio of the analyte (Y) against its nominal concentration (X). Calibration curves were generated using a weighted (1/x2) least squares linear regression model to account for potential heteroscedasticity in the data.
Within-Run and Between-Run Accuracy and Precision
To evaluate the within- and between-run accuracy and precision of the analytical method, samples were analyzed in six replicates across three independent validation runs. Precision was assessed by calculating the percentage coefficient of variation (%CV), with acceptance criteria set at <15% for all concentrations except at the LLOQ, where a %CV of ≤20% was permitted. Accuracy was determined by comparing the mean measured value to the actual value, with acceptable deviations defined as ±15% of the actual value for all concentrations except at the LLOQ, where deviations up to ±20% were allowed.
Specificity (Selectivity and Interference)
Specificity (selectivity) was determined by comparing the percentage contribution of the analyte and internal standard (IS) peak areas in blank samples to those in the lowest limit of quantification (LLOQ) samples. During validation, the analyte peak areas in six individual blank samples were compared to those in 0.2 ng/mL LLOQ samples. To assess interference with the IS, analytes at the ULOQ concentration were added to a mixed blank matrix without IS. Conversely, IS interference with analytes was evaluated by adding IS at the working concentration to a mixed blank matrix without analytes.
Matrix Effect
Matrix effects were evaluated using six individual lots of blank SD rat plasma. Each lot was spiked with analytes at both low and high concentration levels to simulate real sample conditions. The resulting concentrations were then calculated to determine the extent of matrix effects and to assess potential variability across different plasma batches.
Extraction Recovery
The extraction recoveries of S024 and its internal standard S024-D6 were assessed at three concentration levels (0.600, 120 and 240 ng/mL), with three replicates per level. The recoveries were calculated by comparing the peak areas of samples with the analytes prior to extraction (per-extraction spiked samples) to those spiked post-extraction (post-extraction spiked samples).
Stability
The stability of S024 was evaluated under various conditions, including stock and working solution stability, stability in processed samples, and short-term, long-term, and freeze-thaw stability in SD rat plasma. The stability of the S024 stock solution (1.00 mg/mL in DMSO) and working solution (10.0 ng/mL and 15,000 ng/mL in Water/ACN, v/v, 50:50) were assessed after storage at room temperature and −80°C. The stability of S024 in processed samples was determined by analyzing QC samples stored in a 96-well plate at 10°C for 60 hours. For plasma stability, short-term stability was evaluated after storing S024 in SD rat plasma at room temperature for 8 hours, while long-term stability was assessed after 13 days of storage at −80°C. Additionally, freeze-thaw stability was investigated by subjecting S024 in SD rat plasma to five freeze-thaw cycles. All stability experiments were conducted in triplicate, and the results were considered acceptable only if the accuracy at both the lower and upper limits fell within ±15% of the nominal values.
Absorption
Permeability Assay Using Caco-2 Cells
The cells were seeded at a density of 1.00×10⁵ cells per cm2 in a 96-well Corning insert system and allowed to differentiate for 24 days. The permeability of S024 was evaluated at concentrations of 2.00, 10.0, and 100 μM in both apical-to-basolateral (A-to-B) and basolateral-to-apical (B-to-A) directions, with or without the presence of 30.0 μM verapamil and 1.00 µM Zosuquidar. Similarly, digoxin (10.0 μM) was tested bidirectionally under the same conditions, while nadolol and metoprolol (2.00 μM) were assessed in the A-to-B direction without inhibitors. The plates were incubated at 37.0°C in a 5% CO2 atmosphere for 2 hours. After incubation, samples were collected from both the donor and receiver compartments of each well. These samples were subsequently mixed with transfer buffer and stop solution for analysis using liquid chromatography-tandem mass spectrometry (LC-MS/MS).
Pharmacokinetics of S024 in Rats
Thirty SD rats (15 males and 15 females) were randomly divided into five groups, with three animals of each sex per group, to investigate the pharmacokinetics of S024. S024 was administered to Group 1 as a single intravenous (IV) dose at 1 mg/kg. Group 2, 3 and 5 received single oral doses of S024 at 0.3, 1 and 3 mg/kg, respectively. Group 4 was administered S024 orally at 1 mg/kg once daily for seven consecutive days (Day 1 to Day 7). Blood samples were collected via jugular vein puncture of each animal at predetermined time points: 0 (pre-dosing), 0.083, 0.25, 0.5, 1, 2, 4, 6, 8, 12 and 24 hours post-administration. For the oral administration groups, samples were obtained at 0 (pre-dosing), 0.25, 0.5, 1, 2, 4, 6, 8, 12 and 24 hours. Blood samples were collected in commercially available K2-EDTA tubes. Plasma was isolated by centrifugation at 3200×g for 10 minutes at 4°C. Immediately after separation, the plasma samples were flash-frozen on dry ice to minimize degradation and stored at −60°C or below until further analysis by LC-MS/MS. The plasma concentrations of S024 in animals were analyzed using non-compartmental pharmacokinetic methods. The analysis was conducted with Phoenix WinNonlin software (version 8.3, Pharsight). PK parameters were derived using the linear/log trapezoidal rule. The sample size (n=3 per sex per group) was determined based on standard practice for preclinical pharmacokinetic studies, in accordance with the NMPA Guideline on Nonclinical Pharmacokinetics Studies and the principles of the 3Rs (Replacement, Reduction, and Refinement), to minimize animal use while ensuring data reliability. The same design principle was applied to the dog PK study.
Pharmacokinetics of S024 in Beagle Dogs
Thirty beagle dogs (15 males and 15 females) were randomly divided into five groups, with three animals of each sex per group, to investigate the pharmacokinetics of S024. S024 was administered to Group 1 as a single intravenous (IV) dose at 0.3 mg/kg. Group 2, 3 and 5 received single oral doses of S024 at 0.1, 0.3 and 1 mg/kg, respectively. Group 4 was administered S024 orally at 0.3 mg/kg once daily for seven consecutive days (Day 1 to Day 7). Blood samples were collected via jugular vein puncture of each animal at predetermined time points: 0 (pre-dosing), 0.033, 0.083, 0.25, 0.5, 1, 2, 4, 6, 8, 12 and 24 hours post-administration. For the oral administration groups, samples were obtained at 0 (pre-dosing), 0.25, 0.5, 1, 2, 4, 6, 8, 12 and 24 hours. Blood samples were collected in commercially available K2-EDTA tubes. Plasma was isolated by centrifugation at 3200×g for 10 minutes at 4°C. Immediately after separation, the plasma samples were flash-frozen on dry ice to minimize degradation and stored at −60°C or below until further analysis by LC-MS/MS. The plasma concentrations of S024 in animals were analyzed using non-compartmental pharmacokinetic methods. The analysis was conducted with Phoenix WinNonlin software (version 8.3, Pharsight). PK parameters were derived using the linear/log trapezoidal rule.
Distribution
Plasma Protein Binding (PPB) Assessment of S024
S024 stock solution and warfarin stock solution were spiked into plasma to give the matrix solutions with concentrations of S024 at 0.100, 1.00 and 10.0 μM (n=1) or warfarin at 2.00 μM (n=1). To prepare the time zero (T0) samples, aliquots (50 μL) were transferred to a Sample Collection Plate (n=3). The samples were immediately diluted with blank buffer. Stop solution A (600 μL) was then added to the test samples and stop solution B (600 μL) was added to the control samples. For dialysis, 150 μL plasma containing S024 (0.100, 1.00, or 10.0 µM) or warfarin (2.00 µM) was loaded into the donor side of the dialysis device (n=3), and 150 µL of dialysis buffer was added to the receiving side. The plates were incubated at 37.0°C in a humidity-controlled chamber with 5.0% CO2 and gently agitated at 100 rpm for 6 h. Post-dialysis, 50 µL samples were collected from both the buffer and plasma sides of the device and transferred to a 96-well plate. An equal volume of the opposite blank matrix (buffer or plasma) was added to each well to achieve a final volume of 100 µL with a 1:1(v:v) plasma-to-buffer ratio. All samples were subsequently processed by protein precipitation for LC-MS/MS analysis.
Tissue Distribution Studies
Twenty-four SD rats (12 males and 12 females) were randomly allocated into four groups (3 animals per sex per group). Each group received a single oral dose of S024 at 1 mg/kg. Groups 1 to 4 were euthanized via CO2 inhalation at 0.25, 1, 8 and 24 hours post-dose, respectively. Following euthanasia, systemic perfusion was performed through the heart using saline. Blood and 18 tissue types were collected, including the heart, liver, spleen, lung, kidney, stomach, small intestine, large intestine, muscle, fat, brain, pancreas, thymus, bone marrow, eyeball, and submaxillary lymph nodes (common to both sexes); ovaries and uterus (female-specific); and epididymis and testicles (male-specific). Blood samples were collected in tubes containing 0.5 mol/L K2-EDTA and centrifuged at 4°C and 3200 g for 10 minutes to obtain plasma. Tissue samples were homogenized in a homogenizing buffer (MeOH/15 mM PBS buffer, 1:2 v/v) at a ratio of 1:9. The concentrations of S024 in plasma and tissues were quantified using a validated LC-MS/MS bioanalytical method.
Metabolism
Hepatocyte Stability Assay
The stability of S024 was evaluated in hepatocytes from CD-1 mouse, SD rat, beagle dog, cynomolgus monkey, and human. For the assay, 2.00 µL of test compounds or positive controls were added to 198 µL of cell suspension in each well. The plates were incubated at 37.0°C in a humidified atmosphere of 5.0% CO2 and shaken at 650 rpm to initiate the reaction. At designated time points, 25.0 µL of the reaction mixture was transferred to wells containing 125 µL of ice-cold Stop Solution 1 (methanol:acetonitrile, 5:95 v/v, with 200 nM S024-D6 as an internal standard) for S024 samples, or Stop Solution 2 (methanol:acetonitrile, 5:95 v/v, with 200 ng/mL tolbutamide as an internal standard) for control compounds. The mixtures were vortexed, centrifuged at 3220 × g for 20 min, and the supernatants were diluted with ultrapure water prior to LC-MS/MS analysis.
Metabolite Profiling and Identification in Hepatocytes
The cryopreserved mouse, rat, dog, monkey and human hepatocyte vials were rapidly thawed by immersing them in a 37°C water bath, followed by centrifugation at 100 × g for 5 min at room temperature.26 Cell viability was assessed using the trypan blue exclusion assay. The cell suspension was diluted with pre-warmed medium to a final concentration of 1.01×10⁶ cells/mL prior to analysis. An aliquot of 2 μL of 1 mM S024 was combined with 198 μL of cell suspension in incubation medium and thoroughly mixed. The mixture was then incubated at 37 °C for 120 minutes with 5% CO2. At the end of the incubation, the reaction was terminated by adding 400 μL of stop solution. The mixture was agitated at 300 rpm for 10 min, followed by centrifugation at 12,700 × rpm for 15 min. The resulting supernatant was evaporated under a stream of N2 and reconstituted in 250 μL of 30% ACN/H2O (v/v). After centrifugation at 4000 × g for 10 min, the supernatant was carefully transferred to a 96-well plate for further analysis.
Metabolite Profiling and Identification in vivo
Plasma samples were collected from rats administered 3 mg/kg S024 orally, while urine, feces, and bile samples were obtained from rats dosed with 1 mg/kg S024. Proteins were precipitated by adding four volumes of acetonitrile, followed by centrifugation at 13,000 × g for 15 min. The supernatant was then transferred, evaporated under nitrogen, and reconstituted in 200 μL of 30% acetonitrile/water (v/v). After a second centrifugation (13,000 × g, 15 min), the supernatant was subjected to LC-UV-MS analysis.
Phenotypic Characterization of Human Cytochrome P450 Responses
In order to optimize conditions for the chemical inhibition study, a preliminary experiment was conducted by incubating S024 at 10.0 μM with multiple microsomal concentrations at 0.100, 0.200, and 0.400 mg/mL for multiple reaction time points as 0, 5, 10, 20, 30, 40, and 60 min. Human liver microsomes at 0.100 mg/mL and a reaction time at 20 minutes ensured linear formation rates of metabolites M6 and M3 with respect to both incubation time and microsomal protein concentration. Chemical inhibition assays were conducted in human liver microsomes to determine the apparent Km values of S024, focusing on the formation of its metabolites M6 and M3. S024 (10.0 μM) was incubated with human liver microsomes in the presence of selective chemical inhibitors targeting individual CYP isozymes. CYP isozymes exhibiting significantly reduced S024 metabolism in the presence of their respective inhibitors were identified as the primary enzymes responsible for S024 metabolism.
Excretion
Twelve SD rats (6 males, 6 females) were divided into two groups (3 animals/sex/group). Each group received a single oral dose of S024 at 1 mg/kg. Group 1 animals were housed in metabolic cages for the collection of urine and feces at pre-dose and post-dose intervals (0–8, 8–24, 24–48, 48–72, 72–96, 96–120, 120–144, and 144–168 hours). Feces were homogenized with 14 volumes (w/v) of buffer (MeOH: 15 mmol/L PBS = 1:2). In Group 2, bile was collected via bile duct cannulation at pre-dose and post-dose intervals (0–4, 4–8, 8–12, 12–24, 24–48, and 48–72 hours). During bile collection, sodium taurocholate (2.3 mg/mL in saline) was infused into the duodenum at 0.9 mL/hour using an infusion pump to maintain bile flow. Approximately 0.8 mL of homogenized feces, urine, and bile samples from each time point were transferred to pre-cooled, labeled tubes and stored at −60°C or below until LC-MS/MS analysis.
Drug-Drug Interaction (DDI)
CYP450 Inhibition Assays
The inhibitory potential of S024 against CYP450 (CYP1A2, CYP2B6, CYP2C8, CYP2C9, CYP2C19, CYP2D6, and CYP3A) was assessed using human liver microsomes.27 Incubation mixtures were prepared in 100 mM potassium phosphate buffer (pH7.4) and contained microsomes (0.100 mg protein/mL), S024 or positive control inhibitors (at each concentration), and a CYP isozyme-selective substrate. All incubations were conducted at 37°C in a water bath. After a 10-minute warm up, NADPH-regenerating system was added to initiate the reaction. The CYP3A-midazolam incubation was continued for 3 minutes. CYP2C19 and CYP2D6 incubations were continued for 20 minutes. All other incubations were continued for 10 minutes. The reactions were terminated by adding 200 µL of stop solution (99.7% acetonitrile and 0.3% formic acid) containing the internal standard. Following centrifugation at 3220 × g for 20 min, the supernatant was collected and stored for further analysis.
CYP450 Induction Assays
Following the establishment of cultures using cryopreserved human hepatocytes (BXW, VKB, and NFX; purchased from BioIVT, Baltimore, MD, USA), the cells were treated for 24 hours with incubation solutions containing S024, vehicle (0.1% DMSO), or positive controls. The medium was then replaced with fresh solutions of the same composition for an additional 24 hours (total treatment period: 48 hours). For time-point sampling, 10 µL of dosing medium was collected at T0 (immediately after dosing), T5 (5 hours), and T24 (24 hours), mixed with 200 µL of stop solution (containing internal standard) in a 96-well plate. Following the 48-hour treatment, hepatocytes were washed twice with HBSS and incubated with enzyme substrate working solution for 30 minutes. Subsequently, 75 µL of the reaction mixture was quenched with 150 µL of stop solution, vortexed for 10 min, and centrifuged (4°C, 3220 × g, 20 min). The supernatant was diluted (1:4) with 0.1% aqueous formic acid (FA) and analyzed by LC-MS/MS. For RNA extraction, the remaining medium was aspirated, and cells were washed once with pre-warmed HBSS before lysis in RLT buffer (supplemented with 1% β-mercaptoethanol). RNA isolation was performed using QIAcube HT System. RNA concentration was measured with NanoDrop ND-2000 spectrophotometer.
Inhibitory Potential of S024 on ABC Transporter Activity in Caco-2 Cells
Caco-2 cells at passage 49 were seeded on the 96-well insert system at the density of 1.00×10⁵ cells/cm2 and cultured for 25 days. Pre-incubation solution (75.0 µL and 250 µL) was added to the apical and basolateral chambers, respectively. After 30 min of equilibration at 37.0°C, 5.0% CO2 and saturated humidity (without shaking), the buffers were removed. The transport assay was initiated by applying dosing and receiver solutions (75.0 µL apical, 250 µL basolateral) to the respective chambers for bidirectional assessment (A→B and B→A). The plates were then incubated under the same conditions for 120 min. The vehicle control was aliquoted as the T0 sample. Following a 120-minute incubation, receiver-side samples were collected, combined with Transport Buffer and Stop Solution, then vortexed and centrifuged (3220 ×g, 20.0°C, 20 min). The pre-incubation solutions, dosing and receiver solutions were S024, verapamil, and novobiocin (BCRP inhibitor). The transport buffer (TB) contained S024 at eight concentrations (0.0457, 0.137, 0.412, 1.23, 3.70, 11.1, 33.3 and 100 µM), verapamil at seven concentrations (0.137, 0.412, 1.23, 3.70, 11.1, 33.3 and 100 µM), and novobiocin at seven concentrations (0.137, 0.412, 1.23, 3.70, 11.1, 33.3 and 100 µM).28
Inhibitory Potential of S024 on SLC Transporters
HEK-293 cells were maintained in DMEM (and HEK293-OATP1B3 cells, cultured in DMEM/F12) supplemented with 10% fetal bovine serum, 500 μg/mL G418 sulfate, 100 U/mL penicillin-G, and 100 μg/mL streptomycin.28 Cells were detached using 0.05% trypsin/EDTA (w/v) and seeded into 96-well plates at a density of 1.5×10⁵ cells/cm2, followed by incubation at 37°C under 5% CO2 with saturated humidity for 24 h. After removing the culture medium, cells were washed twice with 100 µL of pre-warmed (37°C) transport buffer. Subsequently, 100 µL of transport buffer containing either S024 or positive inhibitors was added for pre-incubation. Following buffer removal, cells were treated with 100 µL of dosing solution (substrate ± S024/inhibitors) and incubated under the same conditions. Post-incubation, the dosing solution was aspirated, and cells were washed three times with 100 µL of ice-cold (4°C) transport buffer. Intracellular uptake was halted by adding 100 µL of cold acetonitrile/methanol (95:5, v/v), followed by gentle shaking for 30 min. A 75 µL aliquot was mixed with 75 µL transport buffer and 150 µL acetonitrile/methanol (95:5, v/v), then centrifuged (3220 × g, 10 min). The supernatant was analyzed via LC-MS/MS for substrate quantification.
Statistical Analysis
Data are presented as mean ± SEM unless otherwise specified. All the PK parameters were calculated using noncompartmental analysis (Phoenix WinNonlin version 8.3; Pharsight Corp., Mountain View, CA).
Results
Method Validation
Specificity
The peak areas of the analyte (S024) and internal standard (IS) in six individual blank matrices were compared with those of the LLOQ samples. As shown in Table S1, the peak areas of S024 and IS in all blank matrices were less than 20.0% and 5.0% of those observed in the LLOQ samples, respectively.
To assess potential chromatographic interference, the analyte (at ULOQ concentration) was spiked into a pooled blank matrix in the absence of the IS. No significant baseline interference was observed at the retention time of IS (Table S2). Similarly, IS (at working concentration) was added to pooled blank matrix without S024, and no significant interference was detected at the retention time of S024.
Linearity
The regression equations, linear ranges, and correlation coefficient (r2) of S024 were listed in Table S3. The calibration curves demonstrated excellent linearity, with all correlation coefficients (r2) exceeding 0.99. The LLOQ was the lowest concentration point of the calibration curve.
Accuracy and Precision
The within- and between-run precision and accuracy of S024 were evaluated by analyzing QC samples at four different concentrations in six replicates within a single run and over three separate days, respectively. As shown in Table S4, S024 demonstrated acceptable precision and accuracy, with deviations within ±15.0% for both within- and between-run analyses (LLOQ ±20.0%). All precision values were ≤15.0% (LLOQ ≤20.0%). These results demonstrated that the method was reliable and reproducible.
Matrix Effect and Recovery
The total %CV of the IS-normalized matrix factor calculated from 6 different lots of SD rat plasma was 7.6%, indicating the absence of a significant matrix effect across individual matrix sources. These results are presented in Table S5. Using the established sample processing method, the recoveries of S024 in Rat and Beagle Dog Plasma were 80.1%-82.0% and 44.7%-47.5%, respectively. The %CV for spiked QC samples at three level were 3.4% and 3.3%, demonstrating acceptable recovery. The detailed results are presented in Table S6.
Stability
The results of stability are summarized in Table S7. S024 demonstrated stability under various conditions, including short-term storage at room temperature (25 °C for 8 h), long-term storage at −80 °C for 13 days, and through five freeze (at −80°C)/thaw (at room temperature) cycles, as well as in processed samples. The maximum deviation of QC samples was −7.5%, indicating that S024 remained stable under all tested conditions.
Absorption
Caco-2 Transport
As shown in Table 1, nadolol and metoprolol served as the low- and high-permeability control, respectively. Digoxin, a known P-gp substrate, exhibited reduced efflux ratios (ERi) of 10.6 and 7.31 following treatment with verapamil or zosuquidar, indicating potent P-gp inhibition. At a dosing concentration of 2.00 µM, S024 concentrations in all A to B receiver samples were below the LLOQ. In the absence of inhibitors, S024 exhibited mean Papp (A to B) values of <0.240 × 10⁻⁶ cm/s, 0.206 × 10⁻⁶ cm/s, and 0.352 × 10⁻⁶ cm/s at concentrations of 2.00, 10.0, and 100 µM. Conversely, mean Papp (B to A) values exceeded 27.1 × 10⁻⁶ cm/s, and the ERa surpassed 81.8, suggesting pronounced efflux activity.
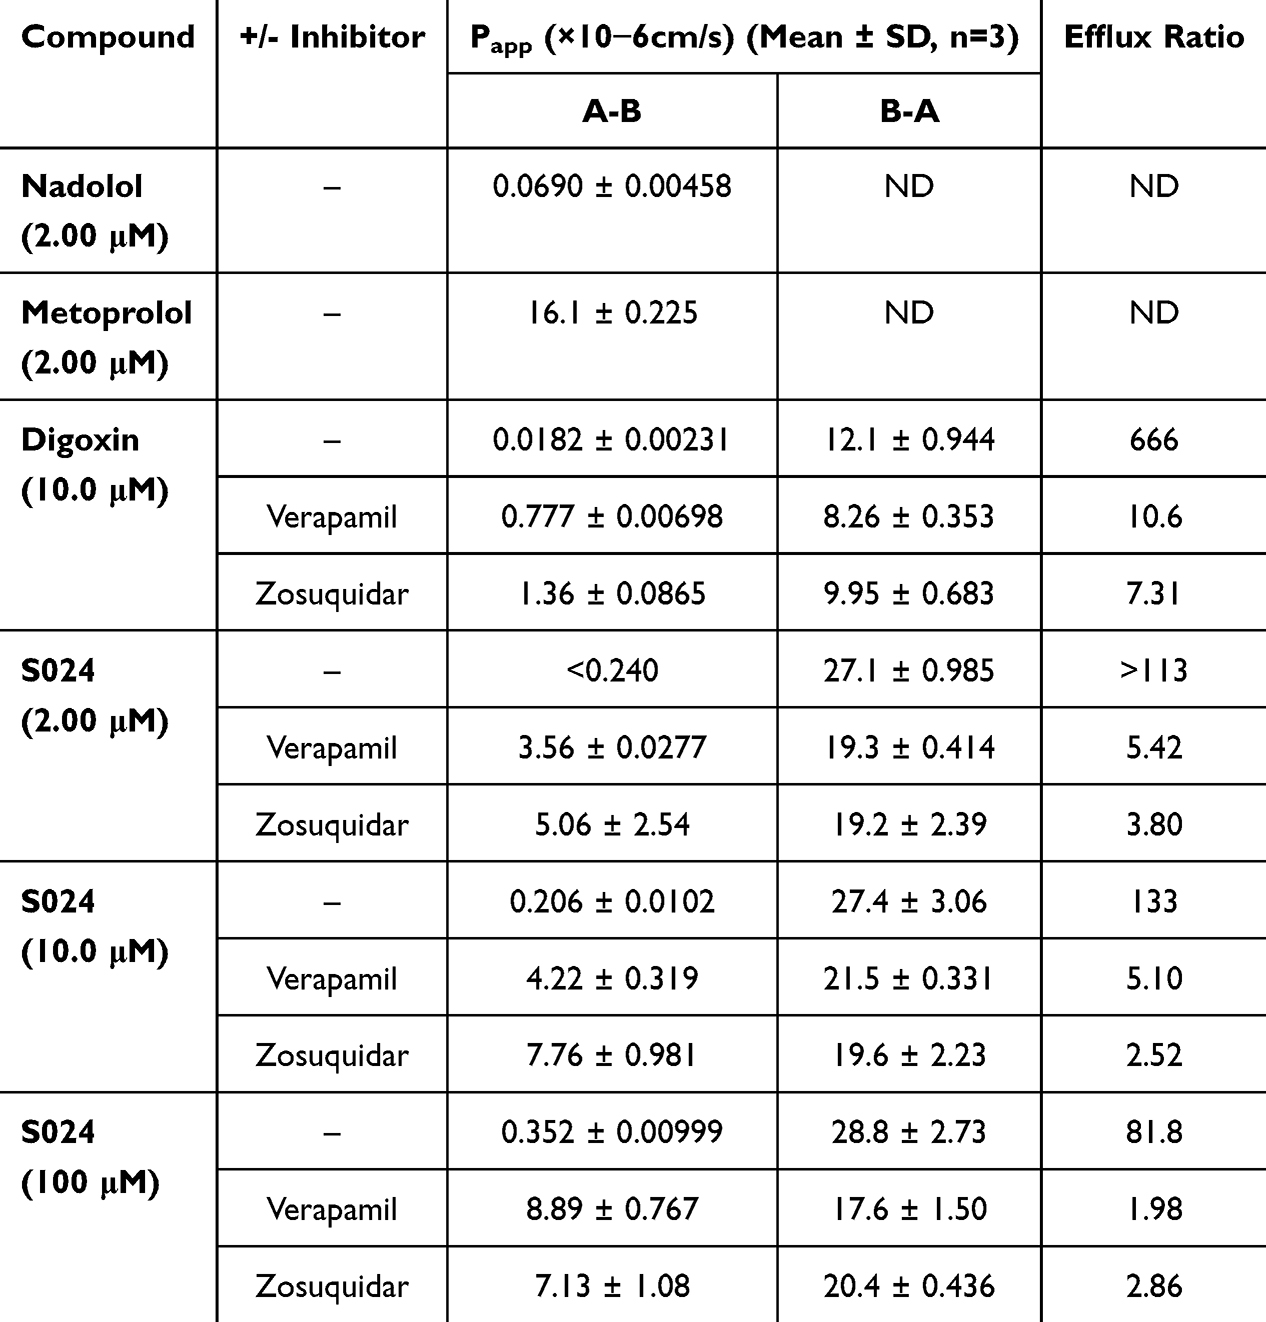 |
Table 1 Permeability Results for Control Compounds and S024 |
In the presence of verapamil, the mean Papp (A to B) values of S024 increased, while Papp (B to A) values remained relatively stable This resulted in a decrease in the ERi to 5.42, 5.10, and 1.98, corresponding to ERa/ERi values of >20.9, 26.1, and 41.3, respectively. Similarly, zosuquidar treatment yielded ERi values of 3.80, 2.52, and 2.86, corresponding to ERa/ERi ratios of >29.7, 52.7, and 28.6, respectively. Therefore, S024 demonstrated low permeability across the Caco-2 cell monolayer. These findings suggest that S024 is a substrate of P-gp.
Pharmacokinetic Parameters Following Intravenous, Single Oral, and Repeated Administration of S024 in SD Rats
Plasma concentrations of S024 in each group were quantified by validated LC-MS/MS method following administration, with a lower limit of quantification of 0.2 ng/mL. The data obtained from each group were averaged. Figure 1 illustrated the plasma concentration-time curves following intravenous (1 mg/kg), single oral (0.3, 1, 3 mg/kg), and continuous oral administration (1 mg/kg for 7 days) in both male and female rats. Key pharmacokinetic parameters were summarized in Table S8.
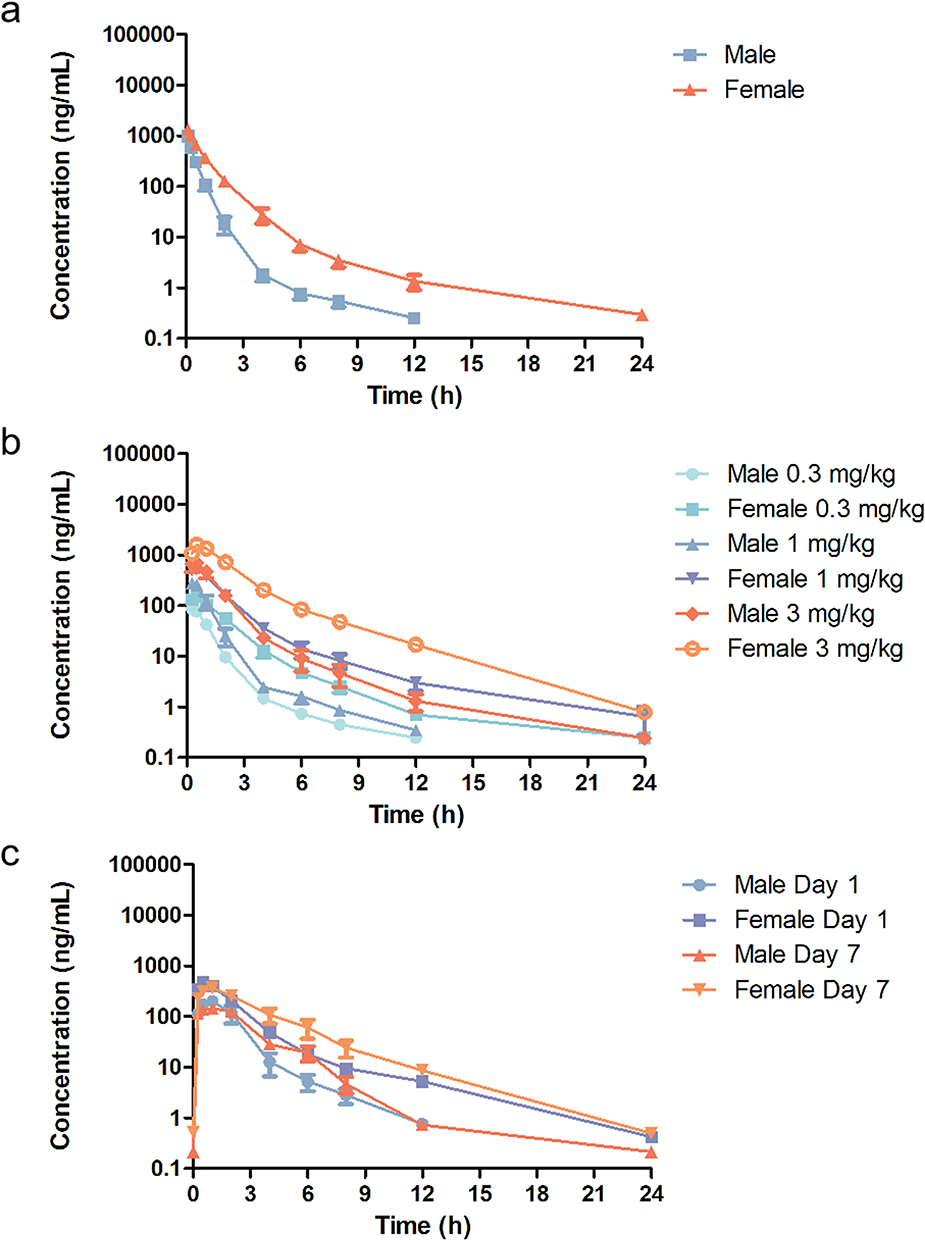 |
Figure 1 Mean plasma concentration-time curves of S024 in male and female SD rats following (a) single intravenous administration of S024 at 1 mg/kg, (b) oral administration of S024 at 0.3, 1 and 3 mg/kg and (c) once daily oral administration of S024 at 1 mg/kg for 7 days (n=3 per treatment group). |
Following a single intravenous administration, the clearance (CL) was 14.3 mL/min/kg in female rats and 35 mL/min/kg in male rats, while the apparent volume of distribution at steady state (Vdss) was 1.03 L/kg and 1.12 L/kg, respectively. These values indicate moderate clearance and moderate Vdss in rats. The elimination half-life (T1/2) was 4.77 hours in female rats and 2.82 hours in male rats and the exposure (AUC0-last) ratio between female and male rats was 2.38, indicating a slight gender difference.
Following a single oral administration, the plasma concentration profiles exhibited a quick absorption phase, with mean Tmax of 0.333–1.33 h. The calculated elimination half-life (T1/2) was approximately 1.67–4.77 h, indicating rapid absorption in SD rats. Both Cmax and AUC values demonstrated a dose-dependent increase as the dose escalated from 0.3 mg/kg to 3 mg/kg in a single oral administration. At dose levels of 0.3, 1, and 3 mg/kg, the F% of S024 was 80.4%, 80.1%, and 101% in female rats, and 64.7%, 56.3%, and 67.9% in male rats, respectively. These favorable and dose-dependent bioavailability values suggest efficient absorption of S024 in rats.
Following 7-day consecutive oral administration of S024 (1 mg/kg) in rats, Cmax and AUC0-last were higher in females than in males on both day 1 and day 7. Notably, within each sex, exposure on Day 7 remained comparable to that on Day 1, suggesting no significant accumulation upon repeated dosing.
Pharmacokinetic Parameters Following Intravenous, Single Oral, and Repeated Administration of S024 in Beagle Dogs
Plasma concentrations of S024 in each group were quantified by validated LC-MS/MS method following administration, with a lower limit of quantification of 0.2 ng/mL. Figure 2 showed the plasma concentration-time curves following intravenous (0.3 mg/kg), single oral (0.1, 0.3, 1 mg/kg), and continuous (0.3 mg/kg for 7 days) administration in both sexes. Key pharmacokinetic parameters were summarized in Table S9.
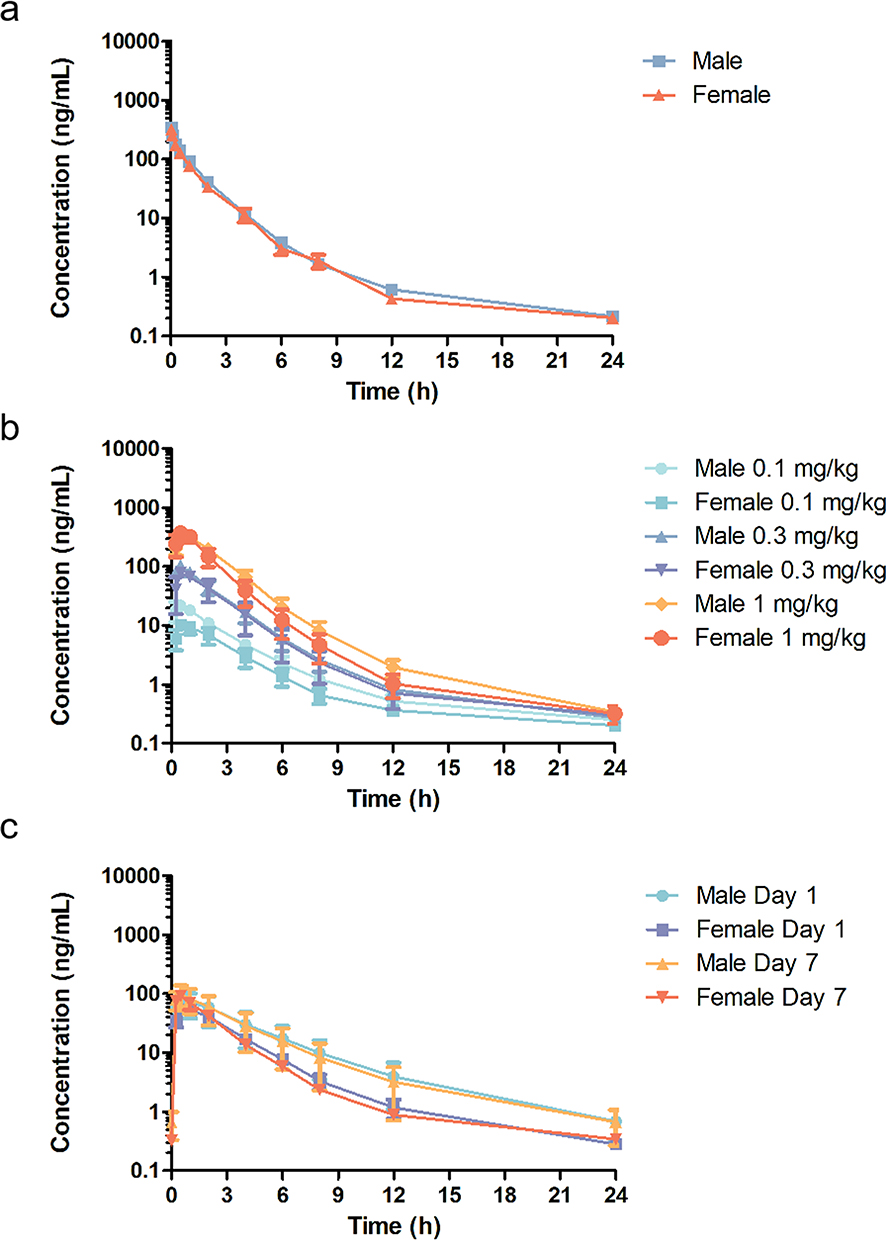 |
Figure 2 Mean plasma concentration-time curves of S024 in male and female beagle dogs following (a) single intravenous administration of S024 at 0.3 mg/kg, (b) oral administration of S024 at 0.1, 0.3 and 1 mg/kg and (c) once daily oral administration of S024 at 0.3 mg/kg for 7 days (n=3 per treatment group). |
Following a single intravenous dose of 0.3 mg/kg S024 in Beagle dogs, the compound exhibited moderate clearance and volume of distribution. The T1/2 did not differ significantly between males and females. After a single oral administration (0.1, 0.3, and 1 mg/kg), AUC0-last was consistently higher in males than females across all doses, but the difference remained less than 2-fold. The systemic exposure (AUC0-last) of S024 increased with dose proportionally as dose levels increased from 0.1 to 0.3 mg/kg and 0.3 to 1 mg/kg in male and female beagle dogs; In general, systemic exposure (AUC0-last and Cmax) of S024 increased with dose proportionally as dose levels increased from 0.1 to 1 mg/kg in male beagle dogs, while systemic exposure (AUC0-last and Cmax) of S024 increased more than dose proportionally in female beagle dogs. Oral bioavailability was dose-dependent, reaching 52.3%, 77.5%, and 85.9% at 0.1, 0.3, and 1 mg/kg, respectively.
Repeated oral dosing (0.3 mg/kg for 7 days) revealed no signs of accumulation, as indicated by comparable Cmax and AUC0-last values on days 1 and 7. Although AUC0-last remained slightly higher in males (<2-fold difference), the sex-based differences were not significant. Furthermore, food intake did not markedly affect drug absorption; pharmacokinetic parameters after a single fasted dose were consistent with those under fed conditions in the multiple-dose study.
Distribution
Plasma Protein Binding
The PPB of S024 was evaluated across five species using equilibrium dialysis, as PPB can exhibit species-dependent variability due to differences in binding protein composition.29 As summarized in Table 2, the mean %Bound of S024 was determined across multiple species at concentrations of 0.100, 1.00, and 10.0 µM. In CD-1 mouse plasma, the %Bound values were 75.7 ± 2.4, 76.2 ± 1.8, and 73.6 ± 3.1, respectively. Similarly, in Sprague-Dawley rat plasma, the values were 67.4 ± 1.8, 70.7 ± 5.7, and 67.3 ± 2.4. In beagle dog plasma, the %Bound was 70.9 ± 3.6, 70.1 ± 6.5, and 66.1 ± 5.6, while in cynomolgus monkey plasma, it was 52.4 ± 9.9, 43.8 ± 10.7, and 45.2 ± 2.3. In human plasma, the values were 52.8 ± 5.7, 57.7 ± 2.4, and 50.4 ± 3.8. Additionally, the recovery rates from the dialysis equipment were within an acceptable range, varying from 84.2 ± 2.5 to 110.4 ± 3.9. S024 exhibited moderate binding in CD-1 mouse, Sprague-Dawley rat, beagle dog, and human plasma, and low to moderate binding in cynomolgus monkey plasma at all three test concentrations.
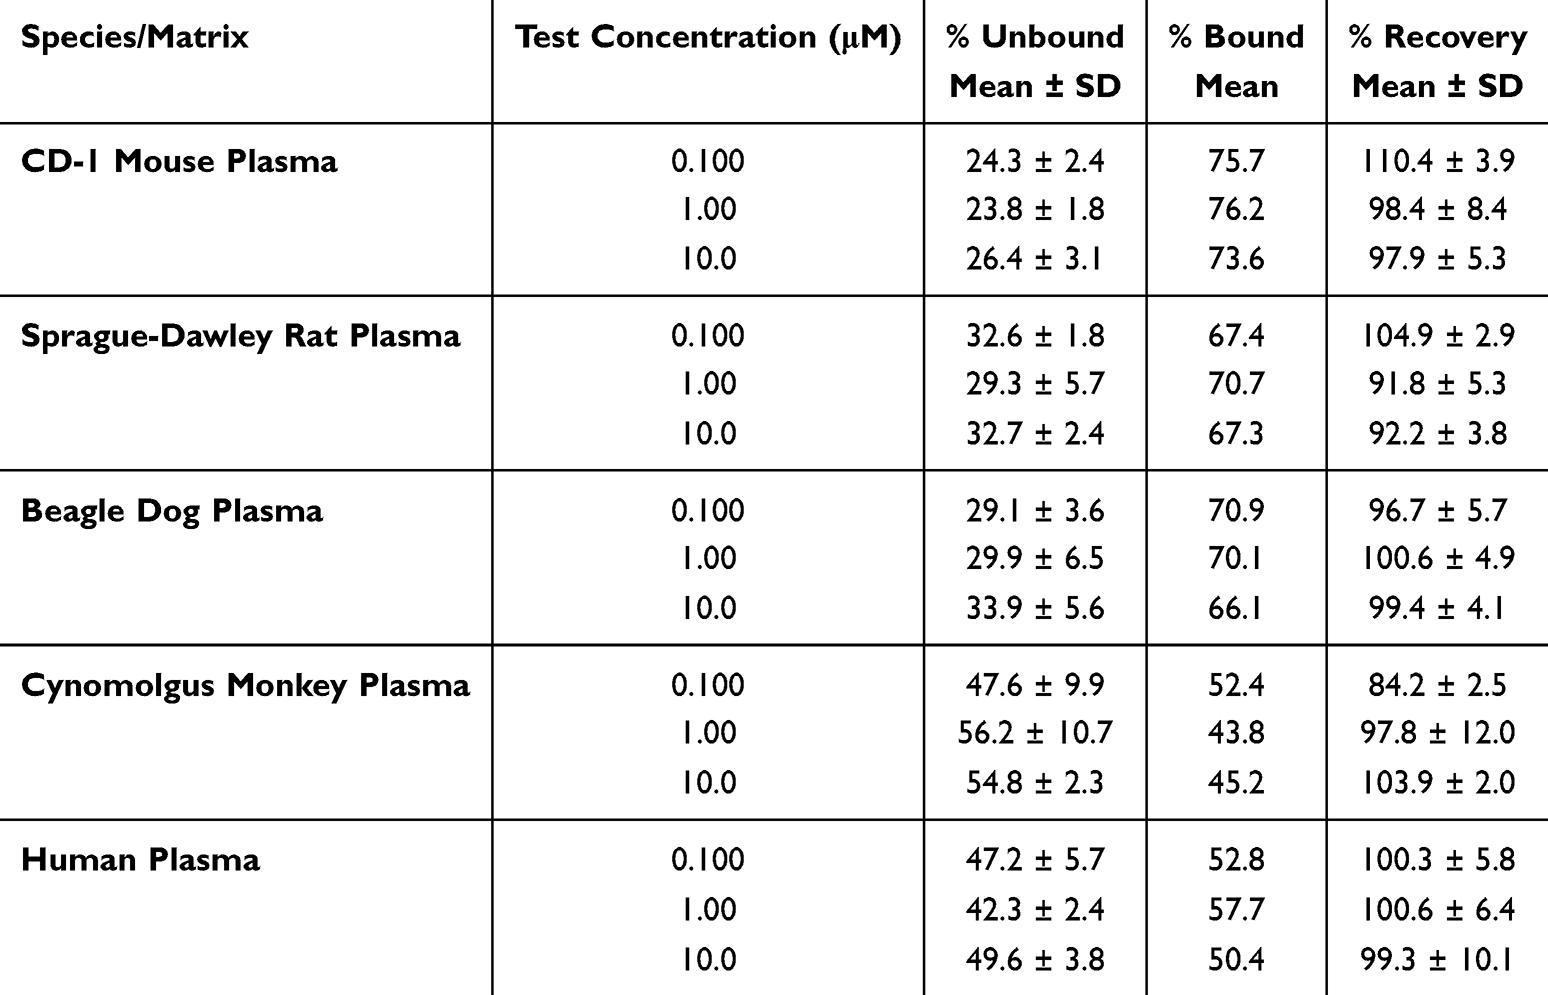 |
Table 2 S024 Protein Binding Data in 5 Species Using Equilibrium Dialysis |
Tissue Distribution of S024 in Male and Female Rats
The tissue distribution of S024 in male and female rats was investigated at 0.25, 1, 8, and 24 h after oral administration of 1 mg/kg. The mean plasma concentrations (ng/mL), tissue concentrations (ng/g) and pharmacokinetic parameters of S024 in male and female SD rats are shown in Tables S10 and S11. The histogram of mean concentrations of male and female rats in plasma and tissues is illustrated in Figures 3 and 4. For male rats, the highest tissue exposure (AUC0-last) was observed in stomach (4900 ng·h/g) and small intestine (4070 ng·h/g), followed by large intestine, marrow, spleen and kidney. Most of the samples of brain were below the quantifiable limit and AUC0-last could not be calculated. For female rats, the highest tissue exposure was observed in large intestine (6660 ng·h/g) and stomach (6000 ng·h/g), followed by small intestine, kidney, spleen, liver and marrow. Additionally, the ratio of whole blood to plasma concentration was 0.9, revealing that S024 distributed more in plasma than in erythrocytes. The tissue exposure of S024 in female rats was higher than that of males, and the exposure (AUC0-last) in the liver, fat and pancreas showed sex differences. The peak concentrations (Cmax) were observed at 0.25 hours post-dose in most tissues in male rats. The peak concentrations (Cmax) were observed at 1 hour post-dose in most tissues in female rats. Due to the high inter-individual variability inherent in gastrointestinal absorption processes, tissue concentration data from the stomach and intestines should be interpreted with caution.
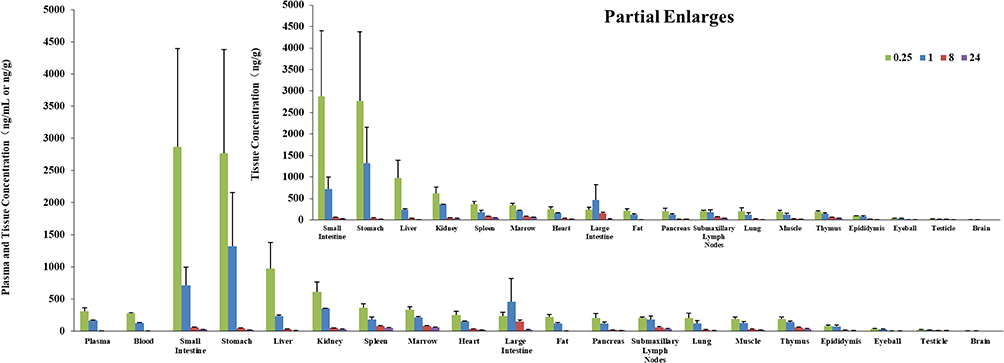 |
Figure 3 Mean plasma (ng/mL) and tissue (ng/g) concentrations of S024 in male SD rats following single oral administration of S024 at 1 mg/kg. |
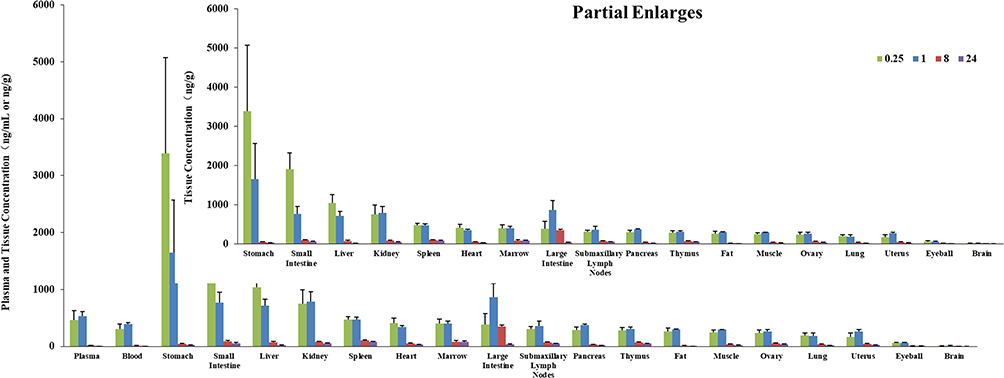 |
Figure 4 Mean plasma (ng/mL) and tissue (ng/g) concentrations of S024 in female SD rats following single oral administration of S024 at 1 mg/kg. |
Metabolism
Metabolic Stability of S024 in Hepatocytes
The metabolic stability of S024 (1 µM) following incubation with hepatocytes from mice, rats, dogs, monkeys, and humans at 37 °C is presented in Figure 5. The remaining percentage of S024 decreased in a time-dependent manner across all species. The elimination T1/2, calculated from the slope of the decline curves, was comparable among species, although mice exhibited a marginally faster elimination rate (Table S12). Table S12 summarizes the in vitro hepatic clearance (CLint(hep)) and liver clearance (CLint(liver)), calculated using physiological parameters including liver weight and hepatic blood flow. CLint(liver) values of each species were 320.9, 43.8, <25.6, 25.7, and <10.3 mL/min/kg. The data revealed that S024 was extensively metabolized in CD-1 mouse hepatocytes, moderately metabolized in SD rat and cynomolgus monkey hepatocytes, and slowly metabolized in beagle dog and human hepatocytes.
 |
Figure 5 Percentages of S024 remaining as a function of time after incubation in mouse, rat, dog, monkey, and human hepatocytes. |
Metabolite Profiling and Identification of S024 in Hepatocytes
The relative abundance of S024 and each of the putative metabolites were calculated using peak area (UV peak area under the wavelength at 250–340 nm) of individual metabolite relative to the total area for all detected drug related components. As shown in Table 3, a total of 10 metabolites M1-M10 were detected in cell samples, of which 7 were associated with Phase I metabolism, while 5 were linked to phase II metabolism. The accurate mass measurements of S024 and its metabolites in mouse, rat, dog, monkey and human hepatocytes were summarized in Table 4, where the maximum mass errors between measured and calculated values were within 10 ppm, indicating a high level of confidence. Based on the accurate molecular weight and fragment ions, the metabolites were identified as below: M1: O-Dealkylation and glucuronidation metabolite; M2: O-Dealkylation and mono-oxygenation metabolite; M3: O-Dealkylation metabolite; M4: Mono-oxygenation and glucuronidation metabolite; M5: Glutathione conjugation metabolite; M6 and M10: Mono-oxygenation metabolites; M7-M9: Mono-oxygenation and hydrolysis metabolites. The major metabolic pathways of S024 in hepatocytes were proposed as O-dealkylation and mono-oxygenation. The minor metabolic pathways of S024 were hydrolysis, glucuronidation and glutathione conjugation. Metabolites detected in human hepatocytes were also observed in all tested animal species.
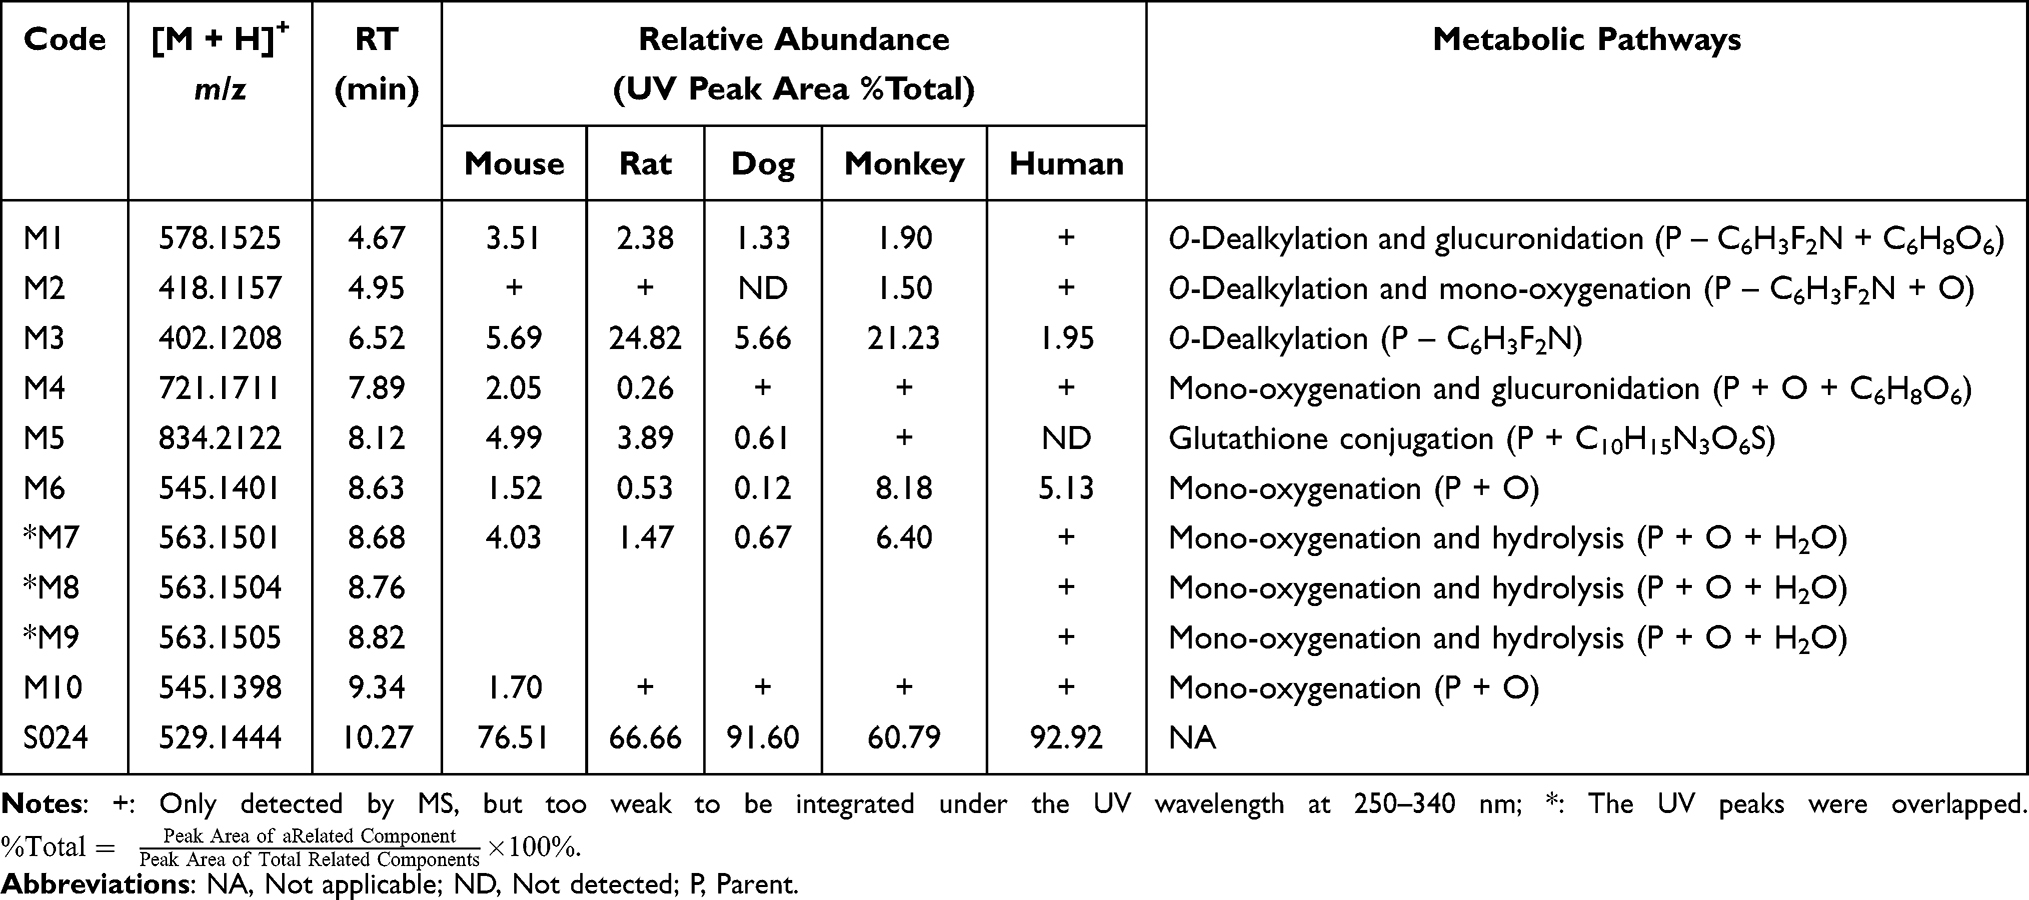 |
Table 3 S024 and Its Metabolites in Mouse, Rat, Dog, Monkey and Human Hepatocytes |
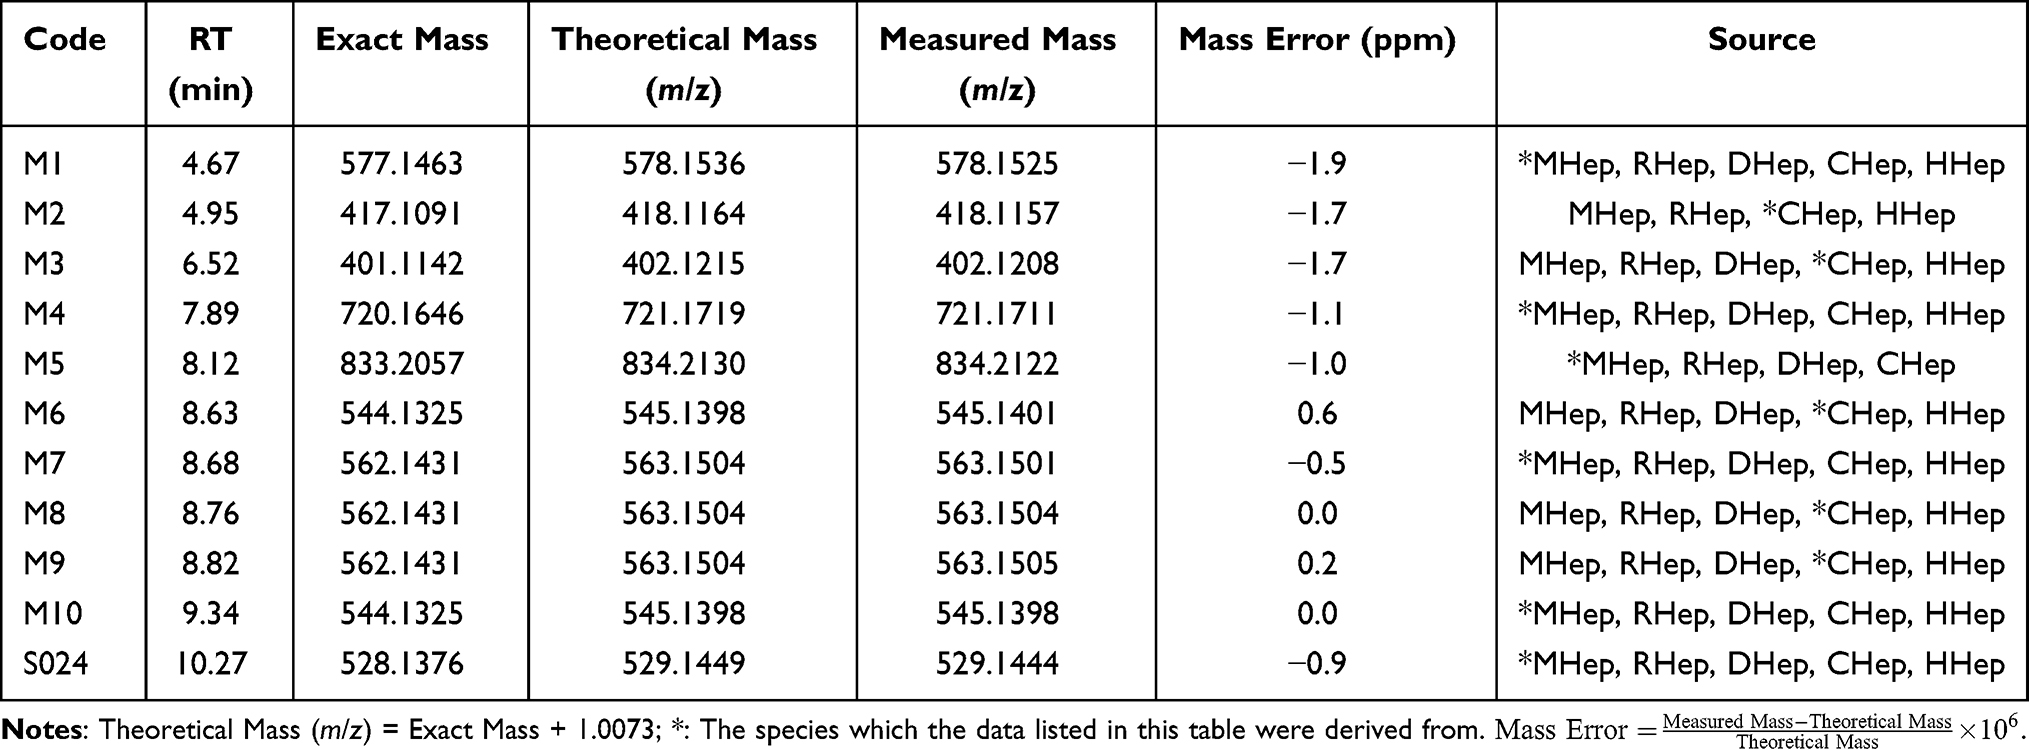 |
Table 4 Accurate Mass Measurements of S024 and Its Metabolites in Mouse, Rat, Dog, Monkey and Human Hepatocytes |
Metabolite Profiling and Identification of S024 in vivo
A total of 13 metabolites of S024 were identified in rat plasma, urine, feces, and bile, with no significant sex-related differences observed. As shown in Tables 5 and 6, seven metabolites were detected in plasma. Among these, M3 exhibited the highest relative abundance in males (2.72%), whereas M6 was the most abundant in females (1.14%). In urine, eight metabolites were identified, with M3, M6, and M10a showing the highest relative abundances. Fecal analysis revealed nine metabolites, among which M3 and M6 were the most prominent. Bile contained 12 metabolites, with M3 and M6 again displaying the highest relative abundance; all other metabolites accounted for less than 5%. Based on the structural identification of these metabolites, the primary metabolic pathways of S024 in rats were determined to be O-dealkylation and mono-oxygenation. Secondary pathways included mono-oxygenation, glucuronidation, and glutathione conjugation.
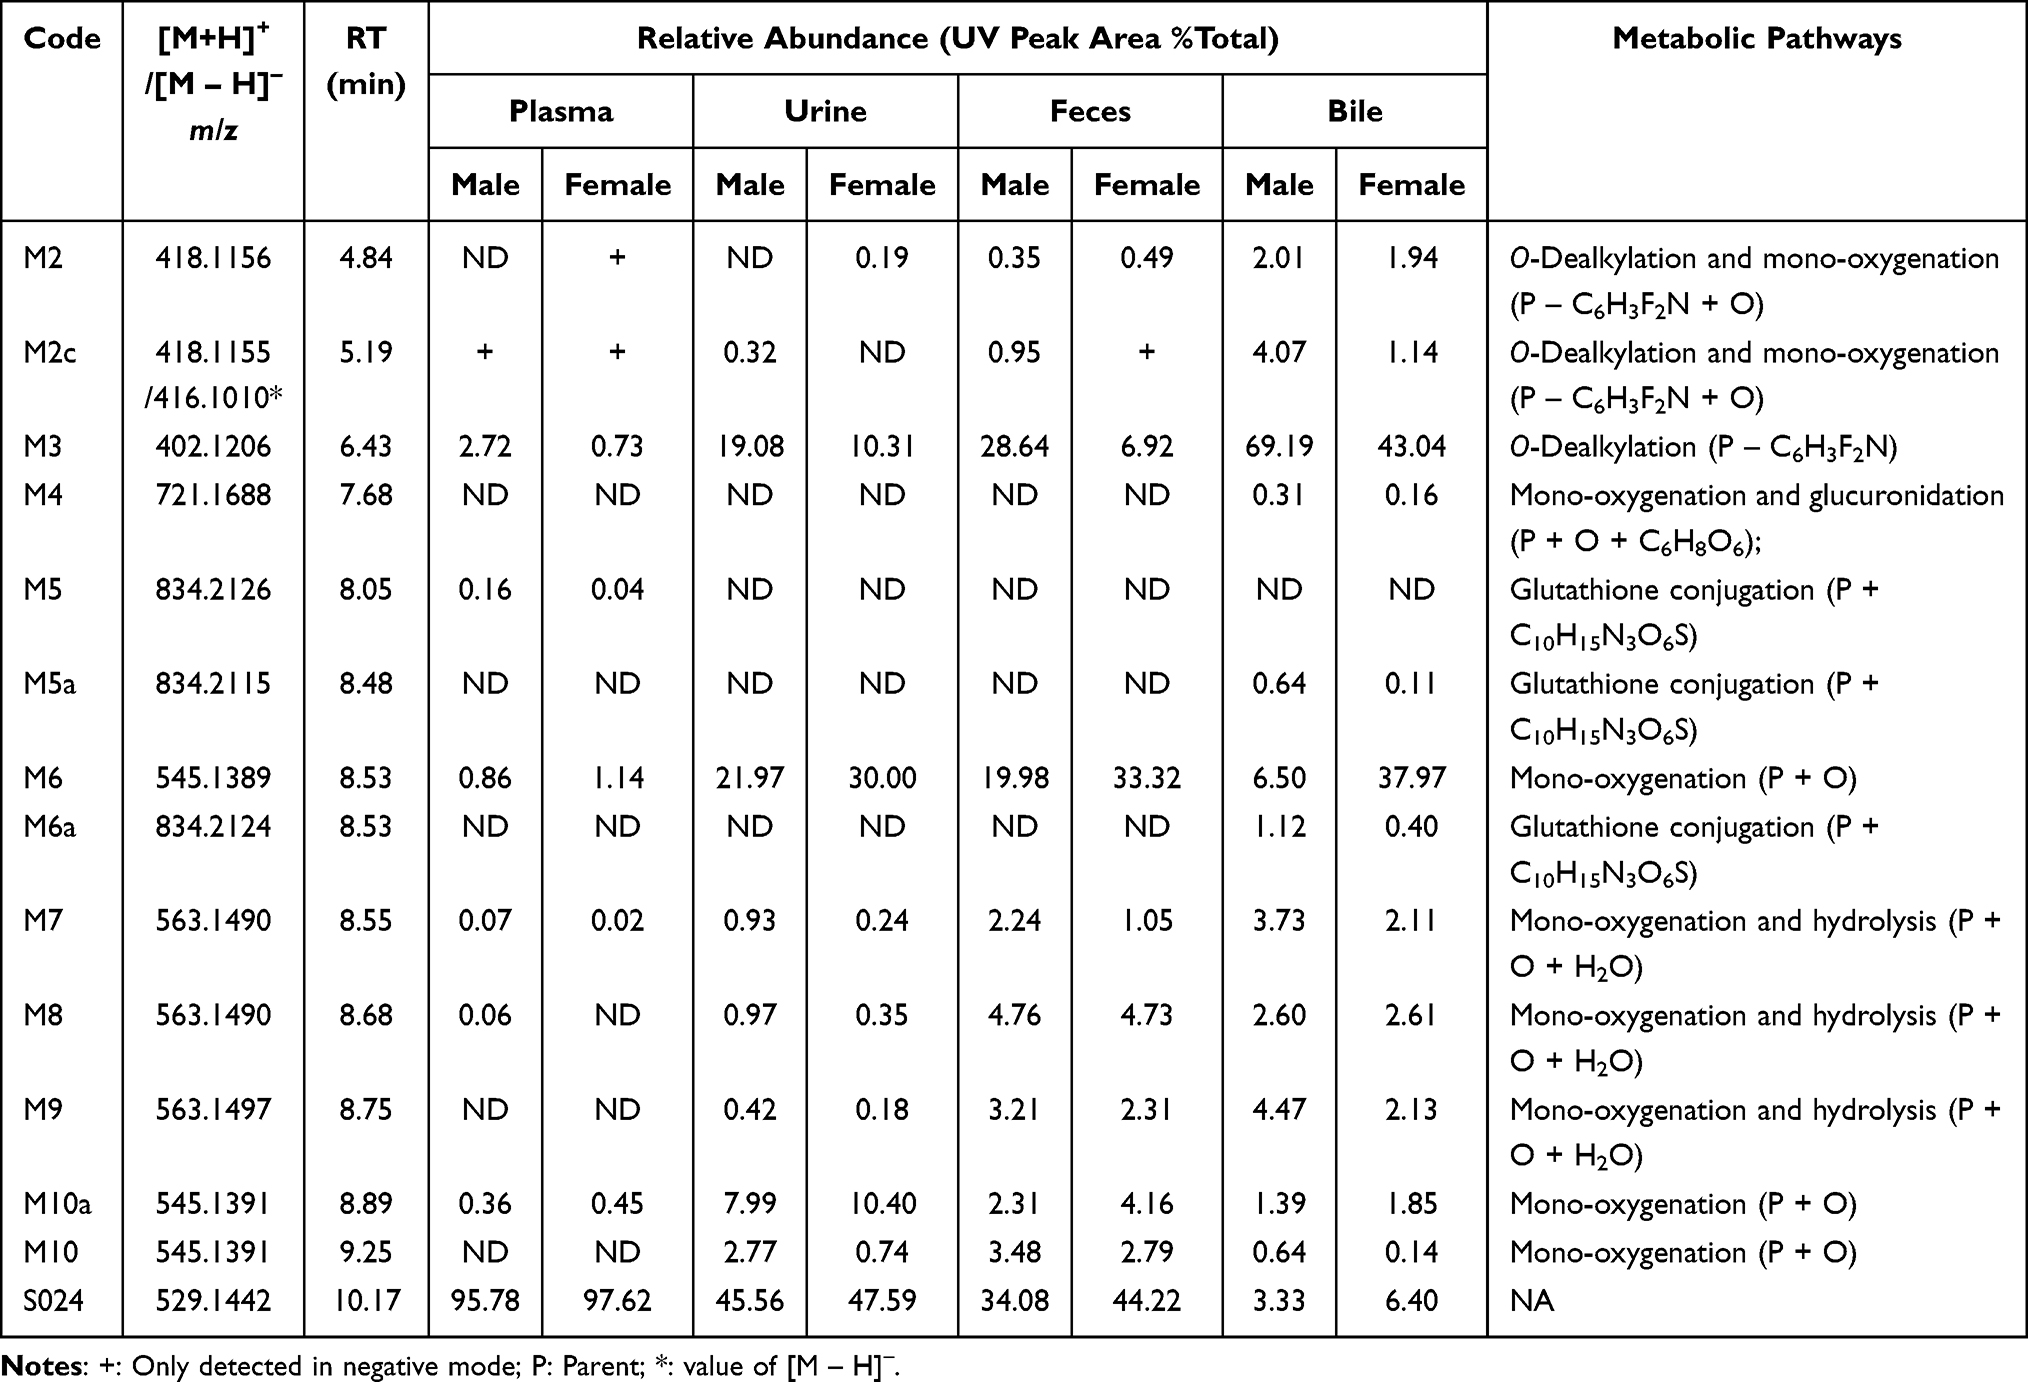 |
Table 5 S024 and Its Metabolites in Rat Plasma, Urine, Feces and Bile |
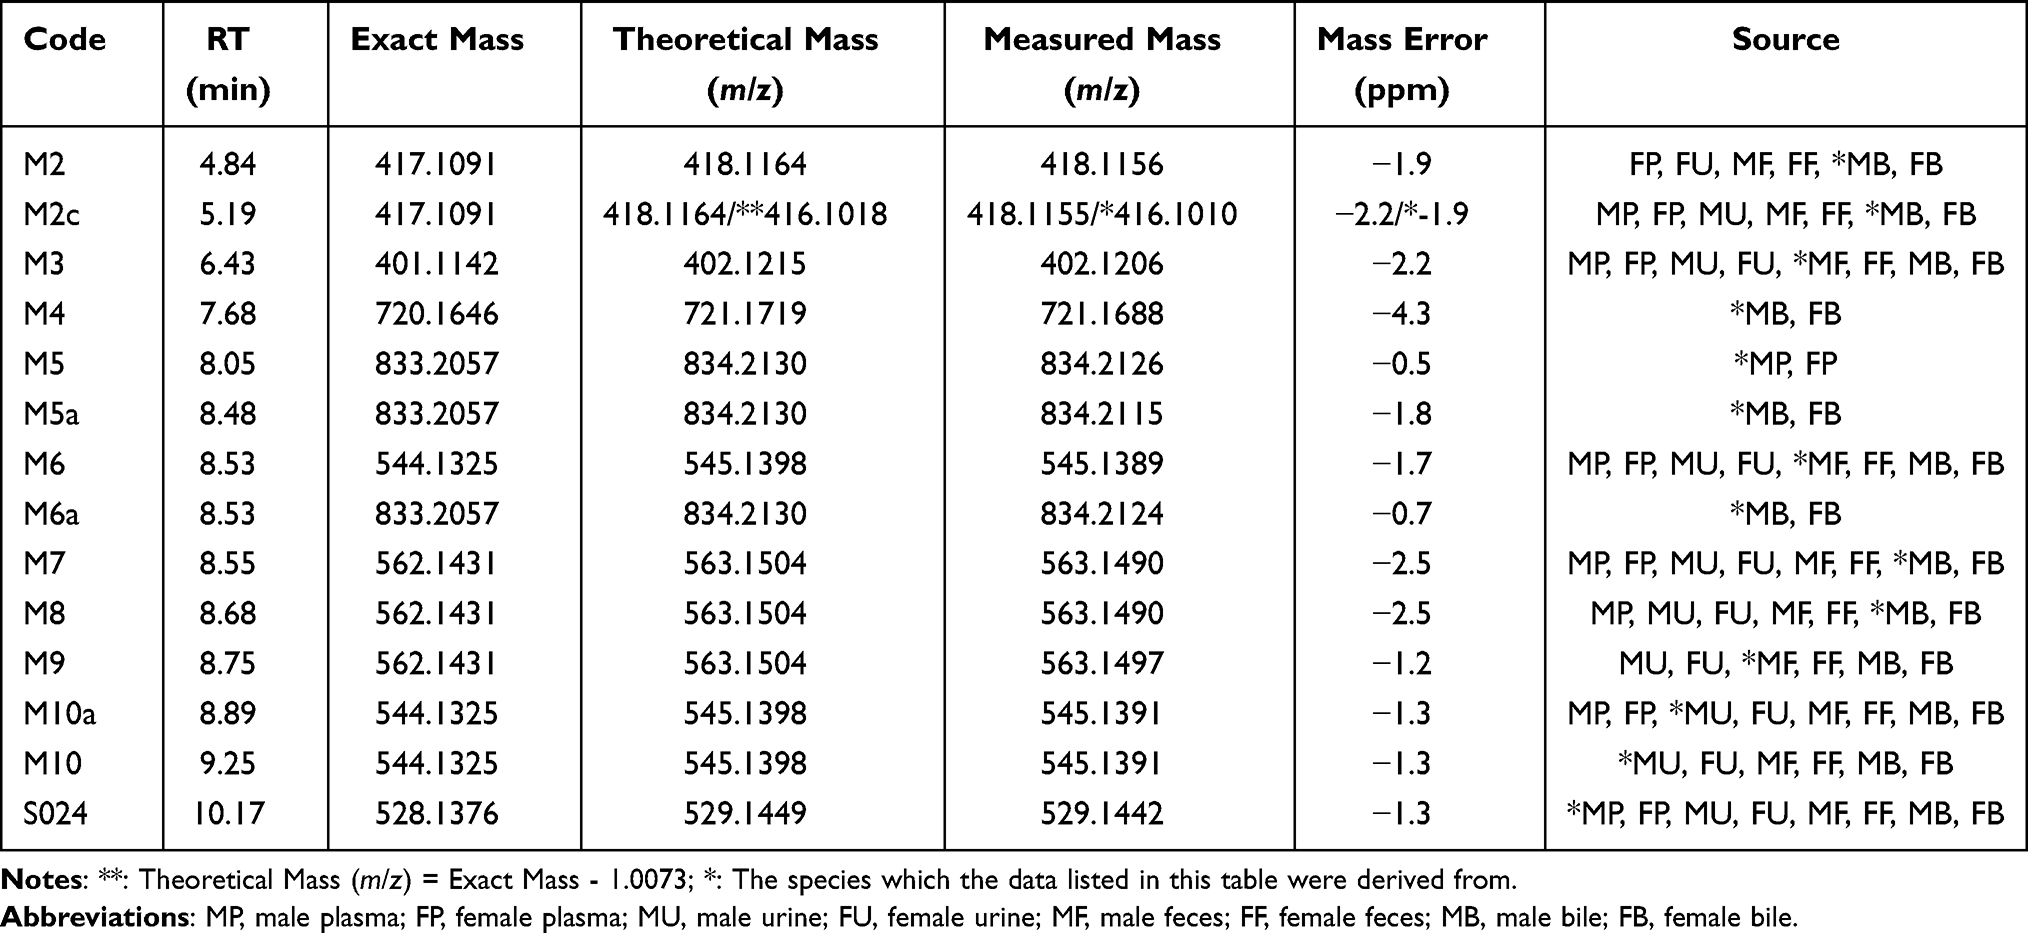 |
Table 6 Accurate Mass Measurements of S024 and Its Metabolites in Rat Plasma, Urine, Feces and Bile |
Phenotyping Characterization of Human Cytochrome P450 Responses
The CYP reaction phenotyping of S024 was conducted using a chemical inhibition approach. In the positive control reactions (Table S13), CYP isoform-selective inhibitors suppressed probe substrate metabolite formation by ≥81.8%, confirming effective enzyme inhibition. Chemical inhibition studies on S024 metabolism (Table S14 and Figure 6) revealed distinct CYP contributions to M6 and M3 formation. For M6, CYP2C8 was the primary metabolic enzyme, with montelukast (2.00 µM) inhibiting 79.1% of its formation—consistent with the 81.8% CYP2C8 inhibition in controls. CYP3A played a secondary role (44.4% inhibition by ketoconazole at 1.00 µM vs. 94.9% control inhibition). Other tested CYPs (1A2, 2B6, 2C9, 2C19, 2D6) had negligible effects (≤17.7% inhibition). For M3, CYP3A was dominant, as ketoconazole (1.00 µM) inhibited 86.8% of formation (vs. 94.9% control inhibition). The remaining CYPs (1A2, 2B6, 2C8, 2C9, 2C19, 2D6) contributed minimally (≤12.7% inhibition).
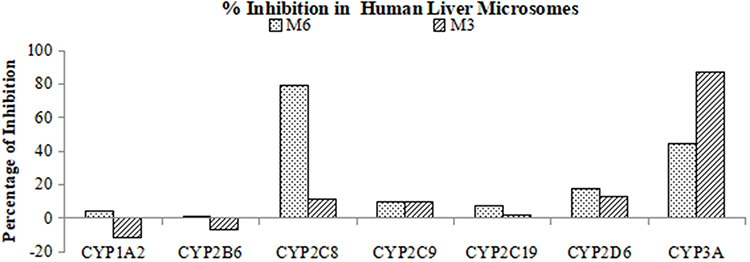 |
Figure 6 % Inhibition of S024 Metabolism in Human Liver Microsomes by CYP Isoform-Selective Chemical Inhibitors. |
Excretion
Excretion Study of S024 in Rats
Following a single oral administration of S024 (1 mg/kg) to SD rats, the cumulative excretion of S024 in urine, feces, and bile is summarized in Figure 7. In male intact rats, the mean recovery of S024 in urine and feces at 168 hours post-dose was 2.77 ± 0.500% and 6.22 ± 1.90% of the administered dose, respectively, resulting in a total recovery of 8.98 ± 2.24%. Similarly, in female intact rats, the mean recovery in urine and feces was 5.17 ± 0.862% and 11.2 ± 2.81%, respectively, with a total recovery of 16.3 ± 2.53%. Overall, the average total recovery in intact rats was 12.7% of the administered dose, with feces identified as the primary excretion route.
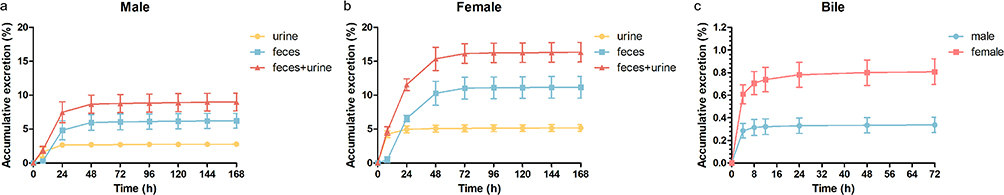 |
Figure 7 Cumulative dose recovery (%) of S024 in urine, feces in (a) male, (b) female and (c) bile in male and female following single oral administration at 1 mg/kg. |
In bile-duct-cannulated (BDC) rats, the mean recovery of S024 in bile at 72 hours post-dose was 0.337 ± 0.117% in males and 0.806 ± 0.194% in females, yielding an average total recovery of 0.572% of the administered dose.
Metabolite identification studies revealed two prominent metabolites of S024 (M3 and M6) in rats. Absorbed drug was extensively metabolized in vivo and eliminated primarily as metabolites, as the excretion study similarly quantified only parent drug recovery. The low recovery rates of the parent drug in rats (attributable to extensive metabolism in vivo) were consistent with these findings.
Drug-Drug Interaction (DDI)
CYPs Inhibition in HLMs
In this study, the inhibitory potential of selective inhibitors of S024 depletion in HLMs was determined. The CYPs inhibition results of S024 are presented in Figure 8. Under the tested conditions, S024 exhibited weak inhibitory activity against CYP2C8 with an IC50 of 77.2 μM. For the other CYP450 isoforms—CYP1A2, CYP2B6, CYP2C9, CYP2C19, CYP2D6, and CYP3A (assessed using both midazolam and testosterone as probe substrates)—the remaining enzymatic activities following S024 treatment ranged from 56.6% to 100.9%. Consequently, the IC50 values for these enzymes all exceeded 100 μM, indicating minimal inhibition.
 |
Figure 8 Line graph of CYP inhibition evaluation of S024. |
CYPs Induction Assays
For CYP enzyme activity, CYP gene expression and S024 metabolic stability are summarised in Table 7. LDH release data demonstrated that S024, at concentrations ranging from 0.100 to 10 μM, exhibited no cytotoxicity. Within the tested concentration range (0.100–10 µM), S024 did not induce CYP1A2 or CYP2B6 gene expression. Regarding CYP3A4, gene expression analysis revealed induction at 10.0 µM. However, enzyme activity assays indicated that S024, at concentrations from 0.100 to 10.0 µM, was not an inducer of CYP1A2, CYP2B6, or CYP3A4.
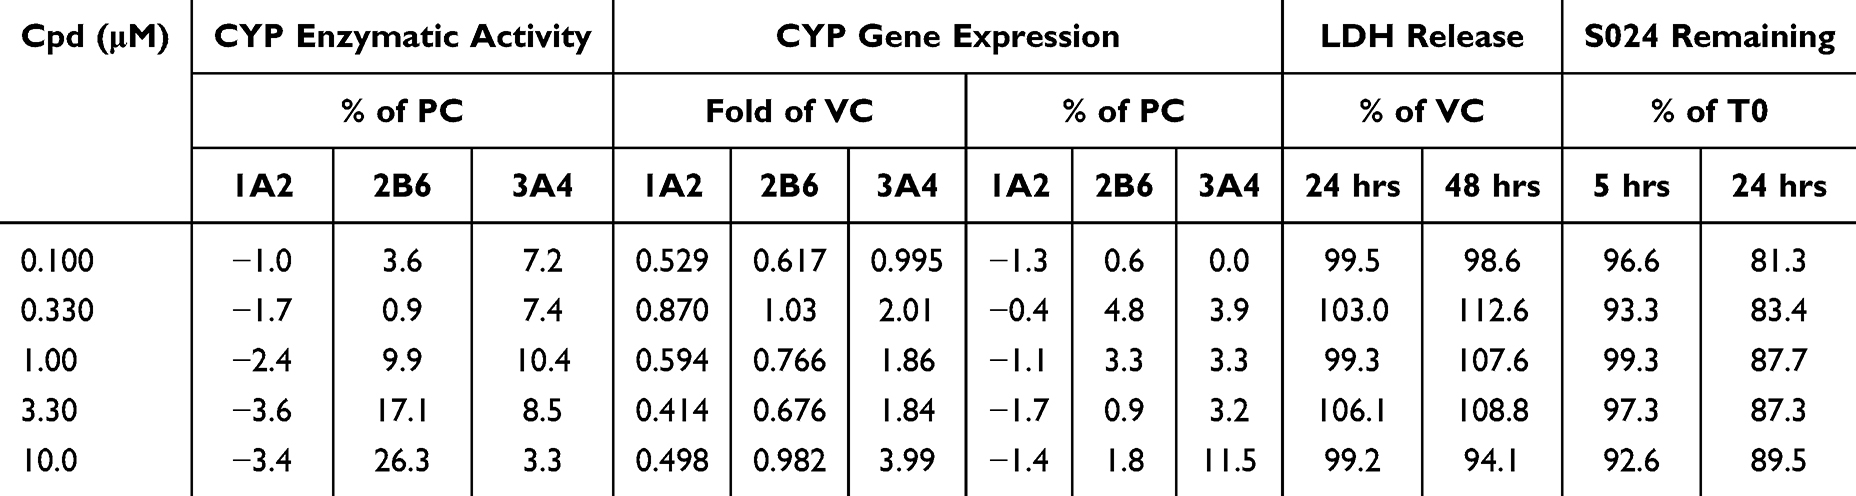 |
Table 7 CYP1A2, CYP2B6, and CYP3A4 Activity and Gene Expression Levels in Human Cryopreserved Hepatocytes Following Incubations with S024 and Metabolic Stability of S024 |
Inhibitory Potential of S024 on ABC Transporter Activity in Caco-2 Cells
Figure 9 illustrated the inhibitory effects of S024 on P-gp and BCRP activity in Caco-2 cells, with verapamil and novobiocin serving as positive controls, respectively. In the absence of S024 or verapamil (a known P-gp inhibitor), the mean digoxin concentration in receiver samples after 120 min incubation was 0.689 nM (A→B) and 617 nM (B→A), yielding an efflux ratio of 271. Verapamil concentration-dependently reduced the digoxin efflux ratio from 269 to 1.87, with an IC50 of 0.871 µM, confirming potent P-gp inhibition. Similarly, without S024 or novobiocin (a BCRP inhibitor), estrone 3-sulfate exhibited mean receiver concentrations of 4.95 nM (A→B) and 312 nM (B→A), corresponding to an efflux ratio of 18.8. Novobiocin decreased the estrone 3-sulfate efflux ratio from 19.4 to 2.26 in a concentration-dependent manner, demonstrating BCRP inhibition with an IC50 of 1.97 µM. S024 exhibited inhibitory effects on P-gp-mediated digoxin efflux, with an IC50 of 74.7 µM. In contrast, its impact on BCRP was negligible, as Caco-2 cells treated with S024 retained ≥117.4% BCRP activity, indicating an IC50 >100 µM.
 |
Figure 9 Effect of P-gp and BCRP activity in Caco-2 cells and IC50. Effects of (a) verapamil and (b) S024 on P-gp activity in Caco-2 Cells. Effects of (c) novobiocin and (d) S024 on BCRP activity in the Caco-2 Cell. |
Inhibitory Potential of S024 on SLC Transporters
Organic Anion Transporting Polypeptide 1B1, 1B3, (OATP1B1, OATP1B3) are transporters primarily located on the sinusoidal membrane of liver cells which function to actively uptake some small molecule drugs from the portal vein into hepatocytes. Organic Anion Transporter 1, 3 (OAT1, OAT3) and Organic Cation Transporter 2 (OCT2) are transporters primarily located on the basolateral membrane of proximal tubular cells of the kidneys which function to actively uptake a wide range of amphipathic and/or hydrophilic organic anions from the bloodstream into kidney cells. Multidrug and Toxin Extrusion 1 and Multidrug and Toxin Extrusion 2-K (MATE1, MATE2-K) are transporters primarily located on the lumen side of tubular cells of the kidneys which function to actively excrete drugs from tubular cells of the kidneys to urine. The interaction of a drug with those uptake transporters as a substrate or inhibitor may result in drug-drug interaction (DDI) and hence impact its efficacy, toxicity, or both.30 To investigate the inhibitory effects of S024 on OATP1B1, OATP1B3, OAT1, OAT3, OCT2, MATE1, and MATE2-K transporters, the uptake of substrate by HEK-293 cells, was measured in the presence of 0.0457–100 µM S024. Under test conditions as shown in Figure 10, S024 exhibited IC50 values of 19.1, 33.8, 6.55, and 79.7 µM against OAT3, OCT2, MATE1, and MATE2-K, respectively. Following S024 treatment, HEK293 cells expressing OATP1B1, OATP1B3, and OAT1 retained viability percentages of at least 85.2%, 63.8%, and 61.7%, respectively. Consequently, the IC50 values of S024 for these transporters all exceeded 100 µM.
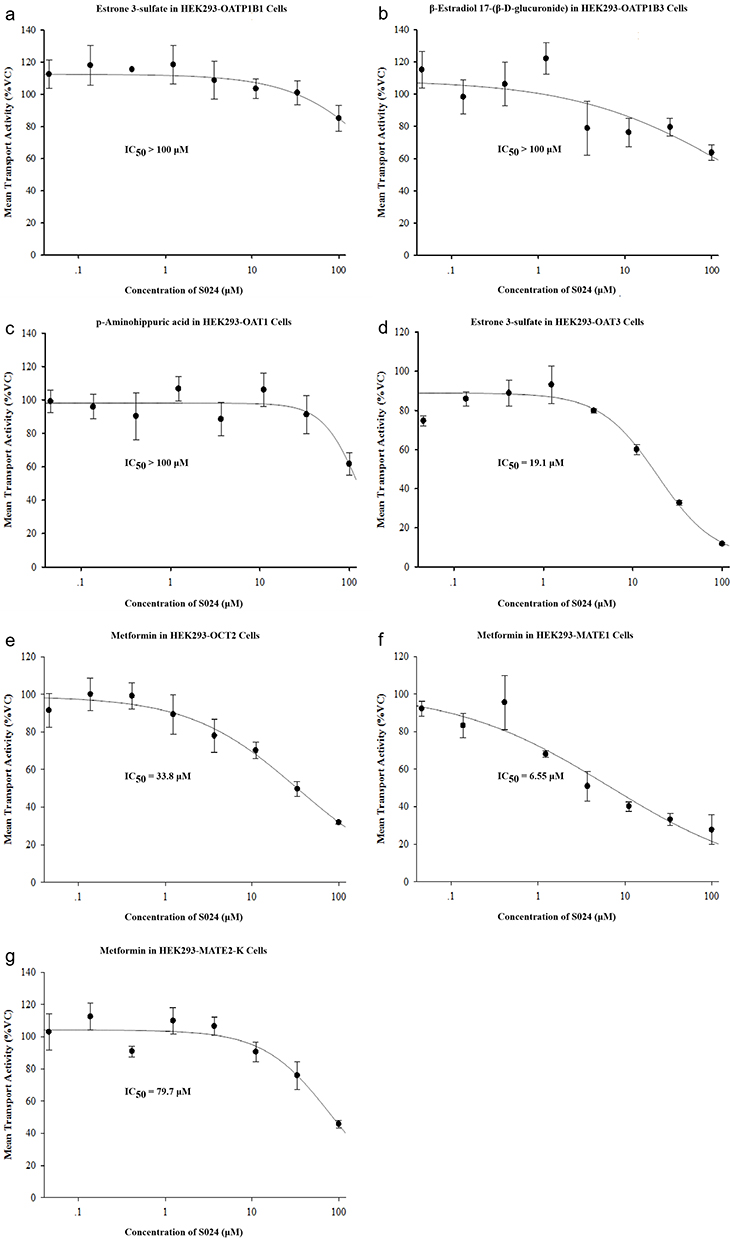 |
Figure 10 Effect of S024 on the uptake of (a) 60.0 nM estrone 3-sulfate in HEK293-OATP1B1 cells (b) 5.00 μM β-estradiol 17-(β-D-glucuronide) in HEK293-OATP1B3 cells (c) 5.00 μM p-aminohippuric acid in HEK293-OAT1 cells (d) 1.00 μM estrone 3-sulfate in HEK293-OAT3 cells (e) 100 μM metformin in HEK293-OCT2 cells (f) 20.0 μM metformin in HEK293-MATE1 cells (g) 20.0 μM metformin in HEK293-MATE2-K cells. |
Discussion
We developed S024, a novel small-molecule inhibitor targeting the p38/MK2 complex, through the structural optimization of ATI-450. In this study, the preclinical pharmacokinetic profile of S024 was systematically evaluated in accordance with the NMPA Guideline on Nonclinical Pharmacokinetics Studies of Pharmaceuticals and the ICH M12 DDI guideline. These results support the potential of S024 for clinical development.
Caco-2 permeability assays showed that S024 consistently exhibited efflux ratios greater than 2 at concentrations of 2, 10 and 100 µM in the absence of inhibitors, indicating P-gp-mediated efflux. In vivo, S024 demonstrated high oral bioavailability in both SD rats and beagle dogs, along with moderate half-lives and clearance. Repeated dosing for seven days resulted in no accumulation in either species. Across the examined dose ranges (0.3–3 mg/kg in rats and 0.1–1 mg/kg in dogs), systemic exposure increased more than dose-proportionally, suggesting possible saturation of metabolic enzymes or efflux transporters. Food intake did not affect drug absorption in either species, indicating that S024 can be administered without regard to meals. A modest sex-related difference in exposure was observed in rats but not in dogs; given the higher prevalence of RA in women,3 this observation warrants further investigation in clinical studies to assess potential sex-specific dosing considerations.
Small molecule drugs commonly bind to plasma proteins, mainly via electrostatic and hydrophobic interactions. Plasma protein binding (PPB) may influence drug distribution and elimination and thereby impact pharmacokinetic profiles and pharmacological effects.31 S024 exhibited moderate PPB across all five species tested (mouse: 73.6–76.2%; rat: 67.3–70.7%; dog: 66.1–70.9%; monkey: 43.8–52.4%; human: 50.4–57.7%), with no significant concentration dependence over the 0.1–10 µM range. This moderate binding profile suggests a potentially favorable therapeutic window, as highly bound drugs (>99%) are more susceptible to DDIs resulting from displacement interactions.32 The moderate PPB characteristic of S024 confers favorable implications for both its PK profile and therapeutic efficacy. Compared to drugs with high PPB, moderate PPB allows a larger fraction of unbound drug to be available for target engagement, potentially leading to enhanced pharmacological activity. Conversely, in contrast to drugs with low PPB, moderate binding reduces the risk of excessive distribution of free drug into non-target tissues, thereby minimizing off-target effects. Additionally, it prevents an overly high free fraction from being rapidly cleared by metabolic organs such as the liver and kidneys, supporting a balanced PK profile conducive to sustained exposure and efficacy. Consistent with its moderate lipophilicity, S024 exhibited extensive tissue distribution in rats following oral administration. The highest drug exposures were observed in the gastrointestinal tract and well-perfused organs, consistent with the absorption and elimination pathways. The low brain concentrations suggest limited central nervous system penetration, which is desirable for a peripherally acting anti-inflammatory agent, potentially minimizing CNS-related adverse effects.33 The whole blood-to-plasma concentration ratio was approximately 0.9, indicating preferential distribution in plasma over erythrocytes.
In vitro hepatocyte studies revealed marked species differences in the metabolic clearance of S024. The intrinsic hepatic clearance values followed the order: mouse > rat ≈ monkey > dog > human. This slow metabolic turnover in human hepatocytes suggests that S024 may exhibit favorable pharmacokinetic properties in humans, with potentially prolonged half-life and sustained exposure. CYP phenotyping studies identified CYP2C8 and CYP3A as the primary enzymes responsible for S024 metabolism. For the mono-oxygenated metabolite M6, CYP2C8 played a dominant role, while CYP3A contributed to a lesser extent. For the O-dealkylated metabolite M3, CYP3A was the principal enzyme. This dual metabolic pathway may reduce the risk of clinically significant DDIs, as alternative clearance routes remain available if one pathway is inhibited. Metabolite profiling identified ten metabolites (M1–M10) in hepatocytes, with O-dealkylation to M3 and mono-oxygenation to M6 representing the major biotransformation pathways. All metabolites detected in human hepatocytes were also observed in at least three nonclinical species, confirming that the safety profile of human metabolites can be adequately evaluated in standard animal toxicity studies, in accordance with ICH M3(R2) guidance.
The excretion studies indicated that S024 was eliminated predominantly as metabolites via the feces. Due to the slow metabolic rate in human hepatocytes, S024 was expected to be excreted mainly as the parent drug via the feces in human.
The DDI risk of S024 was systematically evaluated against major CYP enzymes and drug transporters. S024 exhibited weak inhibition of CYP2C8 (IC50 = 77.2 µM), while IC50 values for other CYP isoforms exceeded 100 µM. According to the FDA guidance on drug interaction studies, an IC50 value greater than 10-fold the clinical Cmax suggests a low risk of DDIs. In human hepatocyte induction assays, S024 at 10 µM increased CYP3A4 mRNA expression approximately 4-fold, but this did not translate into increased enzymatic activity. This dissociation between transcriptional activation and functional enzyme activity has been reported for other compounds and may involve post-transcriptional regulatory mechanisms.34 Importantly, CYP1A2 and CYP2B6 were unaffected at both mRNA and activity levels. Based on these data, S024 is unlikely to cause clinically relevant enzyme induction at therapeutic concentrations. Transporter inhibition studies revealed that S024 inhibited P-gp with an IC50 of 74.7 µM, while its effect on BCRP was negligible. For renal transporters, S024 exhibited moderate inhibition of OAT3, OCT2, and MATE1. Inhibition of hepatic uptake transporters OATP1B1 and OATP1B3 was minimal, suggesting low risk for interactions with statins and other OATP substrates.
Conclusion
In summary, this study systematically evaluated the preclinical pharmacokinetic, ADME, and DDI characteristics of S024. S024 demonstrated high oral bioavailability, dose-dependent systemic exposure, and minimal accumulation. It also displayed a well-defined metabolic profile, with CYP2C8 and CYP3A identified as the primary metabolic enzymes, and was eliminated predominantly as metabolites via feces in rats. Furthermore, the in vitro data indicated a low potential for clinically significant DDIs, evidenced by its minimal functional impact on major CYP450 enzymes and key drug transporters. Notably, sex-related exposure differences were observed, particularly in rats. Overall, these findings support the further development of S024 as an oral drug for the treatment of RA disease in the clinic. However, this comprehensive preclinical evaluation has several limitations. First, all DDI assessments were performed using in vitro systems; although these assays are standard, the clinical DDI risk requires confirmation in dedicated interaction studies. Second, the potential contribution of circulating metabolites to pharmacological activity or toxicity was not assessed; while all human metabolites were covered in animal toxicity studies, their individual pharmacokinetic profiles remain to be characterized. Finally, the sex-related differences observed in rat PK warrant validation in human studies, particularly given the female predominance of RA.
Data Sharing Statement
The authors declare that all the data supporting the findings of this study are contained within the paper.
Animal Ethics Statement
All experiments in this study were conducted at WuXi AppTec. The animal studies were performed strictly in accordance with protocols approved by WuXi AppTec’s Institutional Animal Care and Use Committees (IACUCs). The institutional animal use facility holds the license number SYXK (Shanghai) 2020-0034. The specific IACUC approval numbers for the reported experiments are PK02-001-2021v1.0 and SZ20220524-Dogs. All the animals used in the experiment have qualified certificate numbers, which are No.110318211100056963, No.1103182011000294, No.110318211100016781, No.110318211100012088, No.110318221100014226, No.110318201100057825, No.110318211100019265, No.110318211100064324, No.202227103, No.1103182011000246, No.110318221100018913, No.202220707, No.1103182011000122, No.110318201100076936, No.202213822, No.110318210100048287, No.110011221106009258, No.110011221106249042, No.110011221106445268 and No.110011221106445388.
Acknowledgments
The study was supported by the School of Pharmaceutical Sciences (Shenzhen), Sun Yat-sen University and the financial assistance from Shenzhen Salubris Pharmaceuticals Co., Ltd.
Author Contributions
All authors made a significant contribution to the work reported, whether that is in the conception, study design, execution, acquisition of data, analysis and interpretation, or in all these areas; took part in drafting, revising or critically reviewing the article; gave final approval of the version to be published; have agreed on the journal to which the article has been submitted; and agree to be accountable for all aspects of the work.
Funding
These studies were funded by Shenzhen Salubris Pharmaceuticals Co., Ltd.
Disclosure
The authors declare no conflict of interest.
References
1. Duong SQ, Crowson CS, Athreya A, et al. Clinical predictors of response to methotrexate in patients with rheumatoid arthritis: a machine learning approach using clinical trial data. Arthritis Res Ther. 2022;24(1):162. doi:10.1186/s13075-022-02851-5
2. Black RJ, Cross M, Haile LM, et al. Global, regional, and national burden of rheumatoid arthritis, 1990–2020, and projections to 2050: a systematic analysis of the global burden of disease study 2021. Lancet Rheumatol. 2023;5(10):e594–25. doi:10.1016/S2665-9913(23)00211-4
3. Alpízar-Rodríguez D, Pluchino N, Canny G, Gabay C, Finckh A. The role of female hormonal factors in the development of rheumatoid arthritis. Rheumatology. 2017;56(8):1254–1263. doi:10.1093/rheumatology/kew318
4. Burmester GR, Pope JE. Novel treatment strategies in rheumatoid arthritis. Lancet. 2017;389(10086):2338–2348. doi:10.1016/S0140-6736(17)31491-5
5. McInnes IB, Schett G. Pathogenetic insights from the treatment of rheumatoid arthritis. Lancet. 2017;389(10086):2328–2337. doi:10.1016/S0140-6736(17)31472-1
6. Bartok B, Firestein GS. Fibroblast-like synoviocytes: key effector cells in rheumatoid arthritis. Immunol Rev. 2010;233(1):233–255. doi:10.1111/j.0105-2896.2009.00859.x
7. Ding Q, Hu W, Wang R, et al. Signaling pathways in rheumatoid arthritis: implications for targeted therapy. Signal Transduct Target Ther. 2023;8:68. doi:10.1038/s41392-023-01331-9
8. Firestein GS. Evolving concepts of rheumatoid arthritis. Nature. 2003;423(6937):356–361. doi:10.1038/nature01661
9. Li YY, Yuece B, Mh C, et al. Inhibition of p38/Mk2 signaling pathway improves the anti-inflammatory effect of WIN55 on mouse experimental colitis. Lab Invest. 2013;93(3):322–333. doi:10.1038/labinvest.2012.177
10. Singh RK, Najmi AK, Dastidar SG. Biological functions and role of mitogen-activated protein kinase activated protein kinase 2 (MK2) in inflammatory diseases. Pharmacol Rep. 2017;69(4):746–756. doi:10.1016/j.pharep.2017.03.023
11. Jones DS, Jenney AP, Joughin BA, Sorger PK, Lauffenburger DA. Inflammatory but not mitogenic contexts prime synovial fibroblasts for compensatory signaling responses to p38 inhibition. Sci Signal. 2018;11(520):eaal1601. doi:10.1126/scisignal.aal1601
12. Machado TR, Machado TR, Pascutti PG. The p38 MAPK inhibitors and their role in inflammatory diseases. Chem Select. 2021;6(23):5729–5742. doi:10.1002/slct.202100406
13. Menon MB, Gaestel M. MK2-TNF-signaling comes full circle. Trends Biochem Sci. 2018;43(3):170–179. doi:10.1016/j.tibs.2017.12.002
14. Malona J, Chuaqui C, Seletsky BM, et al. Discovery of CC-99677, a selective targeted covalent MAPKAPK2 (MK2) inhibitor for autoimmune disorders. Transl Res. 2022;249:49–73. doi:10.1016/j.trsl.2022.06.005
15. Hope HR, Hockerman S, Saabye M, et al. ATI-450: a novel MK2 pathway inhibitor - preclinical & clinical translational studies to predict human dose. J Pharmacol Exp Ther. 2023;385(S3). doi:10.1124/jpet.122.541040
16. Tran QTN, Gan PXL, Liao W, Mok YK, Chai CLL, Wong WSF. Degradation of MK2 with natural compound andrographolide: a new modality for anti-inflammatory therapy. Pharmacol Res. 2023;194:106861. doi:10.1016/j.phrs.2023.106861
17. Abdel-Magid AF. Inhibitors of mitogen-activated protein kinase-activated protein kinase 2 (MK2) as treatment for inflammatory diseases. ACS Med Chem Lett. 2024;15(9):1421–1423. doi:10.1021/acsmedchemlett.4c00393
18. Haller V, Nahidino P, Forster M, Laufer SA. An updated patent review of p38 MAP kinase inhibitors (2014-2019). Expert Opin Ther Pat. 2020;30(6):453–466. doi:10.1080/13543776.2020.1749263
19. A Phase 2 multicenter, randomized, double-blinded, placebo-controlled, parallel-group study to evaluate the efficacy and safety of a mitogen-activated protein kinase-activated protein kinase 2 (MK2) inhibitor in active ankylosing spondylitis. ACR Meeting Abstracts. Available from: https://acrabstracts.org/abstract/a-phase-2-multicenter-randomized-double-blinded-placebo-controlled-parallel-group-study-to-evaluate-the-efficacy-and-safety-of-a-mitogen-activated-protein-kinase-activated-protein-kinase-2-mk2-i/.
20. Gordon D, Kivitz A, Singhal A, et al. Selective inhibition of the MK2 pathway: data from a phase iia randomized clinical trial in rheumatoid arthritis. ACR Open Rheumatol. 2023;5(2):63–70. doi:10.1002/acr2.11517
21. Inc AT. Aclaris therapeutics announces top-line results from 12-week Phase 2b trial of oral zunsemetinib (ATI-450) for moderate to severe rheumatoid arthritis and provides corporate update. GlobeNewswire News Room. 2023. Available from: https://www.globenewswire.com/news-release/2023/11/13/2778890/37216/en/Aclaris-Therapeutics-Announces-Top-line-Results-from-12-Week-Phase-2b-Trial-of-Oral-Zunsemetinib-ATI-450-for-Moderate-to-Severe-Rheumatoid-Arthritis-and-Provides-Corporate-Update.html.
22. Wang C, Hockerman S, Jacobsen EJ, et al. Selective inhibition of the p38α MAPK-MK2 axis inhibits inflammatory cues including inflammasome priming signals. J Exp Med. 2018;215(5):1315–1325. doi:10.1084/jem.20172063
23. Das B, Baidya ATK, Mathew AT, Yadav AK, Kumar R. Structural modification aimed for improving solubility of lead compounds in early phase drug discovery. Bioorg Med Chem. 2022;56:116614. doi:10.1016/j.bmc.2022.116614
24. Stielow M, Witczyńska A, Kubryń N, Fijałkowski Ł, Nowaczyk J, Nowaczyk A. The bioavailability of drugs-the current state of knowledge. Molecules. 2023;28(24):8038. doi:10.3390/molecules28248038
25. Fu D, Yang Z, Jia X, et al. Discovery of a novel p38α-MK2 complex inhibitor as a potential choice for autoimmune diseases. J Med Chem. 2025;68(2):1328–1343. doi:10.1021/acs.jmedchem.4c01925
26. Xu F, Li DP, Huang ZC, et al. Exploring in vitro, in vivo metabolism of mogroside V and distribution of its metabolites in rats by HPLC-ESI-IT-TOF-MSn. J Pharm Biomed Anal. 2015;115:418–430. doi:10.1016/j.jpba.2015.07.024
27. Sudsakorn S, Bahadduri P, Fretland J, Lu C. 2020 FDA drug-drug interaction guidance: a comparison analysis and action plan by pharmaceutical industrial scientists. Curr Drug Metab. 2020;21(6):403–426. doi:10.2174/1389200221666200620210522
28. Committee for Human Medicinal Products (CHMP), European Medicines Agency. Guideline on the investigation of drug interactions. European Medicines Agency; 2012. Available from: https://www.ema.europa.eu/en/documents/scientific-guideline/guideline-investigation-drug-interactions-revision-1_en.pdf.
29. Di L, Breen C, Chambers R, et al. Industry perspective on contemporary protein-binding methodologies: considerations for regulatory drug-drug interaction and related guidelines on highly bound drugs. J Pharm Sci. 2017;106(12):3442–3452. doi:10.1016/j.xphs.2017.09.005
30. Center for Drug Evaluation and Research, US Food and Drug Administration. In vitro drug interaction studies: cytochrome P-450 enzyme- and transporter-mediated drug interactions. US Department of Health and Human Services; 2020.
31. Di L. An update on the importance of plasma protein binding in drug discovery and development. Expert Opin on Drug Discov. 2021;16(12):1453–1465. doi:10.1080/17460441.2021.1961741
32. Decoding the key role of plasma protein binding in drug-drug interactions - WuXi AppTec DMPK. Available from: https://dmpkservice.wuxiapptec.com/articles/451-decoding-the-key-role-of-plasma-protein-binding-in-drug-drug-interactions/.
33. Wang Y, Hu X, Huang H, et al. Optimization of 4-arylthiophene-3-carboxylic acid derivatives as inhibitors of ANO1: lead optimization studies toward their analgesic efficacy for inflammatory pain. Eur J Med Chem. 2022;237:114413. doi:10.1016/j.ejmech.2022.114413
34. Garrido-Godino AI, Cuevas-Bermúdez A, Gutiérrez-Santiago F, Del C Mota-Trujillo M, Navarro F. The association of Rpb4 with RNA Polymerase II depends on CTD Ser5P phosphatase Rtr1 and influences mRNA decay in saccharomyces cerevisiae. Int J Mol Sci. 2022;23(4):2002. doi:10.3390/ijms23042002
 © 2026 The Author(s). This work is published and licensed by Dove Medical Press Limited. The
full terms of this license are available at https://www.dovepress.com/terms
and incorporate the Creative Commons Attribution
- Non Commercial (unported, 4.0) License.
By accessing the work you hereby accept the Terms. Non-commercial uses of the work are permitted
without any further permission from Dove Medical Press Limited, provided the work is properly
attributed. For permission for commercial use of this work, please see paragraphs 4.2 and 5 of our Terms.
© 2026 The Author(s). This work is published and licensed by Dove Medical Press Limited. The
full terms of this license are available at https://www.dovepress.com/terms
and incorporate the Creative Commons Attribution
- Non Commercial (unported, 4.0) License.
By accessing the work you hereby accept the Terms. Non-commercial uses of the work are permitted
without any further permission from Dove Medical Press Limited, provided the work is properly
attributed. For permission for commercial use of this work, please see paragraphs 4.2 and 5 of our Terms.