Back to Journals » Therapeutics and Clinical Risk Management » Volume 13
Positive correlation between environmental PM2.5 and blood lead levels in patients undergoing maintenance hemodialysis
Authors Chen CY, Liu MH ![]() , Hsu CW, Weng CH
, Hsu CW, Weng CH ![]() , Yen TH
, Yen TH ![]() , Huang WH
, Huang WH ![]()
Received 4 January 2017
Accepted for publication 13 March 2017
Published 24 April 2017 Volume 2017:13 Pages 555—564
DOI https://doi.org/10.2147/TCRM.S131565
Checked for plagiarism Yes
Review by Single anonymous peer review
Peer reviewer comments 2
Editor who approved publication: Professor De Yun Wang
Chao-Yu Chen,1,2,* Ming-Hui Liu,3,* Ching-Wei Hsu,1,2 Cheng-Hao Weng,1,2 Tzung-Hai Yen,1,2 Wen-Hung Huang1,2
1Department of Nephrology and Division of Clinical Toxicology and Toxicology Laboratory, Chang Gung Memorial Hospital, Linkou Medical Center, Taoyuan, Taiwan, Republic of China; 2Chang Gung University College of Medicine, Taoyuan, Taiwan, Republic of China; 3Department of Pediatric Dentistry, Chang Gung Memorial Hospital, Tao-Yuan, Taiwan, Republic of China
*These authors contributed equally to this work
Abstract: Patients undergoing hemodialysis (HD) have significantly higher mean blood lead levels (BLLs) than those in healthy individuals. Because elementary lead can be found in particulate matter with a diameter of <2.5 µm (PM2.5), this cross-sectional study was conducted to assess the effect of environmental PM2.5 exposure and other clinical variables on BLLs in patients receiving HD. We recruited 921 patients on maintenance HD (MHD) who had undergone HD for at least 6 months and who had previously participated in a BLL study. Mean PM2.5 concentrations in living environments in the previous 12 and 24 months were analyzed using a blood lead test. From a multivariate analysis, after adjustment for related factors, the mean PM2.5 concentrations in the previous 12 and 24 months were positively associated with log BLLs. In addition, days with PM2.5 levels exceeding the standard level during the previous 12 and 24 months were positively associated with log BLLs. Patients exposed to higher PM2.5 concentrations and more days with PM2.5 levels exceeding the standard level exhibited a higher prevalence of high and high-normal BLLs and a lower prevalence of low-normal BLLs. After adjustment for related variables, the BLLs exhibited a significantly positive association with environmental PM2.5 in patients undergoing MHD.
Keywords: air pollution, particulate matter, PM2.5, lead, hemodialysis
Introduction
Patients undergoing hemodialysis (HD) have significantly higher mean blood lead levels (BLLs) than those in healthy individuals.1–3 In such patients, BLLs were associated with mortality.4,5 The sources of lead absorption are categorized as food, beverages, drinking water, paint, factory emissions, and automobile exhausts.6 Therefore, patients undergoing HD are advised to avoid ingesting foods containing lead, such as deep-sea fish, deep-sea food, lead-related Chinese herbs, and soup boiled with the pig or cattle bones, as well as to avoid contact with lead-related factories or painting. However, inspiration of elemental lead from air tends to be neglected. Recently, air pollution, especially particulate matter with a diameter of <2.5 μm (PM2.5), has become a crucial problem because of its chronic effect on human health. Zereini et al7 measured heavy metal concentrations in airborne dust and revealed that the main fraction of lead was found in fine particles with a diameter of <2.1 μm. According to our review of the relevant literature, studies on the relationship between environmental PM2.5 and BLL in patients undergoing HD are limited, and this relationship remains obscure. Therefore, the aim of the current cross-sectional study was to assess the effect of environmental PM2.5 exposure and other clinical variables on BLLs in patients undergoing HD.
Methods
The study protocol was approved by the institutional review board of Chang Gung Memorial Hospital. Because this was a retrospective cross-sectional study, no informed consent was required. All patient information was protected and was available only to the investigators, and all medical records, including medical history, laboratory data, and inclusion and exclusion criteria, were reviewed by senior nephrologists during the study period. All primary data were collected according to the Strengthening the Reporting of Observational Studies in Epidemiology guidelines.
Patients
Patients were recruited from the HD centers of the Chang Gung Memorial Hospital branches in Linkou, Taipei, and Taoyuan. Only patients on maintenance HD (MHD) who had undergone HD for at least 6 months, were aged ≥18 years, and had previous blood lead studies4,8 were enrolled (Figure 1). A questionnaire was arranged to survey patients to identify and exclude those who had a history of occupational exposure to lead or previous lead intoxication or those who lived in lead-contaminated areas. In addition, patients with malignancies or infectious diseases or those who had been hospitalized or had undergone surgery within the previous 3 months were excluded. Diabetes mellitus (DM) was identified according to either a physician’s diagnosis, antidiabetic drug treatment, or 2 consecutive analyses demonstrating fasting blood glucose levels of >126 mg/dL. Most patients underwent 4 h of HD 3 times a week. HD was performed using single-use hollow-fiber dialyzers equipped with modified cellulose, polyamide, or polysulfone membranes. The dialysate used in all cases had a standard ionic composition with a bicarbonate-based buffer. Patients who had undergone hemodiafiltration (HDF) 3 times a week for ≥3 months were enrolled. We evaluated the prevalence of cardiovascular diseases (CVDs), including cerebrovascular disease, coronary artery disease, congestive heart failure, and peripheral vascular disease, in the patients. Hypertension was defined as the regular use of antihypertensive drugs for controlling blood pressure or at least 2 blood pressure measurements of >140/90 mmHg. In addition, smoking behavior (with smokers being defined as those who smoked in the past 30 days) was analyzed.
 | Figure 1 Flowchart of patient enrollment. |
Laboratory, nutritional, and inflammatory parameters
All blood samples were obtained from the arterial end of the vascular access immediately after the initial 2-day interval for HD and were then centrifuged and stored at −80°C until use. Serum creatinine levels, normalized protein catabolic rates (nPCRs), and serum albumin levels were assayed and recorded as nutritional markers. High-sensitivity C-reactive protein (hsCRP) levels were measured as the indices of inflammation. Serum hsCRP levels were measured using immunonephelometry (Nanopia CRP; Daiichi Inc, Tokyo, Japan). The lowest detection limit was <0.15 mg/L. All other biochemical parameters were measured using the standard laboratory approach with an automatic analyzer. In patients on HD, the dialyzer clearance of urea was measured using the method described by Daugirdas9 and was expressed as Kt/Vurea. The nPCR of the patients on HD was calculated using validated equations and was normalized to their body weight.10 The serum calcium level was corrected using the serum albumin level with the following formula: corrected calcium level (mg/dL) = serum calcium level +0.8× (4.0 − serum albumin level). Nonanuria was defined as a daily urine output of ≥100 mL.
Measurement of blood lead levels
BLLs were measured using a previously described method.4,8,11 To exclude the possibility that patients on MHD were exposed to lead through the contamination of water or dialysate during HD, we collected at least 2 samples of water and dialysate from outlets of reverse osmosis systems and inlets of dialysate of dialyzers in lead-free plastic bottles from each HD center.4 Lead levels were measured using an electrothermal atomic absorption spectrometer (SpectrAA-200Z; Varian, Lexington, MA, USA) with Zeeman background correction and an L’vov platform. A certified commercially prepared product (Seronorm Trace Elements; Sero AS, Billingstad, Norway) was used to determine intrabatch accuracy and confirm interbatch standardization. The coefficient of variation for lead measurement was ≤5.0%. External quality control was maintained through patient participation in the National Quality Control Program conducted by the government. BLLs of each patient were measured 2 times with a 3-month interval. The BLL grade was defined as follows: low-normal BLL, BLL <10 μg/dL; high-normal BLL, 20 μg/dL > BLL ≥10 μg/dL; high BLL, and BLL ≥20 μg/dL.2,8
Environmental particulate matter – PM2.5
Data from the Taiwan Air Quality Monitoring Network, including the database on the air quality status in Taiwan, were analyzed.12 Individual exposure to air pollution was estimated using a geographic information system with the mean concentrations of air pollutants in the previous 12 and 24 months.13–17 Because no previous studies have focused on this issue, the mean concentrations of PM2.5 in the previous 12 and 24 months were considered for each participant. A mean 24 h PM2.5 concentration level of <35 μg/m3 is defined as normal.12
Statistical analysis
Data were analyzed using SPSS version 12.0 for Windows 95 (SPSS Inc, Chicago, IL, USA). The normal distribution of variables was analyzed using the Kolmogorov–Smirnov test. A P-value of >0.05 was considered to indicate normal distribution. Data are expressed in terms of median and interquartile range in nonnormal distribution variables and as mean ± standard deviation in normal distribution variables, and categorical variables are expressed as numbers or percentages. Chi-squared test or Fisher’s exact test was used for analyzing the correlation between categorical variables. One-way analysis of variance was performed to compare the clinical variables among the 3 groups. Linear trends were used to analyze the correlation between ordinal variables. The data on hsCRP, intact parathyroid hormone (iPTH), BLL, and ferritin levels were log transformed for analysis. To evaluate the variables related to BLL, univariate and multivariate (stepwise method) linear regression analyses were performed to assess the standardized coefficients (β) and 95% confidence intervals (CIs) for the baseline variables, including age, male sex, body mass index (BMI), smoking status, DM, hypertension, previous CVD, hepatitis B virus (HBV) infection, hepatitis C virus (HCV) infection, HD duration, use of erythropoietin (EPO), KT/Vurea, nPCR, nonanuria status, hemoglobin levels, serum albumin levels, serum creatinine levels, corrected-calcium (C-Ca) levels, inorganic phosphate levels, log ferritin levels, log iPTH levels, log hsCRP levels, cholesterol levels, triglyceride levels, and environmental PM2.5 levels/the number of days with PM2.5 exceeding the standard level (variables with P<0.1 in the univariate linear regression were selected for multivariate linear regression). All the nominal variables in the logistic regression were transformed into dummy codes. Missing data were removed using listwise deletion. The level of significance was set at P<0.05.
Results
This study comprised a total of 921 patients on MHD (469 men and 452 women), with a mean MHD duration of 6.68±5.33 years. Moreover, PM2.5 data of 36 monitoring stations from the Taiwan Air Quality Monitoring Network, which is operated by the Environmental Protection Administration, including the database and report on the air quality status in the previous 12 and 24 months, were analyzed. Table 1 lists the patient characteristics including age, sex, and BMI, in addition to biological, hematological, and HD data. Of all the patients on HD, 50.9% were men, 22% had a medical history of DM, 4.6% had CVDs, 2.7% had lupus, 17.8% were habitual tobacco users, 80.2% had an arteriovenous fistula, 11.3% had HBV infection, 18% had HCV infection, 8.1% had high blood lead concentrations, 44.2% had high-normal blood lead concentrations, and 47.7% had low-normal blood lead concentrations. Patients who were exposed to higher PM2.5 concentration levels and more days with PM2.5 exceeding the standard level had a higher prevalence of high and high-normal BLL and lower prevalence of low-normal BLLs (Figures 2 and 3).
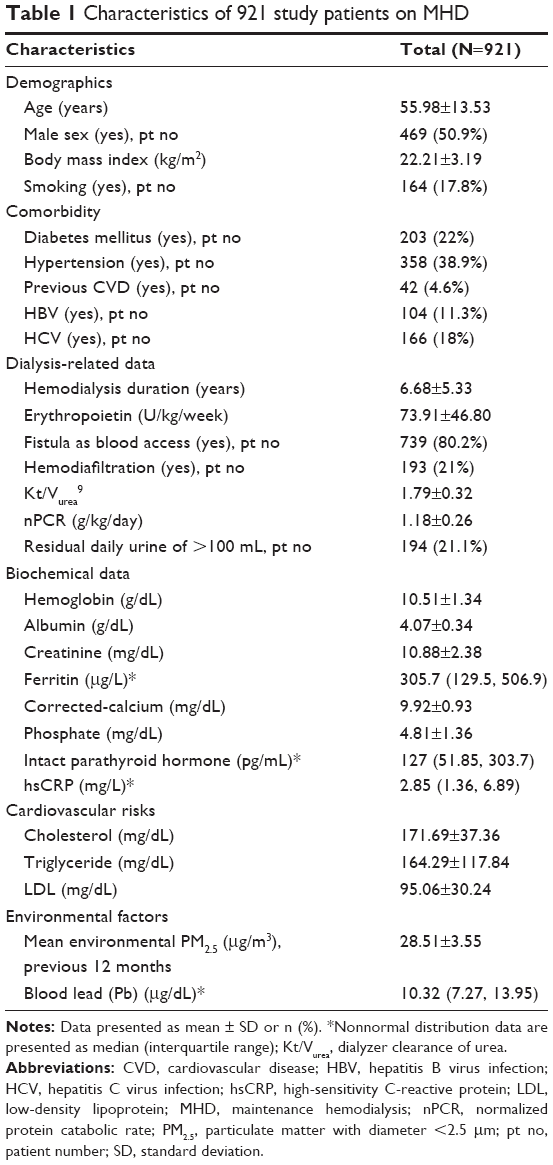 | Table 1 Characteristics of 921 study patients on MHD |
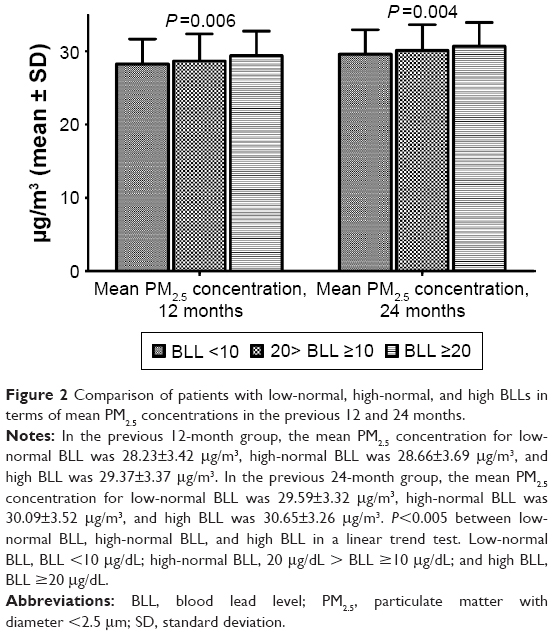 | Figure 2 Comparison of patients with low-normal, high-normal, and high BLLs in terms of mean PM2.5 concentrations in the previous 12 and 24 months. |
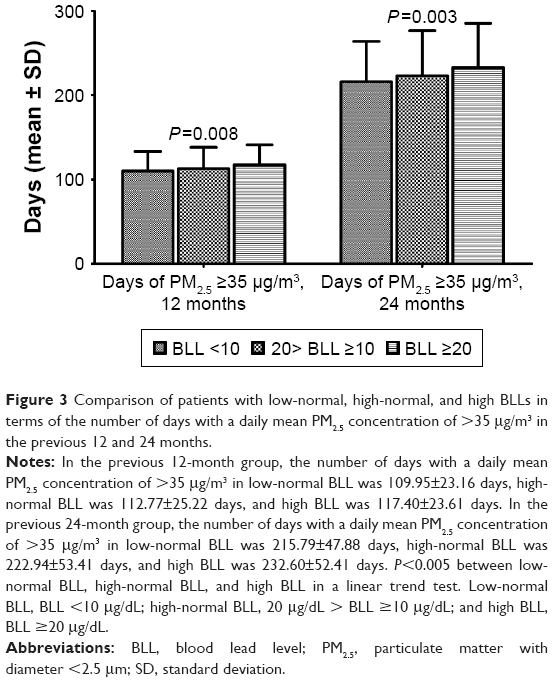 | Figure 3 Comparison of patients with low-normal, high-normal, and high BLLs in terms of the number of days with a daily mean PM2.5 concentration of >35 μg/m3 in the previous 12 and 24 months. |
To further clarify the factors associated with log lead levels in our study patients, we used univariate and multivariate linear regression “stepwise” methods for analyses. Table 2 presents the univariate linear regression analysis of the clinical variables on BLL. HCV (standardized coefficients [β]: 0.114, 95% CI [0.025, 0.089]), HD duration (β: 0.295, 95% CI [0.008, 0.013]), fistula as blood access (β: 0.069, 95% CI [0.002, 0.065]), HDF (β: 0.166, 95% CI [0.048, 0.109]), Kt/Vurea (β: 0.176, 95% CI [0.068, 0.145]), Hb level (β: 0.111, 95% CI [0.007, 0.025]), C-Ca level (β: 0.073, 95% CI [0.002, 0.029]), log iPTH (β: 0.161, 95% CI [0.031, 0.072]), and environmental PM2.5 concentration (β: 0.107, 95% CI [0.002, 0.009]) were positively associated with log BLLs. In contrast, BMI (β: 0.116, 95% CI [−0.011, −0.003]), DM (β: 0.236, 95% CI [−0.139, −0.081]), EPO use (β: 0.143, 95% CI [−0.148, −0.057]), log ferritin (β: 0.09, 95% CI [−0.062, −0.01]), and log hsCRP (β: 0.067, 95% CI [−0.05, −0.001]) were negatively associated with log BLLs.
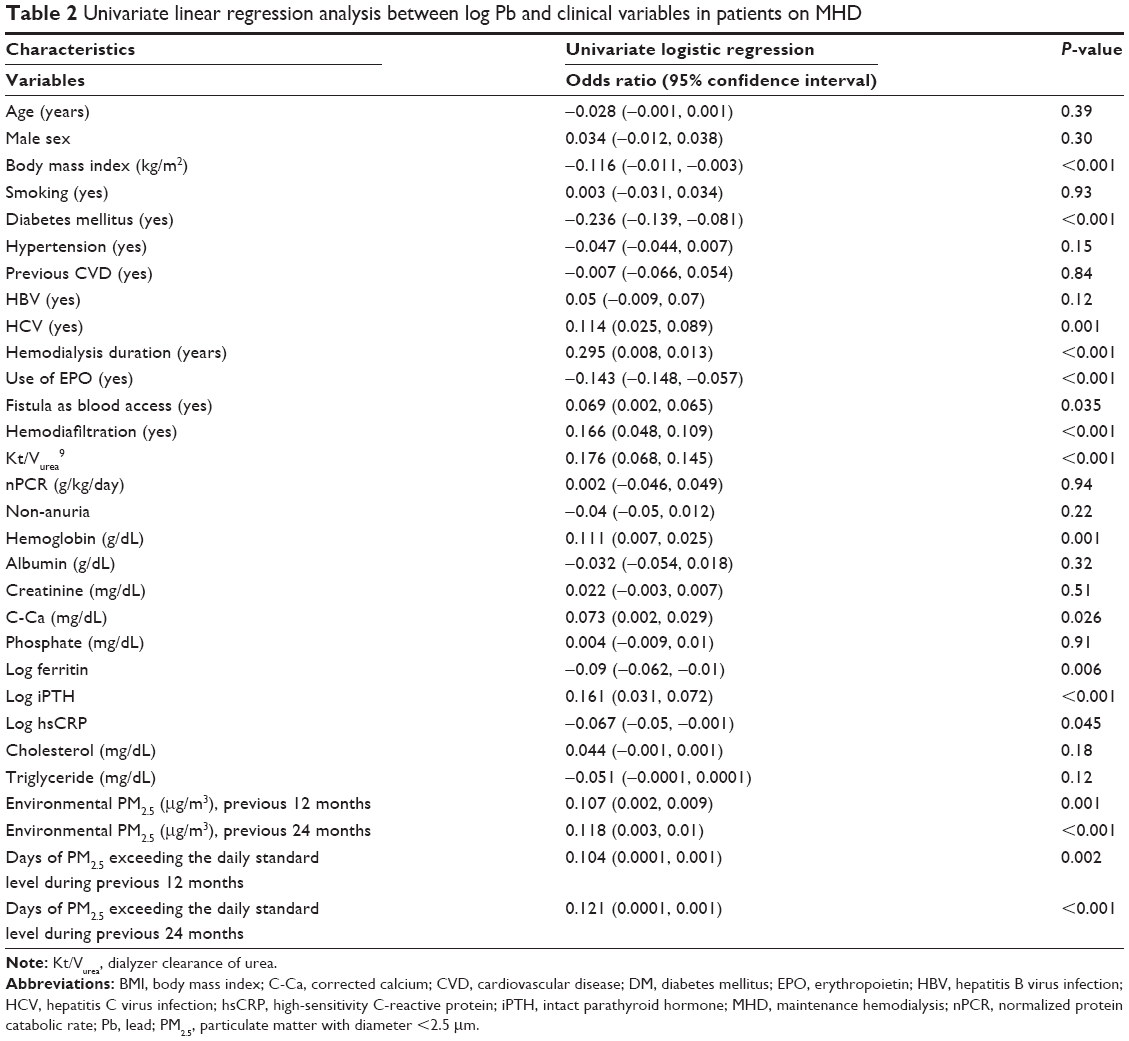 | Table 2 Univariate linear regression analysis between log Pb and clinical variables in patients on MHD |
An advanced multivariate linear regression analysis (Table 3) indicated that after adjustment for the studied variables, the mean PM2.5 concentration in the previous 12 months (β: 0.158, 95% CI [0.004, 0.013]) was significantly positively correlated with log BLLs. After adjustment for the studied variables, the number of days with PM2.5 exceeding the standard level in the previous 12 months (β: 0.087, 95% CI [0.0001, 0.001]) was positively associated with log BLLs (Table 4). We also observed that after adjustment for related factors, the mean environmental PM2.5 concentration (β: 0.191, 95% CI [0.006, 0.016]; Table 5) and the number of days with PM2.5 exceeding the standard level (β: 0.098, 95% CI [0.0001, 0.001]; Table 6) during the 24 months were positively associated with log BLLs.
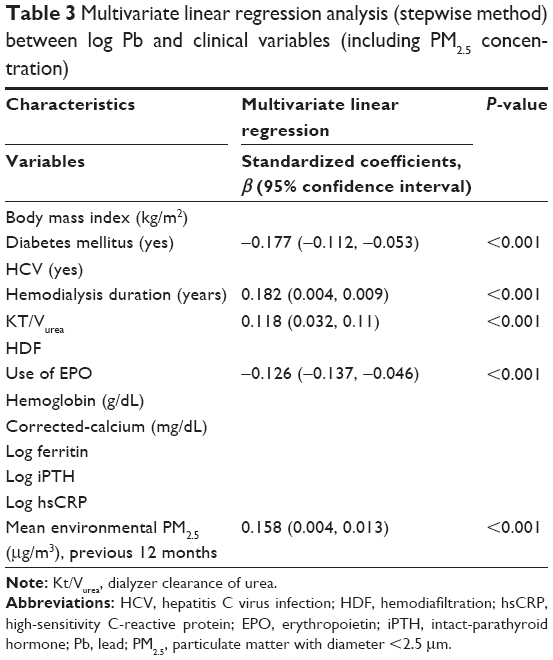 | Table 3 Multivariate linear regression analysis (stepwise method) between log Pb and clinical variables (including PM2.5 concentration) |
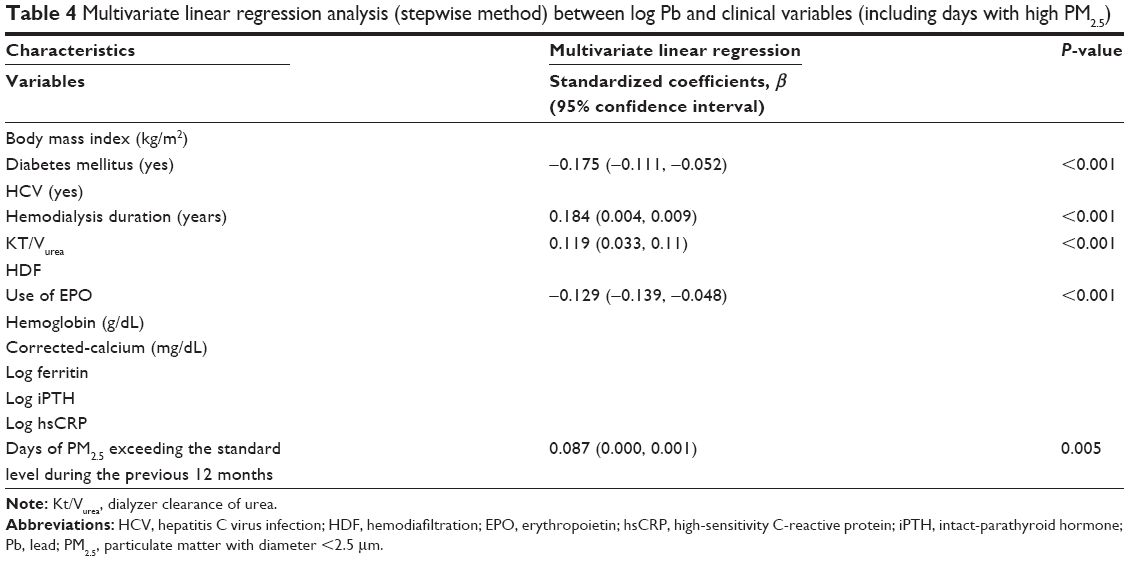 | Table 4 Multivariate linear regression analysis (stepwise method) between log Pb and clinical variables (including days with high PM2.5) |
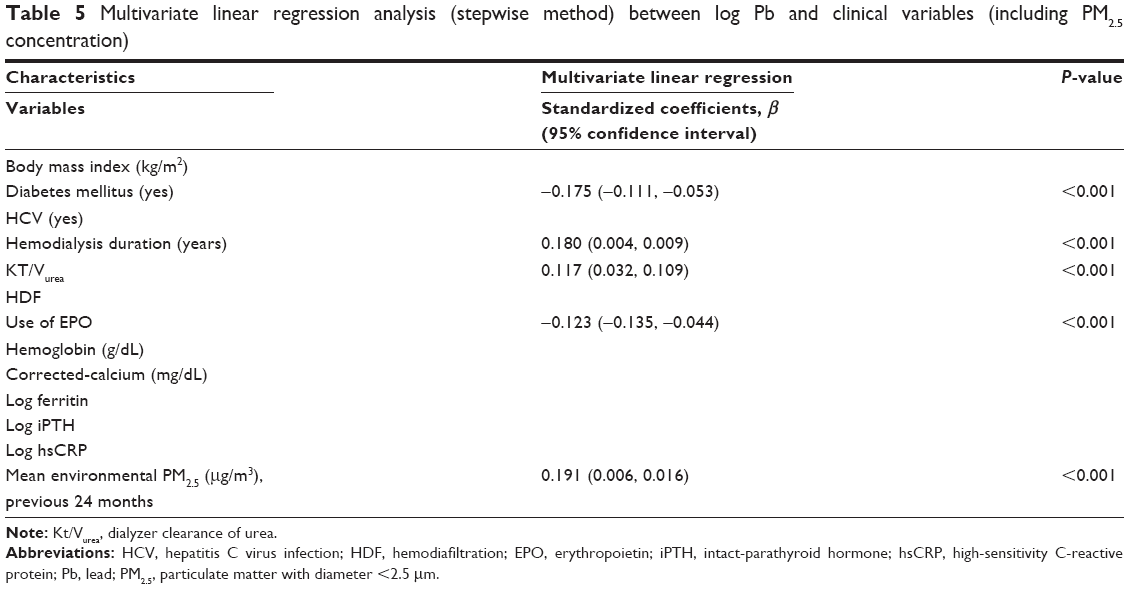 | Table 5 Multivariate linear regression analysis (stepwise method) between log Pb and clinical variables (including PM2.5 concentration) |
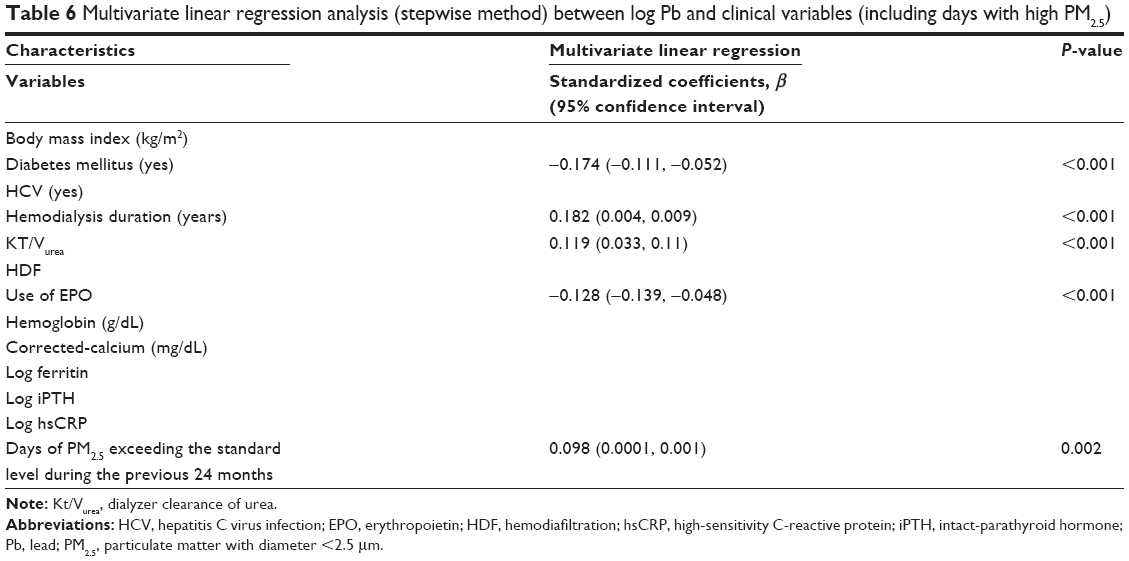 | Table 6 Multivariate linear regression analysis (stepwise method) between log Pb and clinical variables (including days with high PM2.5) |
Discussion
The results of this study demonstrate that after adjustment for related variables, BLLs exhibited a significantly positive association with environmental PM2.5 in patients on MHD.
In general, the sources of body lead include ingestion and inhalation.18 Educating individuals on the ingestion of lead and avoiding contact with lead-containing appliances should help reduce the BLLs in adults and children. In an analysis of the effect of air lead on BLLs, Hammond et al19 observed a curvilinear relationship between the level of lead in air and that of lead in blood. During 1976–1980, in the US, when the lead level in gasoline was reduced by >50%, the observed blood lead decreased, on average, by 37%.20 Coincidentally, Elinder et al21 reported that in Sweden, from 1980 to 1948, an average decrease in blood lead of ~34% was observed due to the decreased use of lead in gasoline. In addition, factors such as age, sex, and change in residence during the observation period did not influence the result.21 In Taiwan, the use of gasoline without lead had been implemented gradually since 1986 until 2000, when the use of lead-containing gasoline was completely banned. In a 2012 cross-sectional study of 934 children, Lin et al22 demonstrated that the average BLL in children was 1.86±1.55 μg/dL, which is lower than the upper limit value of 5 μg/dL recommended by the Centers for Disease Control, with only 16 children (1.8%) having BLLs exceeding 5 μg/dL and 2 children (0.21%) having BLLs exceeding 10 μg/dL. In addition, a study of 230 cord blood samples23 demonstrated that the average lead level was 1.14 μg/dL (range: 0.016–4.32 μg/dL). These results evidence that exposure to lead in Taiwan’s environment has improved.
Whether the effect of airborne lead on BLLs ceased after the use of unleaded gasoline warrants discussion. Recently, air pollution, particularly the PM2.5 type, has become the focus of considerable attention. Although the disadvantages of airborne PM2.5 are well known, this is the first study to investigate the effect of airborne PM2.5 on BLLs in patients on MHD. The composition of airborne PM2.5 is complex, and lead was found to be its main component.7 Of the sources of PM2.5 in Taiwan, 23% were vehicles and exposed dust, 22.7% were road transport, 13.5% were agriculture, 8.5% were catering, 7.2% were construction industry and mines, 4.5% were basic steel industries, 4% were electric power industries, 2.8% were chemical materials manufacturing, 2.3% were cement and ready-mixed concrete, and 11.4% were others.24 In Taiwan, secondary aerosols (NH4+, NO3−, and SO42−) constituted ~50%–60% of the chemical composition of PM2.5 mass.25 The mass percentage of lead in PM2.5 was different in different sources (~15% in industrial emissions, 0% in secondary aerosols, 7.5% in soil dust, 5% in sea salt, and 85% in vehicle emissions).26 Chen et al27 found that the lead component in PM2.5 mainly existed in an insoluble form, accounting for 78.9% of the total amount of lead, whereas water-soluble and liposoluble lead constituted 20.6% and 0.3% of the total amount of lead, respectively. In addition, the authors indicated that water-soluble lead, rather than insoluble lead, in PM2.5 may be a potential source of blood lead in adults. The results of these studies are consistent with our findings of the positive correlation between BLLs and PM2.5 concentrations or the duration of PM2.5 exceeding normal values. Several studies have clearly demonstrated the cardiovascular, pulmonary, carcinogenic, and mortality risks of airborne PM2.5.28–33 Moreover, BLLs have been related to iPTH levels, hemoglobin levels, blood pressure, and mortality in patients on MHD.1,4,34,35 Whether BLL is an intermediate medium between airborne PM2.5 and cardiovascular events or mortality in patients on MHD requires clarification in future studies.
The pharmacokinetics of lead in humans is complex. Most of the lead absorbed in the body is excreted through either renal clearance or biliary clearance in feces. Generally, in healthy people, significant drops in BLLs may occur over several months, or sometimes years, even after complete elimination of exposure to the lead sources.36 Blood lead is excreted in both the urine and feces in healthy individuals, and the dose of exposure could affect the excretion volume.37,38 However, in patients with renal failure, blood lead excretion is aggravated because of the loss of renal clearance. Therefore, patients on HD have significantly higher mean BLLs than healthy individuals.1–3 According to our review of the relevant literature, studies on particulate matter in terms of BLLs are limited. Enkhbat et al39 and Batterman et al40 have revealed no significant correlation between particulate matter concentrations and BLLs in children and middle-aged women. However, in a study involving nonhuman primates, O’Flaherty et al41 indicated that the urinary clearance of absorbed lead in these animals was 14%–24% of the estimated glomerular filtration rate and that fecal clearance was 78%–85% of the urinary clearance; however, fecal clearance was anomalous and appeared to be an artifact of a very high dose. Two studies37,41 have demonstrated the importance of blood lead excretion in urine. However, the participants in the studies of Enkhbat et al39 and Batterman et al40 were healthy without renal insufficiency or dialysis receipt, which suggests that both normal urinary and fecal excretion of blood lead can maintain stable BLLs during chronic exposure to environmental PM2.5. The loss of renal function in our study patients was possibly the reason for obtaining accumulative BLLs during the chronic exposure to environmental PM2.5 in our patients on HD.
A linear regression analysis revealed that within the previous 12 and 24 months, both the mean PM2.5 concentrations and the number of days with PM2.5 exceeding the standard level were positively correlated with BLLs in our study patients; this finding indicates the probability of chronic accumulation of blood lead from inspired PM2.5. In Figure 2, the mean concentration difference between the 3 groups did not exceed 35 μg/m3. However, Figure 3 illustrates that the higher the number of days exceeding the standard PM2.5 exposure level, the higher the BLLs. The odds ratio of the number of days with PM2.5 exceeding the standard level during 24 months (0.098) was higher than that during 12 months (0.087; Tables 4 and 6). Exposure is characterized by the magnitude, frequency, and duration of contact with an agent. Therefore, the number of days exceeding the standard value (≥35 μg/m3) is an important factor in our chronic PM2.5 exposure assessment.
This study has some limitations. First, data on whether there was a daily intake of lead through food were unavailable. However, in our dialysis centers, diet/nutrition education (including the importance of avoiding heavy metals) is routinely provided to patients. In addition, in our unpublished study, we found that deep-sea fish ingestion is not a factor for elevated BLLs in patients on HD. Second, the present study applied a cross-sectional design, and we determined only the correlation between environmental PM2.5 and BLLs and not the cause–effect relationship. However, we used the mean PM2.5 levels in the previous 12 and 24 months for our analysis of BLLs, which appears to be similar to a semicohort-designed study. Our study suggests that chronic environmental PM2.5 exposure might be associated with the accumulation of blood lead in patients on MHD who have lost the normal ability of urinary excretion of lead. Third, exposure misclassification could not be avoided, which indicates that we may have underestimated or overestimated the correlation between environmental PM2.5 and BLLs by using short-term air pollutant levels. To reduce the study error, we used the mean PM2.5 levels in the previous 12 and 24 months for analysis.
Conclusion
After adjustment for related factors, we found that chronic exposure to PM2.5 in living environments was positively associated with BLLs in patients on MHD. Therefore, the study findings suggest the existence of a possible correlation between environmental air quality and heavy metal levels in the blood of patients on MHD.
Acknowledgments
We thank the members of the Statistical Center of Chang Gung Memorial Hospital and Hemodialysis Center in Chang Gung Memorial Hospital for their invaluable and dedicated assistance. We also acknowledge Wallace Academic Editing for editing this manuscript. Wen-Hung Huang and Tzung-Hai Yen received research grants from Chang Gung Memorial Hospital, Linkou (CMRPG3D0323).
Author contributions
All authors contributed toward data analysis, drafting and critically revising the paper and agree to be accountable for all aspects of the work.
Disclosure
The authors report no conflicts of interest in this work.
References
Colleoni N, Arrigo G, Gandini E, Corigliano C, D’Amico G. Blood lead in hemodialysis patients. Am J Nephrol. 1993;13(3):198–202. | ||
Davenport A, Murcutt G, Whiting S. Cross-sectional audit of blood lead levels in regular outpatient haemodialysis patients dialysing in north London. Nephrology (Carlton). 2009;14(5):476–481. | ||
Lee SH, Huang JW, Hung KY, et al. Trace metals’ abnormalities in hemodialysis patients: relationship with medications. Artif Organs. 2000;24(11):841–844. | ||
Lin JL, Lin-Tan DT, Hsu CW, et al. Association of blood lead levels with mortality in patients on maintenance hemodialysis. Am J Med. 2011;124(4):350–358. | ||
Lin JL, Lin-Tan DT, Chen KH, et al. Blood lead levels association with 18-month all-cause mortality in patients with chronic peritoneal dialysis. Nephrol Dial Transplant. 2010;25(5):1627–1633. | ||
Sharma R, Pervez S. Enrichment and exposure of particulate lead in a traffic environment in India. Environ Geochem Health. 2003;25(3):297–306. | ||
Zereini F, Alt F, Messerschmidt J, et al. Concentration and distribution of heavy metals in urban airborne particulate matter in Frankfurt am Main, Germany. Environ Sci Technol. 2005;39(9):2983–2989. | ||
Lin JL, Lin-Tan DT, Yen TH, et al. Blood lead levels, malnutrition, inflammation, and mortality in patients with diabetes treated by long-term hemodialysis. Am J Kidney Dis. 2008;51(1):107–115. | ||
Daugirdas JT. The post: pre-dialysis plasma urea nitrogen ratio to estimate K.t/V and NPCR: mathematical modeling. Int J Artif Organs. 1989;12(7):411–419. | ||
Sargent JA. Control of dialysis by a single-pool urea model: the National Cooperative Dialysis Study. Kidney Int Suppl. 1983;13:S19–S25. | ||
Lin JL, Tan DT, Ho HH, Yu CC. Environmental lead exposure and urate excretion in the general population. Am J Med. 2002;113(7):563–568. | ||
Taiwan Air Quality Monitoring Network (TAQMN) [webpage on the Internet]. Taiwan Air Quality Monitoring Network (TAQMN) Operated by the Environmental Protection Administration (EPA 2016). 2016. Available from: http://taqm.epa.gov.tw/taqm/zh-tw/default.aspx. Accessed September 6, 2016. | ||
Huang WH, Lin JL, Lin-Tan DT, Chen KH, Hsu CW, Yen TH. Impact of living environment on 2-year mortality in elderly maintenance hemodialysis patients. PLoS One. 2013;8(9):e74358. | ||
Huang WH, Yen TH, Chan MJ, Su YJ. Environmental carbon monoxide level is associated with the level of high-sensitivity C-reactive protein in peritoneal dialysis patients. Medicine (Baltimore). 2014;93(26):e181. | ||
Huang WH, Yen TH, Chan MJ, Su YJ. Impact of environmental particulate matter and peritoneal dialysis-related infection in patients undergoing peritoneal dialysis. Medicine (Baltimore). 2014;93(25):e149. | ||
Lin JH, Yen TH, Weng CH, Huang WH. Environmental NO2 level is associated with 2-year mortality in patients undergoing peritoneal dialysis. Medicine (Baltimore). 2015;94(1):e368. | ||
Weng CH, Hu CC, Yen TH, Huang WH. Association between environmental particulate matter and arterial stiffness in patients undergoing hemodialysis. BMC Cardiovasc Disord. 2015;15:115. | ||
Barry PS. The current lead pollution problem. Postgrad Med J. 1975;51(601):783–787. | ||
Hammond PB, O’Flaherty EJ, Gartside PS. The impact of air-lead on blood-lead in man – a critique of the recent literature. Food Cosmet Toxicol. 1981;19(5):631–638. | ||
Annest JL, Pirkle JL, Makuc D, Neese JW, Bayse DD, Kovar MG. Chronological trend in blood lead levels between 1976 and 1980. N Engl J Med. 1983;308(23):1373–1377. | ||
Elinder CG, Friberg L, Lind B, Nilsson B, Svartengren M, Overmark I. Decreased blood lead levels in residents of Stockholm for the period 1980–1984. Scand J Work Environ Health. 1986;12(2):114–120. | ||
Lin YH, Lin CY, Wang IJ, Huang YH. Survey on blood lead levels of the preschool children in Taiwan, 2011. Taiwan J Public Health. 2012;31:285–298. | ||
Lin CC, Chen YC, Su FC, et al. In utero exposure to environmental lead and manganese and neurodevelopment at 2 years of age. Environ Res. 2013;123:52–57. | ||
Environmental Protection Administration [webpage on the Internet]. Environmental Protection Agency Announced all Kinds of Pollution Sources PM2.5 Operated by the Environmental Protection Administration (EPA 2015). 2015. Available from: http://enews.epa.gov.tw/enews/fact_Newsdetail.asp?InputTime=1040428103015. Accessed February 28, 2017. | ||
Lu HY, Lin SL, Mwangi JK, Wang LC, Lin HY. Characteristics and source apportionment of atmospheric PM2.5 at a coastal city in Southern Taiwan. Aerosol Air Qual Res. 2016;16:1022–1034. | ||
Gugamsetty B, Wei H, Liu CN, et al. Source characterization and apportionment of PM10, PM2.5 and PM0.1 by using positive matrix factorization. Aerosol Air Qual Res. 2012;12:476–491. | ||
Chen X, Wang XY, Liu Y, et al. Speciation analysis of lead and its isotopes in fine particulate matters in Beijing by ICP-MS. Guang Pu Xue Yu Guang Pu Fen Xi. 2009;29(2):515–518. | ||
Raaschou-Nielsen O, Andersen ZJ, Beelen R, et al. Air pollution and lung cancer incidence in 17 European cohorts: prospective analyses from the European Study of Cohorts for Air Pollution Effects (ESCAPE). Lancet Oncol. 2013;14(9):813–822. | ||
Cohen AJ, Ross Anderson H, Ostro B, et al. The global burden of disease due to outdoor air pollution. J Toxicol Environ Health A. 2005;68(13–14):1301–1307. | ||
Pope CA 3rd, Burnett RT, Thun MJ, et al. Lung cancer, cardiopulmonary mortality, and long-term exposure to fine particulate air pollution. JAMA. 2002;287(9):1132–1141. | ||
Cesaroni G, Forastiere F, Stafoggia M, et al. Long term exposure to ambient air pollution and incidence of acute coronary events: prospective cohort study and meta-analysis in 11 European cohorts from the ESCAPE Project. BMJ. 2014;348:f7412. | ||
Nawrot TS, Perez L, Kunzli N, Munters E, Nemery B. Public health importance of triggers of myocardial infarction: a comparative risk assessment. Lancet. 2011;377(9767):732–740. | ||
Laden F, Schwartz J, Speizer FE, Dockery DW. Reduction in fine particulate air pollution and mortality: extended follow-up of the Harvard Six Cities Study. Am J Respir Crit Care Med. 2006;173(6):667–672. | ||
Krachler M, Wirnsberger GH. Long-term changes of plasma trace element concentrations in chronic hemodialysis patients. Blood Purif. 2000;18(2):138–143. | ||
Kessler M, Durand PY, Huu TC, et al. Mobilization of lead from bone in end-stage renal failure patients with secondary hyperparathyroidism. Nephrol Dial Transplant. 1999;14(11):2731–2733. | ||
Christopher P, Holstege M [webpage on the Internet]. Pathophysiology and Etiology of Lead Toxicity. 2016. Available from: http://emedicine.medscape.com/article/2060369-overview. Accessed May, 2016. | ||
Millet H. The excretion of lead in urine. J Biol Chem. 1929;83:265–268. | ||
Kehoe RA, Thamann F. The excretion of lead. JAMA. 1929;92:1418–1421. | ||
Enkhbat U, Rule AM, Resnick C, Ochir C, Olkhanud P, Williams DL. Exposure to PM2.5 and blood lead level in two populations in Ulaanbaatar, Mongolia. Int J Environ Res Public Health. 2016;13(2):214. | ||
Batterman S, Su FC, Jia C, Naidoo RN, Robins T, Naik I. Manganese and lead in children’s blood and airborne particulate matter in Durban, South Africa. Sci Total Environ. 2011;409(6):1058–1068. | ||
O’Flaherty EJ, Inskip MJ, Yagminas AP, Franklin CA. Plasma and blood lead concentrations, lead absorption, and lead excretion in nonhuman primates. Toxicol Appl Pharmacol. 1996;138(1):121–130. |
 © 2017 The Author(s). This work is published and licensed by Dove Medical Press Limited. The
full terms of this license are available at https://www.dovepress.com/terms
and incorporate the Creative Commons Attribution
- Non Commercial (unported, 3.0) License.
By accessing the work you hereby accept the Terms. Non-commercial uses of the work are permitted
without any further permission from Dove Medical Press Limited, provided the work is properly
attributed. For permission for commercial use of this work, please see paragraphs 4.2 and 5 of our Terms.
© 2017 The Author(s). This work is published and licensed by Dove Medical Press Limited. The
full terms of this license are available at https://www.dovepress.com/terms
and incorporate the Creative Commons Attribution
- Non Commercial (unported, 3.0) License.
By accessing the work you hereby accept the Terms. Non-commercial uses of the work are permitted
without any further permission from Dove Medical Press Limited, provided the work is properly
attributed. For permission for commercial use of this work, please see paragraphs 4.2 and 5 of our Terms.