Back to Journals » Eye and Brain » Volume 13
Portable Diagnostic System for Age-Related Macular Degeneration Screening Using Visual Evoked Potentials
Authors Versek C ![]() , Banijamali SMA, Bex P, Lashkari K, Kamarthi S, Sridhar S
, Banijamali SMA, Bex P, Lashkari K, Kamarthi S, Sridhar S
Received 5 December 2020
Accepted for publication 4 March 2021
Published 29 April 2021 Volume 2021:13 Pages 111—127
DOI https://doi.org/10.2147/EB.S295745
Checked for plagiarism Yes
Review by Single anonymous peer review
Peer reviewer comments 2
Editor who approved publication: Professor Margaret Wong-Riley
Craig Versek,1 S Mohammad Ali Banijamali,2 Peter Bex,3 Kameran Lashkari,4 Sagar Kamarthi,2 Srinivas Sridhar1,5,6
1NeuroFieldz Inc, Newton, MA, USA; 2Department of Mechanical and Industrial Engineering, Northeastern University, Boston, MA, USA; 3Department of Psychology, Northeastern University, Boston, MA, USA; 4Department of Bioengineering, University of Massachusetts Dartmouth, Dartmouth, MA, USA; 5Departments of Physics, Bioengineering, and Chemical Engineering, Northeastern University, Boston, MA, USA; 6Division of Radiation Oncology, Harvard Medical School, Boston, MA, USA
Correspondence: Srinivas Sridhar
Department of Physics, Northeastern University, 110 Forsyth St., 111 Dana Research Center, Boston, MA, 02115, USA
Email [email protected]
Background: Delayed Dark-Adapted vision Recovery (DAR) is a biomarker for Age-related Macular Degeneration (AMD), however its measurement is burdensome for patients and examiners.
Methods: In this study, we developed a portable, wireless and user-friendly system that employs a headset with a smartphone to deliver controlled photo-bleach and monocular pattern reversal stimuli, while using custom electroencephalography (EEG) electrodes and electronics in order to measure Dark-Adapted Visual Evoked Potentials (DAVEP) objectively and separately at the peripheral and central visual field. This is achieved in one comfortable 20-minute session, without requiring subject reporting. DAVEP responses post photo-bleach for up to 15 minutes were measured concurrently from both eyes in 12 AMD-patients, 1 degenerative myopia patient, and 8 controls who had no diagnosed macular vision loss.
Results: Robust positive polarity DAVEP responses were observed at 200– 500 ms from stimulus onset to scotopic stimuli that have been seldom reported and analyzed previously. The amplitude recovery of the DAVEP response was significantly delayed in AMD patients as compared to controls. We developed DAVEP1 scores, a simple metric for DAR, which classified 90% of subject eyes correctly, indicating the presence of AMD in at least one eye of all pre-confirmed subjects with this diagnosis.
Conclusion: We developed a user-friendly, portable VEP system and DAVEP1 metric, which show a high potential to identify DAR-deficits in AMD-patients. This novel technology could aid in early diagnosis of AMD.
Keywords: age-related macular degeneration, EEG, visual evoked potential, dark adaptation recovery, scotopic vision, portable diagnostics
Introduction
Age-related macular degeneration (AMD) causes progressive loss of central vision and is the leading cause of irreversible blindness in the developed world.1 Based on population sampling results from the landmark Age-Related Eye Disease Study (AREDS),2 some forecast estimates of intermediate to advanced AMD cases (mostly undiagnosed) in the US place the figure between 11 million3 to 14 million4 individuals in the year 2020. AMD causes vision loss in the central retinal area used for high-resolution vision (the fovea and its surrounding macula), with a relative sparing of peripheral vision. Central vision loss affects the quality of life and performance of daily activities such as reading,5 face recognition,6 mobility,7 watching television,8 and it is associated with elevated levels of depression9 and increased mortality.10
A major challenge in the development of effective treatments for AMD is the lack of sensitive, practical visual function endpoints11,12 that can be easily measured. People with AMD manifest delayed Dark Adaptation Recovery (DAR),13–16 even in the early stages of the disease,17 and DAR delays become longer with the disease progression.18–20 DAR is therefore an early biomarker for AMD and is an FDA-approved method for diagnosing AMD.21 Measurement of DAR typically utilizes a flash illumination that bleaches rod and cone photoreceptors and the subsequent response recovery serves as a measure of the stress response of retinal metabolism.22,23 DAR is adversely affected by choroidal thinning,24 morphological changes in retinal pigment epithelial cells,25 and the accumulation of subretinal drusenoid deposits (SDDs)26–28 in AMD. Current DAR tests typically measure psychophysical thresholds for the detection of visual stimuli following bleaching in order to monitor the recovery of sensitivity over time, typically over more than 20 minutes (for review see29). Such long DAR testing times are problematic for behavioral testing, especially when both eyes are to be tested. Although rapid (10 minute) protocols have been developed,30 these protocols test a single retinal location which may be useful for the classification of AMD patients and control subjects, but they require active participation of the subject. There is, therefore, an unmet need for a practical, sensitive test that will provide objective, quantitative endpoints for early diagnosis and for monitoring the patient’s response to newly developed treatments.
Visual evoked potentials (VEPs) generated in response to visual stimuli – typically measured with non-invasive electrodes contacting the scalp over the occipital cortical regions – provide a quantitative, objective measure of the neuro-optical pathways and visual processes that are correlated with behavioral measures of sensitivity31,32 but do not require active participation (other than fixation) from the patient. Multi-focal Electroretinogram (ERG) methods – typically requiring eye-contacting electrodes – have shown deficits in AMD33 that are correlated with structural defects.34,35 Recently, full-field ERG protocols have been developed and tested using healthy expert subjects to achieve DAR measurement with sensitivity close to psychophysical methods.36–38 While there have been many studies of VEP in the context of DA (without photo-bleach recovery),39–42 and the use of multifocal VEP has been studied in the context of AMD,43–45 we believe that systematic use of this very attractive technique has been hampered by lack of easy-to-administer, affordable instrumentation, and we have not found any previous VEP studies of DAR in AMD, specifically, in the literature.
We have developed a portable, wireless system called NeuroDotVR (illustrated in Figure 1) that enables us to measure DAR using an objective paradigm based on transient Visual Evoked Potentials (VEP) to pattern reversal stimuli (persisting for 500 ms), which we refer to as Dark Adapted VEP (DAVEP). In this study, we first establish the transition of the photopic (cone photoreceptor-mediated) VEP signal into the scotopic (rod photoreceptor-mediated) response regime, in normally-sighted subjects; wherein, stimulus luminance was stepped from photopic (32 cd/m2), through mesopic, down to scotopic levels (10−3 cd/m2). Then, we evaluate the recovery of the DAVEP response post photo-bleach (400 cd/m2 for 60 s) over 15 minutes, using a constant scotopic luminance stimulus (5×10⁻⁴ cd/m2) in normally sighted control subjects, patients with AMD, and a few patients with diagnoses other than AMD. We developed stimuli to test both eyes, monocularly, in two sub-regions of the visual field, “central” (2.6–16° eccentricity) and “peripheral” (16–33°), independently during the same experimental session. These visual field regions were chosen to provide comparative measures of central (parafoveal macular) and peripheral DAR, because an influential study13 (which is confirmed in our results below) showed, using psychophysical detection thresholds, that AMD patients often exhibit a weak macular response and normal or less impaired peripheral response; furthermore, DAR tests involving solely full-field stimuli can fail to differentiate between the responses of early AMD patients and those of age-matched controls.46 We, therefore, hypothesized that a comparison between these regional responses might provide a robust signal of the disease state in AMD, one that corrects for individual differences in baseline amplitude.
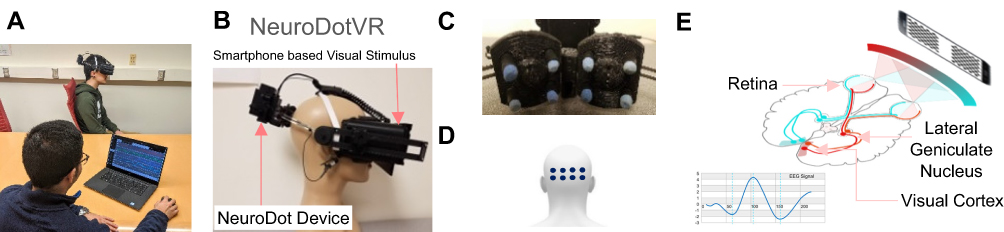 |
Figure 1 Portable wireless NeuroDotVR system. (A) Operator testing a subject, (B) NeuroDotVR device prototype integrating NeuroDot sensor with visual stimulus headset, (C) Close-up of NeuroDot EEG sensor arrays, (D) Location of electrodes on the scalp over the visual cortex, (E) Human visual pathway and typical photopic visual evoked response measured on occipital scalp, using binocular contrast reversing checkerboard stimulus. Miquel Perello Nieto, CC BY-SA 4.0 <https://creativecommons.org/licenses/by-sa/4.0>, via Wikimedia Commons.68 Abbreviation: EEG, electroencephalography. |
Materials and Methods
Our DAVEP paradigm makes use of NeuroDotVR, which combines scalp neuroelectric potential sensors with a smartphone in a portable wireless headset (Figure 1). The system records VEPs in response to dichoptic stimuli presented on the smartphone OLED screen, which displays persistent images updated at a maximum rate of 60 frames per second.47
Neuroelectric Sensing
Each NeuroDot sensor array comprises 4 small-diameter (< 8mm) biopotential electrode pins arranged in a grid with a small spacing of 2 cm (considered to be “ultra” or “very” high-density48). The NeuroDotVR system (Figure 1A–C) uses two independently positionable sensor arrays, yielding 8 independent channels of EEG data which, in this study, have been averaged in neighboring groups of 4 electrodes to simulate the three contiguous standard 10–20 System scalp locations O1, Oz, O2 where the central location, Oz, uses the rightmost two channels of the left array and the leftmost two of the right array. Each of the sensor pins connects to its own amplifier channel, which amplifies the potential difference between it and a separate reference electrode, which is clipped to the lobe of the left ear of the subject. The average potential of the symmetric array (with respect to the remote reference)  , is analogous to a single EEG channel at the center of the array, albeit with lower noise. To further simplify the analysis in this study, we take the average over both arrays as the final EEG signal, equivalent to the average over all 8 channels.
The recordings for each EEG channel are sampled at a rate of 1000 samples per second, with a resolution of 24 bits, and a gain factor of 24, and the data is saved, unfiltered, in a binary file format. Before subsequent data processing, each channel is prefiltered using a Stationary Wavelet Transform (SWT) baseline removal49 with an effective cutoff frequency of 0.5 Hz; we find that this process preserves the time domain characteristics of EEG stimulus responses while greatly reducing small motion artifacts and electrode polarization artifacts that might otherwise create longer duration transient distortions (impulse/step response of filter) using standard digital filtering techniques. Any additional filtering steps will be described in the “Results” sections below.
Head Mount
Using 3D printing technologies and off-the-shelf hardware, we fabricated a purpose-built headset that is compatible with the Google Daydream VR platform. Our custom design targets full light-tightness, minimal light leakage between apertures, and incorporates mounting mechanisms for the electrode sensor arrays. The headset also features a concealed mount for a phototransistor sensor that is used for accurate timing of stimulus onset and reversal. A custom foam padding was molded for comfortable use using silicone replica casting from a 3D printed model.
Visual Stimuli
Pattern reversal dartboard (polar checkerboard geometry) “test” stimuli were applied as probes of DAR over 15 minutes after exposure to a 400 cd/m2, 60 s white “photo-bleach” stimulus. The display device was the OLED screen on the Google Pixel 2 XL smartphone, used with a custom VR head-mounted-display having optics that approximate those of the Google VR Daydream View (first version, 2016). On OLED displays, the black pixels emit no light, so the contrast is effectively close to the maximum that subjects can perceive, assuming minimal reflected light in the viewer. The stimuli patterns were generated as high-resolution pixel maps (2048x2048) using custom Python programs, then were loaded into a custom app using the Google VR Android SDK with OpenGLES2 texture rendering. The dartboard (see Figure 2) was divided into two regions: the central region, labeled “Macular Annulus” (MA), including all of the macula but excluding the fovea (2.6–16° eccentricity); and the near peripheral region, labeled “Peripheral Annulus” (PA, 16–33° eccentricity) of each eye. The annular dartboard patterns scale radially according to the rule of cortical magnification,50 where each check radial length R at eccentricity E (in degrees of visual angle) scales by a factor of R(E)/R(0) = 0.27E +1, and the base check size R(0) = 1° of visual field subtended. The stimuli were solid green-colored (wavelength 528 ± 30 nm, single channel on RGB display, closest to the rod photoreceptor sensitivity centroid of 498 nm), although they appear virtually colorless at scotopic intensity levels. The foveal region of 0–2.6° was excluded to minimize the contribution of cone photoreceptors which have the highest density here. The choice of extending the MA region to 16° eccentricity beyond the physiologically defined macula at 6° was made to ensure that a roughly equitable amount of rod photoreceptors would be stimulated in each region (rod density increases from zero just outside the fovea to a peak at 18°, but falls off more slowly in the periphery51). A neutral density filter of 8 stops (log base 2 units) was inserted immediately after the completion of the photo-bleach to achieve scotopic luminance of around 10−3 cd/m2 which was not possible using only the native display range; this stimulus level was chosen in the upper scotopic regime to limit the expected response amplitude recovery times for normal subjects below the 15 min experiment durations (see next section). A mid-mesopic intensity red fixation cross, spanning the foveal region, and a thin ring at 10° eccentricity were overlaid on the stimuli to help subjects, especially those with central vision loss, maintain fixation at the center.
 |
Figure 2 The test stimuli for the DAVEP paradigm consist of a log polar dartboard pattern which is divided into the “Macular Annulus” (MA, 2.6–16° ecc.) and “Peripheral Annulus” (PA, 16–33° ecc.) visual field regions whose check pattern reverses independently. Stimuli are presented monocularly (to each eye with the opposite eye in complete darkness): after an unmeasured “onset” period of 1.0s, the pattern reverses 3 times for each visual field region with a step of 0.5–0.6 s (randomized); the sequence lasts about 5.4 s before switching to the other eye. See the text for an exact description of the sequence. Abbreviations: DAVEP, dark-adapted visual evoked potential; ecc., eccentricity. |
DAVEP Recovery Paradigm
In the DAVEP recovery paradigm, following the photo-bleaching stimulus, a continual series of scotopic luminance level test pattern reversals is presented according to the fixed sequence, where S is the starting image (1.0 s onset, not measured), and M and P are macular and peripheral region reversals, respectively (at an interval of 0.5 s plus a random jitter from 0 to 0.1 s): S, M, P, M, P, P, M, P, M. The stimuli are presented monocularly, such that this sequence is cycled between the left L, then the right R eye – lasting ~5.4 s in each eye, where the opposite eye is in complete darkness. The NeuroDotVR system records accurate start of video frame events using a phototransistor detector to monitor a hidden patch of the screen used exclusively for sending this synchronous signal. These stimulus event markers are used in subsequent data processing steps to average the neuroelectric responses at the precise start time of these stimulus presentations. Epochs are defined from the start of the stimuli up to 600 ms (by when the response is expected to have already decayed below the noise floor) and grouped separately by L or R eye and M or P region (S stimuli onsets are not processed). The average over the LM, LP, RM, or RP trials is performed in a centered sliding window that includes 121 trials (containing responses spread over a period of ~3.6 min), with a step size of 7 trials (~15 s) creating a smoothed response profile over the course of the experiment (see 3D wireframe plots in). Using an unsupervised machine learning outlier rejection algorithm (Scikit-Learn’s “Isolation Forest” model52), trials with outlier variances (typically arising from movement artifacts) are excluded from the windowed average – normally only a small percentage (up to 10%).
Subject Pool
All studies were approved by the Northeastern University Institutional Review Board (protocol #17-09-01) and were performed in accordance with the Declaration of Helsinki. All subjects were either referred by their clinical ophthalmologist or were recruited from personal contacts at Northeastern University. Subjects were required to be at least 18 years old and had to sign an informed consent document after their role in the study was explained. Gender was not used as a condition for selection.
Because of the VR capabilities of our display system, we required subjects to fill out a simulator sickness questionnaire; however, the static nature of our stimuli was not expected to induce motion sickness symptoms, and this was borne out in the results (see the section “Subject Tolerance” below). Four of the authors served as control subjects (CV, SMAB, PB, and SS), who have extensive experience participating in EEG and/or psychophysical vision testing paradigms.
The monocular DAVEP recovery experiments were tested in:
- (13 x 2) = 26 eyes with AMD. The AMD subjects age range was 71 to 89;
- (5 x 2) + (3 x 1) = 13 normal eyes. The age range was 21 to 73;
- (3 x 1) = 3 eyes with other conditions. The age range in this group was 51 to 73.
(See Table 2 at the end of the “Results and Discussion“ section for a detailed overview of subject characteristics.)Table 1
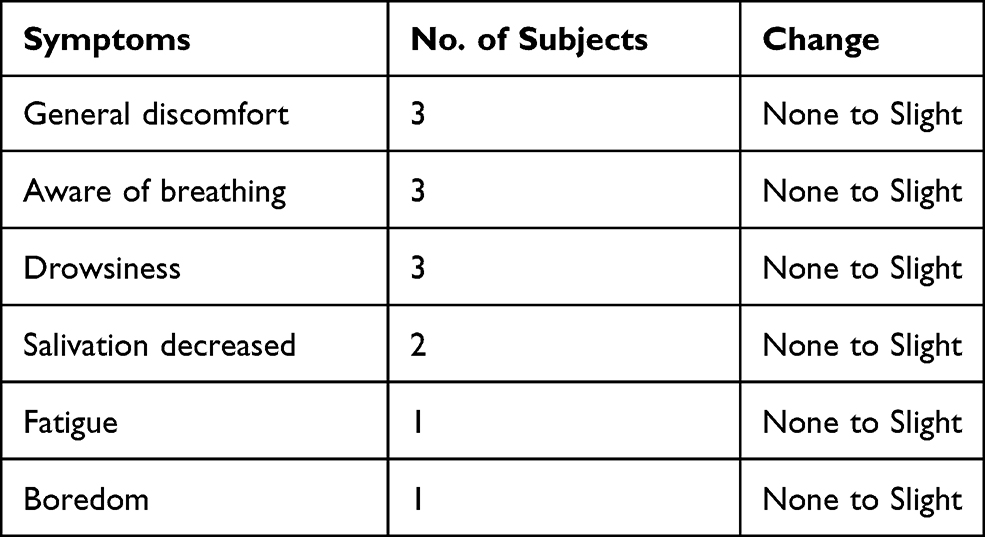 |
Table 1 Assessment of Symptoms of Adverse Events During Testing |
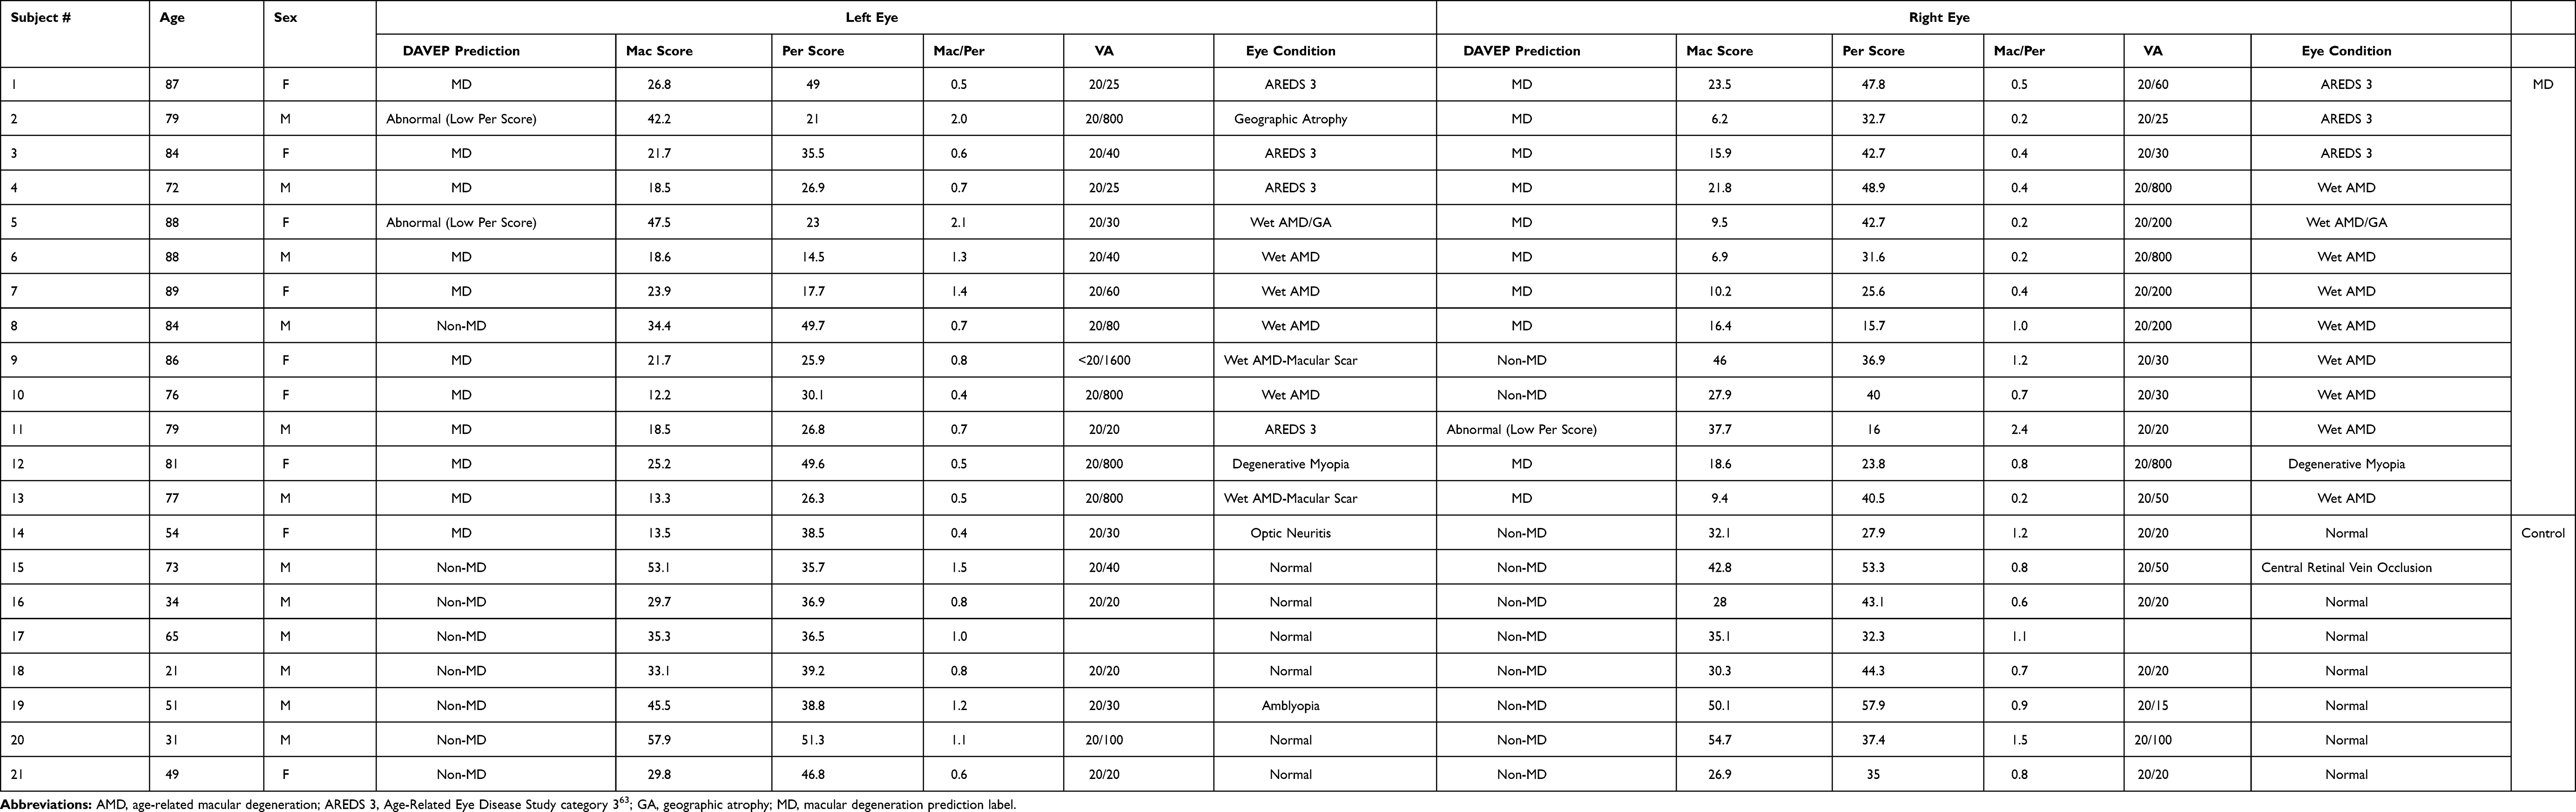 |
Table 2 Details of DAVEP1 Scores Among Subjects |
Test Administration
Most clinical subjects were new to EEG/VEP, but were instructed to minimize body movements, eye closures, and talking during the recording; however, they were explicitly permitted to blink and to shift posture as needed for comfort. No drugs for pupil dilation were administered and no artificial restricted pupils were used for any of the reported tests. After fitting the head-mounted display and neuroelectric sensors to the subject, the experimenters applied a skin-safe saline electrolyte with gentle swabbing directly to the area around the electrode/scalp contact, while monitoring impedances of the EEG sensing channels and ensuring that they were below 100 kOhms – which we have previously shown to be adequate for high-quality measurements using the NeuroDot system.53 No abrasive preparation compounds nor conductive pastes or gels were applied to the scalp. Any bulky jewelry or headwear that could interfere with electrodes or the mounting hardware was removed prior to experimentation. Subjects were asked to remove any spectacles, which is not typical for photopic VEP experiments, but we had previously determined that the DAVEP stimuli-responses are largely unaffected by corrective eyewear. The tests were minimally discomforting but demanded subject alertness for an extended time (about 15 min) in the presence of repetitive visual displays at low light levels; subject boredom and microsleeps were, therefore, a concern, so we encouraged subjects to listen to their favorite music or a podcast for the duration of testing.
Fixation Compliance
Adequate central fixation on the stimuli by subjects is a concern for restricted eccentricity pattern VEP paradigms such as DAVEP, especially for highly impaired AMD patients with central vision loss: as described in the section “Visual Stimuli”, we provide an extended fixation target at 10° eccentricity to increase visibility; additionally, response metrics are based on averages of many trials (121), so the effects of temporary, infrequent loss of fixation are mitigated. In this early iteration of the device hardware, we had no method to monitor subject fixation compliance; however, we have made plans for in situ eye-tracking in futures studies. Below, in the section “DAVEP1 Score Classification,” we discuss possible fixation non-compliance related results in the context of eyes classified in the auxiliary “abnormal” response category.
Results and Discussion
Subject Tolerance
There were no adverse events during testing. To monitor subject tolerance to the test, we administered a simulator sickness questionnaire that is a modified version of the Pensacola Motion Sickness Questionnaire54 (provided by Prof. Yingzi Lin of the Department of Mechanical & Industrial Engineering at Northeastern University). The form consisted of 24 questions with a 4-point rating scale (none/slight/moderate/severe), before and after the test. For most of the questions and most of the subjects, there were no changes attributable to the test. We have listed in below only the subset of those symptoms that did differ at the end of the test, which shows that it was generally well-tolerated.
VEP Stimulus Luminance Regimes
To better understand the relationship between the lower photopic, mesopic, and upper scotopic level responses to our green dartboard stimuli, we undertook a pilot study that stepped down luminance (by −0.5 log units every 2.5 minutes) over the range from 32 to 0.001 cd/m2 over the course of 25 minutes on two normally-sighted subjects (authors CV and SMAB), who have experience sitting for long VEP paradigms. Subjects had preadapted to dark conditions for at least 30 mins before recording. The MA and PA visual field regions were tested alternately in only the left eye at an interval of 1.0–1.1 seconds (randomized). EEG signals were processed with the 0.5 Hz cutoff baseline removal (high-pass) filter described in “Methods – Neuroelectric Sensing” and further filtered with a 30 Hz cutoff Bessel low-pass Infinite Impulse Response (IIR) digital filter. An epoch length of 600 ms post pattern reversal event was chosen for analyzing and displaying VEP signals since we observed no measurable changes after this period. A sliding window of 61 trials with a step size of 3 trials was used to create a smoothed VEP amplitude over the time course of the experiment by averaging epochs for the same visual field location. The data from the macular and peripheral regions of one normally sighted subject is shown in Figure 3.
 |
Figure 3 (A) The heatmap plots show VEP response amplitude for one normal observer in MA (top) and PA (bottom) visual field regions using a color scale over the range ± 9 microvolts, where vertical axis shows time (latency) after the start of the stimulus trial (up to 600 ms) and the horizontal axis spans the duration of the experiment (25 minutes) with the log brightness scale at the bottom. The following plots show the luminance dependence of the amplitude of the (B) positive peak near 100 ms, P1 (C) and the positive peak near 300 ms, P3 or P3DA (see text). For all plots, the dashed lines approximately separate the stimulus intensities, from left to right, into regimes of active photoreceptors: “photopic” (only cones), “mesopic” (cones and rods), and “scotopic” (only rods). Abbreviations: VEP, visual evoked potential; MA, macular annulus; PA, peripheral annulus. |
From these studies we drew the following conclusions: (1) the typical P1 response (positive peak at approximately 100 ms) seen in many photopic VEP paradigms, but here only obvious for the cone-rich macular region, decreases rapidly over the mesopic luminance range (where both cones and rods are active, 0 to −2 log units) and is not present in the scotopic response (where only rods are active, below −2 log units); note that the photopic response may have been further reduced from standard levels by the exclusion of the foveal region from stimulation and the use of monochromatic green pixels; (2) the positive peaks in the range 200–300 ms, seen at the initial photopic stimulus levels (often referred to as P2 & P3 or just P30055,56), decrease even more rapidly; in its place, a new positive component (or set of components) around 200–300ms, here labeled P2DA & P3DA (superscripts denotes appearance under dark-adapted conditions) emerges in the mid-mesopic regime and persists down to scotopic levels (−0.5 to −3 log units) but shifts to later latencies by approximately 100 ms or more around our DAVEP testing luminance (5×10⁻⁴ cd/m2) (see Figure 4 for a schematic description of VEP peak labels); the peripheral P2DA & P3DA response is similar to that of the macular, but arguably a bit simpler and less contaminated by Alpha waves (see next point); (3) in some subjects, low amplitude residual noise peaks in the Alpha band (8–12Hz) are visible but are not strongly time-locked to the stimulus presentation; this Alpha band contamination has been noted in previous scotopic level VEP studies40 – care must be taken to avoid false-positive response measurements where Alpha band amplitudes may dominate even after time-locked stimulus averaging.
 |
Figure 4 Schematic of the typical VEP components seen in this study for dartboard pattern reversal stimuli in normally sighted subjects. Photopic luminance stimuli responses typically feature components N1 (~75 ms), P1 (~100 ms), N2 (~150 ms), P2 (~225 ms, not always present/distinct), P3 (centered around 250–275 ms). At scotopic levels, under dark adaptation (DA), the largest amplitude components are labeled P2DA (around 275ms, narrower, not always present/distinct, varies by subject) and P3DA (centered around 350–400 ms, broader, more reliably detected across subjects). Abbreviations: VEP, visual evoked potential; N, negative going peak; P positive going peak. |
Previous studies of scotopic full-field flash VEPs39,41,57 contain analyses of positive peaks with latencies around 200 ms but ignore the lower amplitude positive peaks around 300ms; however, we caution against a direct comparison since those stimulus types are much different than our restricted eccentricity pattern reversal VEPs. The closest match to our stimulus conditions in the literature,58 scotopic pattern-reversal in restricted central and near peripheral visual fields, is presented as a brief study on VEP scalp distribution in normal subjects; we note here a similarity between this previous literature study’s “Figure 3“ (right side) and our study’s P3DA responses. Kubová et al42 investigate the transition from photopic to scotopic conditions by comparison of checkerboard pattern reversal and motion onset VEPs, showing the disappearance of N1 and P1 components with the persistence of N2 components as well as noting the occurrence of P2 and P3 components at scotopic stimulus levels; their rather interesting interpretation is that the persistent N2 in scotopic pattern VEP is consistent with a weakly stimulated motion onset response – given that inputs from the parvocellular pathway are decreasing more rapidly than those from the magnocellular pathways as luminance decreases. Since we have used pattern VEP in our study, we have not extensively analyzed the weak N2 component, which is seen in some subjects, rather we focus on the more robust P2DA & P3DA response; however, Kubová et al suggest that carefully designed motion onset VEP stimuli may lead to higher amplitude scotopic responses, especially in the peripheral visual field – which may be a future avenue of exploration using the DAVEP system.
We tentatively interpret our results to mean that while the typical photopic VEP peak amplitudes are highly sensitive to diminishing cone photoreceptor input and, possibly, to suppressive rod-cone interactions,59–61 the emergent P2DA & P3DA response serves as a marker of cognitive visual awareness under lower mesopic and scotopic conditions; therefore, this response is contingent on rod photoreceptor stimulation and subsequent pathway latencies, but the amplitude is relatively insensitive to stimulus luminance under full DA, at least in this tested range. Given the high latency and stable amplitude, this VEP signal might be related to higher-level cortical processing than the assumed early V1 cortex source of the photopic P1, possibly in the same class as other P300 event-related potentials (ERPs) such as that which is manipulated under “visual odd-ball” paradigms.62 Our further results focus on these scotopic P2DA & P3DA components (and, potentially, a complex of positive and negative response components between latencies of 175–450 ms, seen in other subject data) as a marker for DA recovery after photo-bleach (adaptation to bright conditions) in normal subjects and AMD patients.
DAVEP Recovery
Subjects previewed the stimuli at a mesopic luminance level for approximately 2 mins, followed by a 60 s 400 cd/m2 white photo-bleach conditioning (covering the full tested visual field); then, subsequently, the stimulus was switched to a scotopic luminance level (5×10⁻⁴ cd/m2), while recording their neuroelectric responses – principally the amplitude of P2DA & P3DA components described above – for 15 minutes. The EEG signals were processed to derive stimulus time locked DAVEP signals separately for each eye and each visual field region. The 8 EEG channels were first prefiltered using a Stationary Wavelet Transform (SWT) baseline removal49 with an effective cutoff frequency of 0.5 Hz; we find that this process greatly reduces small motion artifacts and electrode polarization artifacts while preserving the principle shape of the VEP time-domain signal. Alpha band activity, which may cause false-positive signal, was present in many subject’s DAVEP responses, especially immediately after the photo-bleach; since the P2DA & P3DA response components have relatively lower frequency content (is more slowly varying), we designed an SWT low-pass filter with a sharp cutoff at 7Hz, right below the Alpha band. Although such drastic filtering may highly smooth the time domain shape of the DAVEP, the recovery metric that we are using in this study (see the section below) is mostly an integrated measure of amplitude within a broad response time window (175–450 ms), so it would be only marginally distorted. Finally, the 8 channels were averaged together and a sliding window of 121 trials (containing responses spread over a period of ~3.6 min) with a step size of 7 trials (~15 s) was used to create a smoothed VEP amplitude over the course of the experiment by averaging epochs (excepting those marked as containing outlier variance artifacts, see section “Methods: DAVEP Recovery Paradigm”) for the same eye/visual field location. The same data processing steps were applied to all subjects using a custom fully automated software framework based on the Scientific Python library ecosystem (https://www.scipy.org/about.html); although, the artifact epoch rejection step is adaptively computed based on a subject’s global trial statistics.
The VEP response over the DA recovery period from the two visual field regions of one normally sighted control subject and one AMD subject is shown in Figure 5. From the aggregate DAVEP data of all subjects, we drew the following conclusions: typically, (1) the recovery of the P2DA & P3DA response components is rapid for a healthy subject in both the macular and peripheral regions, while little to no recovery can be seen, specifically, in the macular region of the AMD subjects; (2) there is a noticeable difference between the macular and peripheral response of most AMD subjects, with the MA amplitudes being weaker and recovering later than the PA (which was often indistinguishable from a normal response).Figure 5
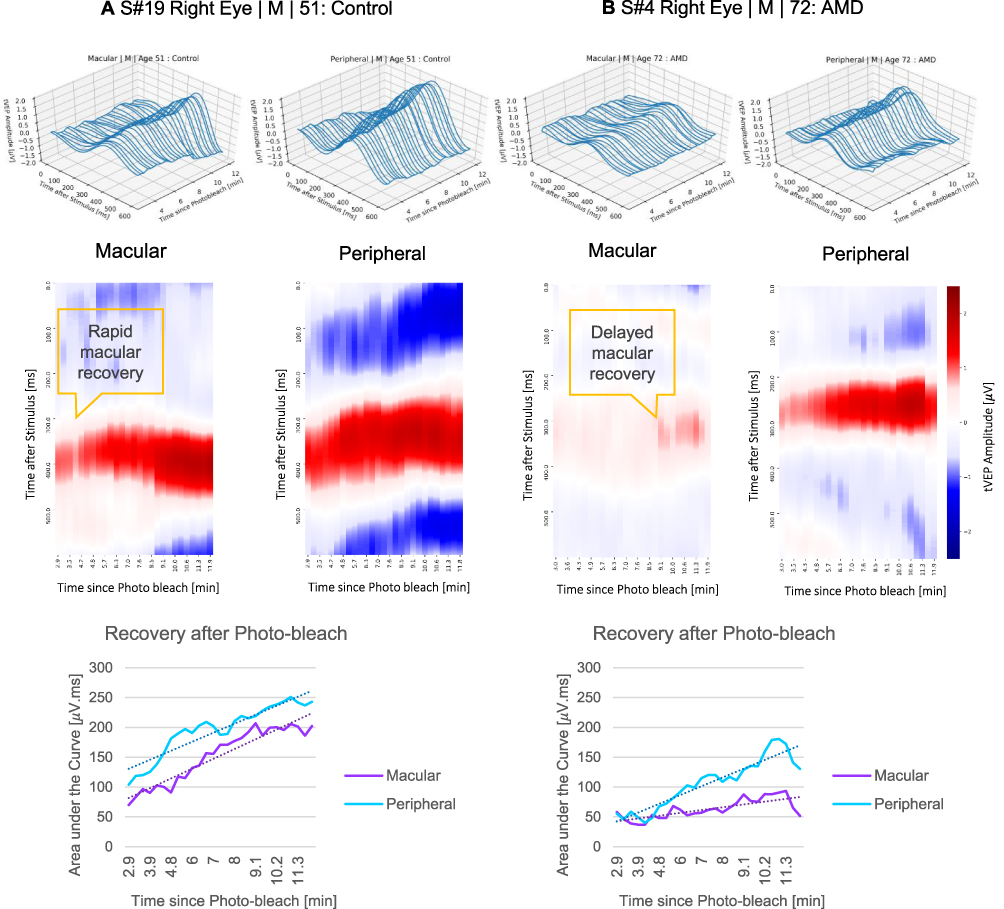 |
Figure 5 The plots show the recovery of dark-adapted vision for the right eye of (A) Control subject, and (B) AMD subject in the macular and peripheral regions. The 3D wireframe plots (top row) show the windowed DAVEP response wave (X axis is time after stimulus start in ms and Z axis is the amplitude in microvolts) as it recovers following the initial photo-bleach condition (minutes along Y axis). Note that, in the heatmap plots (middle row), the vertical axis shows the response wave latency (in ms after stimulus start), the color axis shows the response polarity and amplitude (in microvolts), and the horizontal axis shows the time passed after the photo-bleach (in minutes). The bottom row displays the area under the curve (µV·ms) for the component between 175 to 450 (ms) on the Y axis vs the time passed after the photo-bleach (minutes). Abbreviations: AMD, age-related macular degeneration; DAVEP, dark-adapted visual evoked potential. |
The exact characteristics of this emergent response under dark adaption are presently not well understood: some subjects show only an early narrower peak centered around 275 ms, distinguished by the label P2DA, many show a broader peak between 300–400 ms, labeled as P3DA; some show a mixture of responses that may even change with the subject’s state of arousal or with the time post photo-bleach and may do so differently between the two tested visual field regions, MA & PA; some, especially AMD subjects, show a greatly diminished response particularly in the MA visual field region but may have a normal level response in the PA region.
DAVEP1 Score Computation
We developed a metric that objectively characterizes DAR using the DAVEP signal response over the finite 15 minutes post photo-bleach time course. At each time window over the trials, a K-means clustering algorithm52 is used to dynamically find the center of the prominent response cluster (within the latency range of 175–450 ms) and extract the amplitudes spanning latencies in the “response window” within ± 75 ms of the center. This automated response analysis is similar to the choices an expert technician might make. These responses are then used to compute the “DAVEP1 score” across the recovery time period: in order to correct for substantial variations in DAVEP response amplitude across subjects, the amplitude values of each visual field region and each eye are normalized within the subject by the maximum value obtained across all locations; then, the score is calculated as the spectral norm for the matrix containing these smoothed, normalized amplitudes within the response window:


The score is indicative of the continuity and normalized intensity of the responses obtained in that location – ie, an early recovery with a sustained amplitude close to 1.0 maximizes the score. The ratio of the macular to the peripheral score is also calculated for each eye, which emphasizes the functional disparity between these visual field regions – lower than 0.6 is potentially indicative of macular functional loss when the peripheral score is in the normal range.
Subject Groups and DAVEP1 Score Results
Our study (see Table 2) includes 8 patient eyes with “dry AMD” (diagnosis AREDS 363 or non-wet GA), 14 patient eyes with “wet AMD” (having abnormal/leaky vasculature in the macula64), and 2 patient eyes (same subject) with “degenerative myopia”65 which is a rarer form of non-age-related macular degeneration with similar functional manifestations to AMD; for the purpose of classification of DAR results, we will refer to the total group of these conditions as having the true label of “MD” (Macular Degeneration). In the control group, for the purpose of DAR classification, there are 16 eyes considered having the true label “non-MD”. Excluding the 3 “abnormal” test results (see “DAVEP1 Score Classification” below for definition), the mean and standard deviation of macular DAVEP1 scores from the “dry AMD” group is 19 ± 6, the “wet AMD” group is 20 ± 11, the group of two “degenerative myopia” eyes is 22 ± 3, and the control group is 37 ± 12. The mean and standard deviation of peripheral DAVEP1 scores, for the respective groups, are 37 ± 9, 32 ± 12, 37 ± 13, and 40 ± 8. All MD subgroups have similar low macular score averages that are significantly distinct from the normal group, though the standard deviation in “wet AMD” group scores is the highest. Average peripheral scores are only slightly lower between MD patient and control groups, with the lowest being the “wet AMD” subgroup. Since wet AMD could either be a progression of dry AMD or a separate diagnosis, the lower peripheral scores and higher variances of both scores of this subgroup may be reflective of this distinction - we will refrain from drawing further conclusions due to the small sample sizes and lack of additional diagnostic data involved in this preliminary study.
DAVEP1 Score Classification
We outline a simple algorithm using DAVEP1 scores to classify subjects, predicting “MD” (Macular Degeneration) or “non-MD” labels. Based on the available data (see Table 2 and Figure 6), we found that macular scores below 25 (red area in the plot) can serve as a singular indication for the “MD” label, and scores of above 30 (green area in the plot) indicate the “non-MD” label. Macular scores between 25 and 30 put the classification into the “watch” region (yellow area in the plot), where a closer look at the data is necessary: if the ratio of macular to peripheral score in this region is lower than 0.6 the “MD” label is predicted. Finally, the algorithm marks an eye with a peripheral score below 25 and a macular score above 30 as “abnormal” (gray area of the plot); these “abnormal” results are withheld from classification – possibly due to other confounding vision issues or, perhaps, problems with fixation during the test. For example, it is common for advanced AMD patients to use a preferred retinal locus (PRL)66 in the peripheral field for reading and other tasks. It is recommended to examine the heatmap plots of the responses and, if available, other diagnostics such as acuity to make a more detailed justification in these cases.
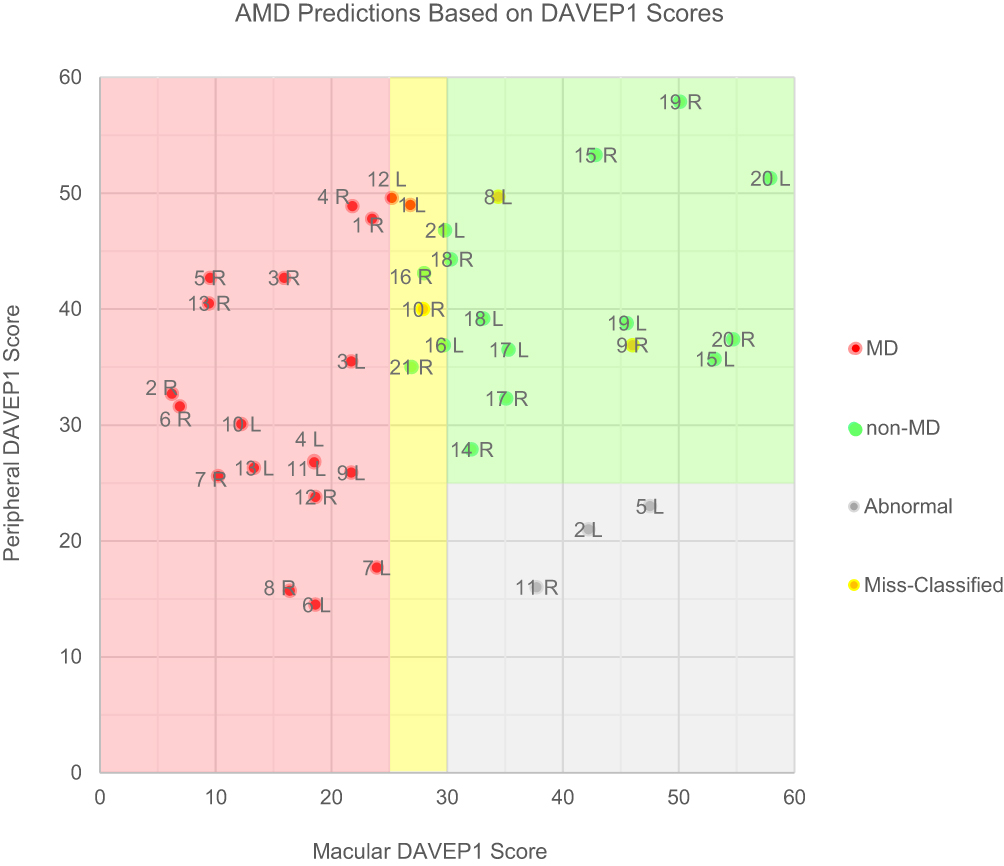 |
Figure 6 This chart shows the distribution of the macular vs peripheral DAVEP1 scores and classifications for all subject eyes (each point’s label shows the subject number and L/R marks left/right eyes, refer to Table 2 for further details). The plot is divided into four colored regions: (red) denotes low macular scores where the eye is classified to the “MD” (Macular Degeneration) group; (green) denotes high macular and peripheral scores, where the eye is classified as “non-MD”; (yellow) marks the “watch” region where a macular to peripheral DAVEP1 score ratio of < 0.6 indicates “MD”; (gray) marks “abnormal” response region, where the eyes have low peripheral and high macular scores. |
Using the above algorithm, the DAVEP1 score successfully classified 90% (36/40) of subject eyes. Macular Degeneration (MD, includes “dry AMD”, “wet AMD”, and “degenerative myopia”) was correctly classified in 87% (20/23) of eyes, with 13% (3/23) false-negative results – 3 other eyes have been withheld from classification because of “abnormal” performance as described above. In all 3 false-negative cases, the misclassification was for the eye with higher visual acuity and MD was correctly predicted in the patient’s weaker eye. Likewise, in the 3 “abnormal” cases, the fellow eye was classified as MD positive. Therefore, the algorithm correctly classified the presence of MD in at least one eye of 100% of subjects in the MD patient group. 94% of eyes (15/16) of control subjects were correctly classified, with 6% (1/16) false-positives. The single false-positive result happened in the case of a patient with optic neuritis and cortical age-related cataract, but no MD.
The use of a peripheral PRL to view all stimuli may, conceivably, have led to the “abnormal” inversion of peripheral and macular scores detected in our study. One of the AMD patients (#5) who received an “abnormal” result in one eye (the one with higher visual acuity), claimed to have not seen the stimuli (including the brighter, static fixation aids) at all, even though a strong response was detected; these factors may be indicative of visual suppression.67 Under the monocular conditions of our experiment, both eyes are left open while the un-stimulated eye is kept in darkness until it is stimulated in-turn (switching approximately every 5 seconds) – this suggests, perhaps, that a follow-up assessing just the responding eye in complete isolation may be helpful. Another of the “abnormal” results was from a subject (#11) that, despite having an AMD diagnosis, had 20/20 visual acuity in both eyes and was noted to have been pupil-dilated in a clinical check-up immediately before participating in our study; it is conceivable that a peripheral PRL, especially in a dilated eye, could cause a large false response to be attributed to macular region trials which were assumed to be fixated at the center. In future developments of DAVEP paradigms, the integration of eye-tracking cameras might help to disambiguate abnormal results and further improve classification results across the board through rejection of poorly fixated trials.
While DAVEP1 scores can be used to classify most subjects reliably, they are not a complete representation of the data recorded within the DAVEP Recovery paradigm. For example, each time window is given equal weight, even though early windows are more informative for predicting healthy function and later windows are more informative for assessing the degree of DAR impairment. When subjects do show early recovery, there is typically a phase of monotonic amplitude increase which may be followed by a lull in response amplitudes, possibly due to higher-order cognitive adaptation to the repetitive signal (perhaps hinting at the potential brain sources of the P2DA & P3DA complex in later visual cortices or in parietal lobes). On the contrary, for subjects who have significant delays in DAR, the earliest epochs contain only noise which may contribute false signal to the DAVEP1 score (this is the main reason why we chose to filter out all frequencies at and above the Alpha band, a major noise source in many subjects). Furthermore, for simplicity in assessing the paradigm, only the responses for the average of the 8 spatially distributed EEG channels (covering scalp locations O1, Oz, O2) were analyzed. While this spatially averaged montage reduces noise and is appropriate since the EEG potentials are largely homogenous over these locations, this data reduction strategy does not take full advantage of the neuroelectric information contained in the recordings.
The DAVEP1 scoring algorithm yields a first-order approach to AMD patient classification which is expected to generalize reasonably well to patients of unknown disease status. However, much more information can be extracted from the existing DAVEP Recovery paradigm recordings, specifically regarding: the time-order dependence of recovering VEP signal properties; the spatial distribution of EEG signal variations over the covered O1, Oz, O2 scalp locations; and the change in other spectral characteristics, such as Alpha band power. As the feature sets over the signals expand, the manual analysis of their interdependencies becomes increasingly infeasible. We see the future potential of more automated machine learning approaches to our data analysis tasks and for other complex electrophysiology paradigms.
Conclusions
The results of this study confirm that using VEP during DA Recovery for AMD symptom testing, implemented on the portable NeuroDotVR platform, is well-tolerated and can be successfully deployed in a busy clinic on naïve patients with various levels of visual impairment. The DAVEP test, during which the subject can listen to audio entertainment, is comfortable. The DAVEP test paradigm is completely objective and does not require the subject to respond. This technique can measure DAR at 2 locations in 2 eyes in 15 minutes or less, unlike the existing psychophysical tests for DAR based diagnostics which require active subject participation and test only individual eyes in a single location.
This study has investigated some aspects of VEP under dark adaptation that have rarely been reported. The intensity-dependent data clearly show the disappearance of the commonly observed N1, P1 complex for latencies < 200 ms at scotopic luminance levels, and, more surprisingly, the emergence (or persistence) of robust components with higher latency. We have found only one passing mention in the literature42 of a response component similar to the one we have here labeled P3DA, though peaks in this range are often visible in scotopic VEP study data and we note the similarities to the cognitive P300 response seen in many ERP paradigms (mainly high latency and amplitude robustness to stimulus luminance changes). Although its source remains to be identified, we have shown that the P2DA & P3DA response complex can serve as a robust, objective biomarker of visual awareness under DA.
Our results show that, following photo-bleach conditioning (photopic brightness adaptation), the initially suppressed responses for healthy subjects gain amplitude rapidly (typically peaking by 8 min or sooner) but may show a moderate slowing down of recovery with age; in the cases of AMD subjects, the DAR is significantly delayed to later times after the photo-bleach in the macular annular region, and in some cases in the peripheral annular region as well but to a lesser extent.
We developed a simple metric for DAR, called the DAVEP1 score, which combines information from the signal recovery amplitudes and times. Using these scores for both the macular and peripheral visual field regions, we successfully identified MD in at least one eye of all the pre-confirmed MD subjects and classified 90% of all subject eyes correctly; however, due to the limited resources of this preliminary study, control subjects were not age-matched to the range of MD patients, so diagnostic validity has yet to be confirmed in older populations. The DAVEP1 metric is a new objective biomarker for AMD that identifies deficits in DAR, which – given further refinement and validation – may show promise for future clinical diagnostics and drug-trial monitoring. Further studies are suggested to validate the DAVEP approach in a larger cohort of subjects including age-matched controls, test-retest repeatability trials, fixation compliance monitoring, and the use of more-refined AMD patient group staging to stratify test results according to disease severity.
Acknowledgments
Thanks to Dr. Elias Reichel of Tufts Medical Center for invaluable discussions on AMD symptomology.
Funding
This work was supported by the National Institutes of Health grants HHS-1R41AG057250-01 (https://www.sbir.gov/sbirsearch/detail/1321411) and 2R44AG057250-02A1 (National Institute on Aging, https://reporter.nih.gov/project-details/10081830). The funders had no role in study design, data collection, analysis, decision to publish, or preparation of the manuscript.
Disclosure
CV Research Support, NeuroFieldz Inc, Newton, MA. Patent US20190307350A1 pending, Northeastern University. Grants from NIH, during the conduct of the study. PB Research Support, NeuroFieldz Inc, Newton, MA. Patent US20190307350A1 pending, Northeastern University. SS Research Support, NeuroFieldz Inc, Newton, MA. Patents US20190307350A1 pending, PCT 10,912,480, Northeastern University. Founder, Director, NeuroFieldz Inc. The authors report no other conflicts of interest in this work.
References
1. Vitale S, Cotch MF, Sperduto RD. Prevalence of visual impairment in the United States. JAMA. 2006;295(18):2158. doi:10.1001/jama.295.18.2158
2. Bressler NM, Bressler SB, Congdon NG, et al. Potential public health impact of Age-Related Eye Disease Study results: AREDS report no. 11. Arch Ophthalmol. 2003;121(11):1621-1624. doi:10.1001/archophthalmol.121.11.1621
3. Rein DB, Wittenborn JS, Zhang X, et al. Forecasting age-related macular degeneration through the year 2050: the potential impact of new treatments. Arch Ophthalmol. 2009;127(4):533–540. doi:10.1001/archophthalmol.2009.58
4. Neely DC, Bray KJ, Huisingh CE, Clark ME, McGwin G, Owsley C. Prevalence of Undiagnosed Age-Related Macular Degeneration in Primary Eye Care. JAMA Ophthalmol. 2017;135(6):570. doi:10.1001/jamaophthalmol.2017.0830
5. Legge GE, Rubin GS, Pelli DG, Schleske MM. Psychophysics of reading—II. Low vision. Vision Res. 1985;25(2):253–265. doi:10.1016/0042-6989(85)90118-X
6. Peli E, Lee E, Trempe CL, Buzney S. Image enhancement for the visually impaired: the effects of enhancement on face recognition. J Opt Soc Am A. 1994;11(7):1929–1939. doi:10.1364/JOSAA.11.001929
7. Lovie-Kitchin JE, Mainstone JC, Robinson J, Brown B. What areas of the visual field are important for mobility in low vision patients. Clin Vision Sci. 1990;5(3):249–263.
8. Wolffsohn JS, Cochrane AL. The changing face of the visually impaired: the Kooyong low vision clinic’s past, present, and future. Optom Vis Sci. 1999;76(11):747–754. doi:10.1097/00006324-199911000-00023
9. Brody BL, Gamst AC, Williams RA, et al. Depression, visual acuity, comorbidity, and disability associated with age-related macular degeneration. Ophthalmology. 2001;108(10):1893–1900. doi:10.1016/S0161-6420(01)00754-0
10. Zheng DD, Christ SL, Lam BL, Arheart KL, Galor A, Lee DJ. Increased mortality risk among the visually impaired: the roles of mental well-being and preventive care practices. Invest Ophthalmol Vis Sci. 2012;53(6):2685–2692. doi:10.1167/iovs.11-8794
11. Lesmes LA, Jackson ML, Bex P. Visual function endpoints to enable dry AMD clinical trials. Drug Discov Today Ther Strateg. 2013;10(1):e43–e50. doi:10.1016/j.ddstr.2012.11.002
12. Owsley C, Clark ME, McGwin G. Natural history of rod-mediated dark adaptation over 2 years in intermediate age-related macular degeneration. Transl Vis Sci Technol. 2017;6:3. doi:10.1167/tvst.6.3.15
13. Owsley C, Jackson GR, Cideciyan AV, et al. Psychophysical evidence for rod vulnerability in age-related macular degeneration. Invest Ophthalmol Vis Sci. 2000;41(1):267–273.
14. Steinmetz RL, Haimovici R, Jubb C, Fitzke FW, Bird AC. Symptomatic abnormalities of dark adaptation in patients with age-related Bruch’s membrane change. Br J Ophthalmol. 1993;77(9):549–554. doi:10.1136/bjo.77.9.549
15. Dimitrov PN, Robman LD, Varsamidis M, et al. Relationship between clinical macular changes and retinal function in age-related macular degeneration. Invest Ophthalmol Vis Sci. 2012;53(9):5213–5220. doi:10.1167/iovs.11-8958
16. Dimitrov PN, Guymer RH, Zele AJ, Anderson AJ, Vingrys AJ. Measuring rod and cone dynamics in age-related maculopathy. Invest Ophthalmol Vis Sci. 2008;49(1):55–65. doi:10.1167/iovs.06-1048
17. Owsley C, Jackson GR, White M, Feist R, Edwards D. Delays in rod-mediated dark adaptation in early age-related maculopathy. Ophthalmology. 2001;108(7):1196–1202. doi:10.1016/S0161-6420(01)00580-2
18. Owsley C, McGwin G, Jackson GR, Kallies K, Clark M. Cone- and rod-mediated dark adaptation impairment in age-related maculopathy. Ophthalmology. 2007;114(9):1728–1735. doi:10.1016/j.ophtha.2006.12.023
19. Flamendorf J, Agrón E, Wong W, et al. Impairments in dark adaptation are associated with age-related macular degeneration severity and reticular pseudodrusen. Ophthalmology. 2015;122(10):2053–2062. doi:10.1016/j.ophtha.2015.06.023
20. Jackson GR, Scott IU, Kim IK, Quillen DA, Iannaccone A, Edwards JG. Diagnostic sensitivity and specificity of dark adaptometry for detection of age-related macular degeneration. Invest Ophthalmol Vis Sci. 2014;55(3):1427–1431. doi:10.1167/iovs.13-13745
21. Csaky K, Ferris F, Chew EY, Nair P, Cheetham JK, Duncan JL. Report from the NEI/FDA endpoints workshop on age-related macular degeneration and inherited retinal diseases. Invest Ophthalmol Vis Sci. 2018;58(9):3456–3463. doi:10.1167/iovs.17-22339
22. Lamb TD, Pugh EN. Dark adaptation and the retinoid cycle of vision. Prog Retin Eye Res. 2004;23(3):307–380. doi:10.1016/j.preteyeres.2004.03.001
23. Loughman J, Hewitt C, Judge C, Martin L, Moulds C, Davison PA. Clinical applicability of the Macular Degeneration Detection Device (MDD-2): a novel photostress recovery measurement device. Clin Exp Optometry. 2013;96(3):272–277. doi:10.1111/j.1444-0938.2012.00813.x
24. Sigler EJ, Randolph JC. Comparison of macular choroidal thickness among patients older than age 65 with early atrophic age-related macular degeneration and normals. Invest Ophthalmol Vis Sci. 2013;54(9):6307–6313. doi:10.1167/iovs.13-12653
25. Ach T, Tolstik E, Messinger JD, Zarubina AV, Heintzmann R, Curcio CA. Lipofuscin redistribution and loss accompanied by cytoskeletal stress in retinal pigment epithelium of eyes with age-related macular degeneration. Invest Ophthalmol Vis Sci. 2015;56(5):3242–3252. doi:10.1167/iovs.14-16274
26. Smiddy WE, Fine SL. Prognosis of patients with bilateral macular drusen. Ophthalmology. 1984;91(3):271–277. doi:10.1016/S0161-6420(84)34309-3
27. Holz FG, Wolfensberger TJ, Piguet B, et al. Bilateral macular drusen in age-related macular degeneration: prognosis and risk factors. Ophthalmology. 1994;101(9):1522–1528. doi:10.1016/S0161-6420(94)31139-0
28. Wang JJ. Risk of age-related macular degeneration in eyes with macular drusen or hyperpigmentation: the blue mountains eye study cohort. Arch Ophthalmol. 2003;121(5):658. doi:10.1001/archopht.121.5.658
29. Reuter T. Fifty years of dark adaptation 1961–2011. Vision Res. 2011;51(21):2243–2262. doi:10.1016/j.visres.2011.08.021
30. Jackson GR, Edwards JG. A short-duration dark adaptation protocol for assessment of age-related maculopathy. j Ocul Biol Dis Inform. 2008;1(1):7–11. doi:10.1007/s12177-008-9002-6
31. Adams WL, Arden GB, Behrman J. Responses of human visual cortex following excitation of peripheral retinal rods. Some applications in the clinical diagnosis of functional and organic visual defects. Br J Ophthalmol. 1969;53(7):439–452. doi:10.1136/bjo.53.7.439
32. Kojima M, Zrenner E. Determination of local thresholds in the visual field by recording the scotopic visually evoked cortical potential in man. ORE. 1980;12(1):1–8. doi:10.1159/000265055
33. Li J, Tso M, Lam T. Reduced amplitude and delayed latency in foveal response of multifocal electroretinogram in early age related macular degeneration. Br J Ophthalmol. 2001;85(3):287–290. doi:10.1136/bjo.85.3.287
34. Alten F, Heiduschka P, Clemens CR, Eter N. Multifocal electroretinography in eyes with reticular pseudodrusen. Invest Ophthalmol Vis Sci. 2012;53(10):6263–6270. doi:10.1167/iovs.12-10094
35. Wu Z, Ayton LN, Guymer RH, Luu CD. Relationship between the second reflective band on optical coherence tomography and multifocal electroretinography in age-related macular degeneration. Invest Ophthalmol Vis Sci. 2013;54(4):2800–2806. doi:10.1167/iovs.13-11613
36. Mahroo OAR, Lamb TD. Recovery of the human photopic electroretinogram after bleaching exposures: estimation of pigment regeneration kinetics. J Physiol. 2004;554(2):417–437. doi:10.1113/jphysiol.2003.051250
37. Ruseckaite R, Lamb TD, Pianta MJ, Cameron AM. Human scotopic dark adaptation: comparison of recoveries of psychophysical threshold and ERG b-wave sensitivity. J Vis. 2011;11(8):2. doi:10.1167/11.8.2
38. Cameron AM, Miao L, Ruseckaite R, Pianta MJ, Lamb TD. Dark adaptation recovery of human rod bipolar cell response kinetics estimated from scotopic b-wave measurements. J Physiol. 2008;586(22):5419–5436. doi:10.1113/jphysiol.2008.160028
39. Fujimura K, Tsuchida Y, Morita Y, Jacobson JH. Application of visually evoked response near the threshold of vision to objective measurement of dark adaptation. Am J Ophthalmol. 1975;79(1):141–150. doi:10.1016/0002-9394(75)90472-9
40. Airas K, Petersen J. Objective determination of dark adaptation: accuracy of the evoked potential method. Graefe’s Arch Clin Exp Ophthalmol. 1985;223(2):63–65. doi:10.1007/bf02150946
41. Hansen RM, Fulton AB. The VEP thresholds for full-field stimuli in dark-adapted infants. Vis Neurosci. 1995;12(02):223–228. doi:10.1017/s0952523800007902
42. Kubová Z, Kremláček J, Kuba M, Chlubnová J, Svěrák J. Photopic and scotopic VEPs in patients with congenital stationary night-blindness. Doc Ophthalmol. 2004;109(1):9–15. doi:10.1007/s10633-004-2435-8
43. Sabeti F, James AC, Essex RW, Maddess T. Dichoptic multifocal visual evoked potentials identify local retinal dysfunction in age-related macular degeneration. Doc Ophthalmol. 2013;126(2):125–136. doi:10.1007/s10633-012-9366-6
44. Sabeti F, James AC, Carle CF, Essex RW, Bell A, Maddess T. Comparing multifocal pupillographic objective perimetry (mfPOP) and multifocal visual evoked potentials (mfVEP) in retinal diseases. Sci Rep. 2017;7:45847. doi:10.1038/srep45847
45. Jiang L, Zhang H, Xie J, et al. Application of multifocal visual evoked potentials in the assessment of visual dysfunction in macular diseases. Eye. 2011;25(10):1302–1309. doi:10.1038/eye.2011.153
46. Jackson GR, Felix T, Owsley C. The Scotopic Sensitivity Tester-1 and the detection of early age-related macular degeneration1. Ophthalmic Physiol Optics. 2006;26(4):431–437. doi:10.1111/j.1475-1313.2006.00390.x
47. Versek C, Rissmiller A, Tran A, et al. Portable system for neuro-optical diagnostics using virtual reality display.
48. Sridhar S, Petrov Y, Yavuzcetin O, Chowdhury K. Sensor system and process for measuring electric activity of the brain, including electric field encephalography. 2016. Available from: https://patents.google.com/patent/US20160120432A1/en.
49. Arvinti B, Toader D, Costache M, Isar A Electrocardiogram baseline wander removal using stationary wavelet approximations. In:
50. Rosenholtz R. Capabilities and limitations of peripheral vision. Annu Rev Vis Sci. 2016;2(1):437–457. doi:10.1146/annurev-vision-082114-035733
51. Purves D, Augustine GJ, Fitzpatrick D, et al. Anatomical distribution of rods and cones. Neuroscience 2nd edition. 2001. Available from: https://www.ncbi.nlm.nih.gov/books/NBK10848/.
52. Pedregosa F, Varoquaux G, Gramfort A, et al. Scikit-learn: machine learning in python. J Mach Learn Res. 2011;12:
53. Versek C, Frasca T, Zhou J, Chowdhury K, Sridhar S. Electric field encephalography for brain activity monitoring. J Neural Eng. 2018;15(4):046027. doi:10.1088/1741-2552/aac3f9
54. Kellogg RS, Kennedy RS, Graybiel A. Motion sickness symptomatology of labyrinthine defective and normal subjects during zero gravity maneuvers. Aerosp Med. 1965;36:315–318.
55. Luck SJ. An Introduction to the Event-Related Potential Technique. MIT Press; 2014.
56. Towle VL, Sutcliffe E, Sokol S. Diagnosing functional visual deficits with the P300 component of the visual evoked potential. Arch Ophthalmol. 1985;103(1):47–50. doi:10.1001/archopht.1985.01050010051017
57. Airas K, Petersen J. Objective determination of dark adaptation: accuracy of the evoked potential method. Graefes Arch Clin Exp Ophthalmol. 1985;223(2):63–65. doi:10.1007/BF02150946
58. Benedek G. Scotopic pattern-reversal visual evoked potentials. Clin Vision Sci. 1993;8(1):47–54.
59. Eysteinsson T, Barris MC, Denny N, Frumkes TE. Tonic interocular suppression, binocular summation, and the visual evoked potential. Invest Ophthalmol Vis Sci. 1993;34(8):2443–2448.
60. Sun H, Pokorny J, Smith VC. Rod-cone interactions assessed in inferred magnocellular and parvocellular postreceptoral pathways. J Vis. 2001;1(1):5. doi:10.1167/1.1.5
61. Zele AJ, Maynard ML, Feigl B. Rod and cone pathway signaling and interaction under mesopic illumination. J Vis. 2013;13(1):21. doi:10.1167/13.1.21
62. Polich J. Updating P300: an integrative theory of P3a and P3b. Clin Neurophysiol. 2007;118(10):2128–2148. doi:10.1016/j.clinph.2007.04.019
63. The AREDS Research Group. The Age-Related Eye Disease Study (AREDS): design Implications AREDS Report No. 1. Control Clin Trials. 1999;20(6):573–600. doi:10.1016/s0197-2456(99)00031-8
64. Flaxel CJ, Adelman RA, Bailey ST, et al. Age-Related macular degeneration preferred practice pattern®. Ophthalmology. 2020;127(1):P1–P65. doi:10.1016/j.ophtha.2019.09.024
65. Tokoro T. On the definition of pathologic myopia in group studies. Acta Ophthalmol Suppl. 1988;185:107–108. doi:10.1111/j.1755-3768.1988.tb02681.x
66. Van Der Stigchel S, Bethlehem RAI, Klein BP, Berendschot TTJM, Nijboer T, Dumoulin SO. Macular degeneration affects eye movement behavior during visual search. Front Psychol. 2013;4. doi:10.3389/fpsyg.2013.00579.
67. Volkmann FC. Human visual suppression. Vision Res. 1986;26(9):1401–1416. doi:10.1016/0042-6989(86)90164-1
68. Perello Nieto M, Human visual pathway. Available from: https://commons.wikimedia.org/wiki/File:Human_visual_pathway.svg.
 © 2021 The Author(s). This work is published and licensed by Dove Medical Press Limited. The
full terms of this license are available at https://www.dovepress.com/terms
and incorporate the Creative Commons Attribution
- Non Commercial (unported, 3.0) License.
By accessing the work you hereby accept the Terms. Non-commercial uses of the work are permitted
without any further permission from Dove Medical Press Limited, provided the work is properly
attributed. For permission for commercial use of this work, please see paragraphs 4.2 and 5 of our Terms.
© 2021 The Author(s). This work is published and licensed by Dove Medical Press Limited. The
full terms of this license are available at https://www.dovepress.com/terms
and incorporate the Creative Commons Attribution
- Non Commercial (unported, 3.0) License.
By accessing the work you hereby accept the Terms. Non-commercial uses of the work are permitted
without any further permission from Dove Medical Press Limited, provided the work is properly
attributed. For permission for commercial use of this work, please see paragraphs 4.2 and 5 of our Terms.