Back to Journals » Drug Design, Development and Therapy » Volume 20
Population Pharmacokinetics and Dose Optimization of Vancomycin in Adult Cancer Patients
Authors Gao J, Gao X ![]() , Xu Y, Feng Z
, Xu Y, Feng Z ![]() , Wang P, Gong W, Wang M
, Wang P, Gong W, Wang M
Received 10 March 2026
Accepted for publication 10 June 2026
Published 20 June 2026 Volume 2026:20 608206
DOI https://doi.org/10.2147/DDDT.S608206
Checked for plagiarism Yes
Review by Single anonymous peer review
Peer reviewer comments 2
Editor who approved publication: Professor Anastasios Lymperopoulos
Jinglin Gao, Xiaonan Gao, Yuxiang Xu, Zhangying Feng, Peiyuan Wang, Wenlin Gong, Mingxia Wang
Department of Clinical Pharmacology, The Fourth Hospital of Hebei Medical University, Shijiazhuang, 050011, People’s Republic of China
Correspondence: Mingxia Wang, Department of Clinical Pharmacology, The Fourth Hospital of Hebei Medical University, 12 Jiankang Road, Shijiazhuang, 050011, People’s Republic of China, Tel +860311-86296233, Email [email protected]
Purpose: This study aimed to develop a population pharmacokinetics (PPK) model of vancomycin (VAN) in adult cancer patients, to identify the factors affecting VAN pharmacokinetics, and to perform different dosing simulations in order to propose optimized individually dosing regimens.
Patients and Methods: A total of 303 samples from 132 adult patients (age range, 18 to 85 years; 48 females and 84 males) diagnosed with cancer and receiving vancomycin were enrolled. A PPK model was developed using NONMEM 7.5. Goodness-of-fit (GOF) plots, visual predictive check (VPC), and bootstrap were used as internal evaluation. External evaluation of the final model was performed. The dosing regimen was optimized using Monte Carlo dose simulations. The ratio of the area under the concentration–time curve up to 24 h to minimum inhibitory concentration (AUC0-24h/MIC)≥ 400 was defined as pharmacokinetic-pharmacodynamic (PK/PD) target.
Results: A two-compartment pharmacokinetic model with zero-order absorption and first-order elimination described the VAN PK data best. In the final model, CL (L/h)=9.12×e0.370× (AGE/57)− 4.61× (BUN/5.35)− 0.226; V1 (L)=11.6; V2 (L)=49.5; Q (L/h)=7.46. The internal and external validation of the model showed a good prediction performance. Monte Carlo simulations revealed that when MIC was 1 mg/L, the recommended doses to achieve a target of AUC0-24h/MIC ≥ 400 were ranging 3– 5g/day. For patients over age of 79 years, a dose of 2 g/day is recommended.
Conclusion: Unlike previous population pharmacokinetic studies that relied on serum creatinine or creatinine clearance, this study incorporated blood urea nitrogen (BUN) and age as the key covariates for vancomycin clearance in adult cancer patients. Based on these covariates and MIC, a validated PPK model enabled individualized dosing to achieve efficacy targets.
Keywords: vancomycin, population pharmacokinetics model, adult cancer patients, optimal dosage regimens
Introduction
Vancomycin is a first-line agent for treating multidrug-resistant Gram-positive bacterial infections, particularly demonstrating good antibacterial activity against methicillin-resistant Staphylococcus aureus (MRSA).1 However, due to its narrow therapeutic window and significant individual variability, therapeutic drug monitoring (TDM) for vancomycin is recommended by guidelines and consensus statements in many countries.2–4 Trough serum vancomycin concentrations should be maintained at 10–15 mg/L in adult patients and 10–20 mg/L in adult patients with serious MRSA infections in China.2 Meanwhile, vancomycin dosage should be administered and adjusted individually based on population pharmacokinetic (PPK) methods.2
Cancer patients, due to their immunocompromised state and side effects such as bone marrow suppression from treatments like chemotherapy, radiotherapy, and stem cell transplantation, are highly susceptible to infections including bacteremia/sepsis, pneumonia, catheter-related bloodstream infections, and endocarditis.5,6 Severe infections may not only necessitate the interruption of anticancer therapy, allowing for tumor progression, but can also rapidly progress to systemic sepsis and septic shock, leading to multiple organ failure and high mortality.7 In clinical practice, physicians often initiate empirical antimicrobial therapy for infected patients, if microbiological testing confirms the presence of pathogens susceptible to vancomycin, such as methicillin-resistant staphylococcus aureus, vancomycin may then serve as the drug of choice.
Extensive research has confirmed that the pharmacokinetics of vancomycin in cancer patients is a dynamic and highly variable process. It is significantly influenced by the patient’s underlying physiological status, severity of disease (particularly neutropenia and associated inflammatory states), and the effects of anti-cancer therapies. These alterations substantially complicate clinical medication, rendering traditional dosing regimens potentially inadequate.8,9 Belabbas et al reported a typical vancomycin clearance of 3.09 L/h for the entire hematologic malignancies cohort (normalized to a CrCl of 90 mL/min), whereas the value increased to 3.80 L/h in the subgroup with neutropenia.10 This research also showed that patients with both neutropenia and augmented renal clearance (ARC) had the highest vancomycin clearance, making them the most vulnerable to subtherapeutic levels and treatment failure.10 Vancomycin clearance significantly increasing in relation to solid malignancies in each stage was demonstrated in a study between Japanese patients having solid malignancy and non-malignancy patients.11 In addition, the treatment of serious MRSA infections in the pediatric cancer patients has been studied by Hadi et al. The widely adopted regimen of 60 mg/kg/day frequently fails to attain target therapeutic exposure in most children and higher than usual vancomycin doses may be required.12 Insufficient drug exposure leads to the selection and overgrowth of less susceptible subpopulations, driving the crisis of escalating drug resistance.13 Thus, it is crucial to characterize pharmacokinetic variability to ensure the proper use of vancomycin by dose tailoring to achieve optimal drug exposure.
In the field of antimicrobial therapy, involving multiple drugs such as β-lactam antibiotics and polymyxins, population pharmacokinetics-pharmacodynamics (PPK-PD) model has become a cornerstone for optimizing drug regimens and combating bacterial resistance.14,15 It supports precise clinical decision, making by quantifying the complex interactions between dosing, drug exposure, minimum inhibitory concentration, and microbiological effect.13 As a glycopeptide antibiotic with a long post-antibiotic effect, vancomycin has an AUC-dependent antibacterial efficiency: to obtain an optimal bactericidal activity, the area under the concentration–time curve over the minimal inhibitory concentration (AUC24/MIC) ≥400.16
Although several PPK models for vancomycin are well-established,17–19 there is scant data on its pharmacokinetics and optimized dosing regimens in adult cancer patients. In the present study, the objective was to develop a vancomycin PPK model of adult cancer patients to better elucidate the pharmacokinetic parameters. Furthermore, by using the validated PPK model we also aimed to propose an optimal dosing regimen.
Materials and Methods
Study Population
This study was designed as a retrospective study and was approved by the Ethics Committee of the Fourth Hospital of Hebei Medical University (No.2021KY125). Data for the development of the PPK model was retrieved from therapeutic drug monitoring between May 11, 2021, and October 1, 2025. These patients, during the course of cancer treatment, were confirmed for infections caused by gram-positive bacteria, specifically MRSA. Patients receiving vancomycin for empiric or definitive therapy with at least a single serum vancomycin concentration for analysis were eligible for inclusion. Vancomycin dosing strategies and TDM were dictated by the clinical needs. Individual dosing regimens, history of measurements, and laboratory test results were thoroughly reviewed from an electronic medical record database. Given the retrospective nature of this study, informed consent from patients was not required. This study was conducted in accordance with the Declaration of Helsinki. All patients’ personal information is restricted to access by authorized researchers only and will not be disclosed to the public.
Bioanalytical Method for Vancomycin Determination
Vancomycin concentrations in plasma were measured using ultra high-performance liquid chromatography (UPLC, Waters, USA) method. The retention time of vancomycin and nor-vancomycin (IS) was 5.3 and 5.6 min, respectively. There was a good linear relationship between concentrations of VAN (1–100 mg/L) in plasma and the ratio of peak area with R2 greater than 0.99. The intra-batch and inter-batch precision, expressed as RSD%, about 1, 2, 20 and 80 mg/L QC samples were less than 5.20%. Accuracy for intra-batch and inter-batch assays ranged from 97.88% to 110.01%. The stability of vancomycin at different conditions conformed to the verification guidelines of biological sample quantitative analysis methods, and the RSD values were less than 6.00%. The accuracy ranged from 95.88% to 108.66%.
Population Pharmacokinetic Modeling
PPK model of vancomycin was carried out by a non-linear mixed-effects modeling approach (NONMEM, Ver 7.5; Icon Inc, MD, USA) with first-order conditional estimation with inter-and intra-subject variability interaction, FOCE-1 to estimate pharmacokinetic parameters. MaS Studio (Ver 1.6.0.5) and R package (Version 4.5.1, http://www.r-project.org) were utilized to construct the output visualization and model evaluation.
Given intravenous administration of vancomycin in this study, one-compartment and two-compartment models with zero-order input were adopted as base structural models. Inter-individual variability of PK parameters was characterized by exponential models, and residual variability was described using additive, proportional and combined error models (Equations 1–3). Model selection was performed based on objective function value (OFV), parameter estimation precision and goodness-of-fit plots (GoF).


Where  is the j-th actual measured data point for the i-th individual in the dataset;
  is the model-predicted value corresponding to the observation
  ;
;  is additive error term, typically assumed to follow a normal distribution with a mean of zero and a constant variance (
 );
);  is proportional error term, typically assumed to follow a normal distribution with a mean of zero and a constant variance (
 ).
).
Collected candidate covariates covered demographic characteristics (age, AGE; gender, SEX; weight, WT; tumor species, CANCER), clinical medication information (total daily dose, TAMT), routine blood and biochemical indicators (Alanine Aminotransferase, ALT; Aspartate Aminotransferase, AST; Total Protein, TP; Albumin, ALB; Blood Urea Nitrogen, BUN; Uric Acid, UA; White Blood Cell, WBC; Absolute Neutrophil Count, ANC; Blood Platelet, PLA; Hemoglobin, HB; Serum Creatinine, SCR), and calculated creatinine clearance (CLCR) derived from the Cockcroft-Gault formula.
Covariate screening was conducted via forward inclusion followed by backward elimination stepwise regression. A decrease of 3.84 in OFV (p<0.05) was set as the criterion for covariate inclusion. Linear, power and exponential functions were used to fit continuous covariates, while additive and proportional models were applied for categorical covariates. Covariates with an OFV elevation exceeding 10.83 (p<0.001) during backward elimination were retained in the final model. Collinearity diagnosis was also performed to guarantee model stability.
Model Validation
In the model evaluation procedure, GoF, visual predictive check (VPC), and bootstrap were used as internal evaluation. The comparison on dependent variable versus population prediction (DV-PRED), dependent variable versus individual prediction (DV-IPRED), conditional weighted residuals versus prediction (CWRES-PRED), absolute values of individual weighted residuals versus individual prediction (|IWRES|-IPRED) between basic and final model was done initially for diagnostic purposes. VPC was performed to evaluated the predictive performance of the final pharmacokinetic model. Resampling with replacement was repeated 1000 times by NONMEM in the final model. The stability and robustness of the final model was assessed by comparing the median and 2.5 and 97.5 percentiles of pharmacokinetic parameters obtained from the bootstrap method and original estimated parameters and calculating the success rate of parameters estimation.
External evaluation of the final model was performed. The data collected from July 2025 to October 2025 were used as validation group. A total of 58 vancomycin plasma samples from 27 patients were collected as the external validation set. Among these patients, 6 were diagnosed with solid tumors, while the remaining had hematological malignancy. Concurrently, clinical data including medication, dosage, infusion rate, age, and BUN levels were collected. The mean prediction error (MPE) was calculated to evaluate the accuracy of the final model, and the mean absolute prediction error (MAPE) was used to evaluate the precision after the concentration of vancomycin in the validation group predicted by the final model. As MPE ≤±20% and MAPE ≤30%, the final model demonstrated good predictive performance.
Simulation and Dose Optimization
Monte Carlo simulation was applied to simulate different dosing regimens using the final PPK models of vancomycin. The probability of target attainment (PTA) was assessed by calculating the proportion of simulated patients achieving AUC0-24/MIC≥400. A PTA of ≥90% was set as the acceptable threshold for clinical efficacy. The following equation was used to calculate the individual AUC0-24/MIC ratio:

Dose0–24 is defined as the total vancomycin dose (mg) administered over 24 hours in cancer patients. CL represents the vancomycin clearance (L/h) and MIC denotes the minimum inhibitory concentration (μg/mL) of vancomycin against the target bacteria in cancer patients.
First, 1000-subject Monte Carlo simulations were conducted for a typical patient with the median of age and BUN under six vancomycin dosing regimens: 500 mg q24h, 500 mg q12h, 1000 mg q12h, 1000 mg q8h, 1000 mg q6h, and 1250 mg q6h. The PTA was assessed against MICs of 0.5, 1, 2, and 4 μg/mL.
Then, simulations (n=1000) across cancer patients with different ages and BUN levels (the median and 5 and 95 percentiles) for each of the six regimens. Target attainment was tested at MIC value of 1 μg/mL.
Results
Study Population
A total of 132 patients diagnosed with cancer were enrolled in modeling group, consisting of 84 males and 48 females, with a median age of 57 years and a median body weight of 66 kg. Table 1 summarizes the patients’ demographic and biological characteristics. Of the total patients, 95 were confirmed with hematological malignancy, and 37 were confirmed with solid tumors. The total daily vancomycin dose ranged from 0.5 to 3 g. Within this range, the most frequently administered regimen, used in 93 patients, was 1 g every 12 hours. During treatment, 45 patients required dose adjustment, while 30 received a loading dose as their initial medication. The usual infusion duration of vancomycin for these patients was 1 to 2 hours.
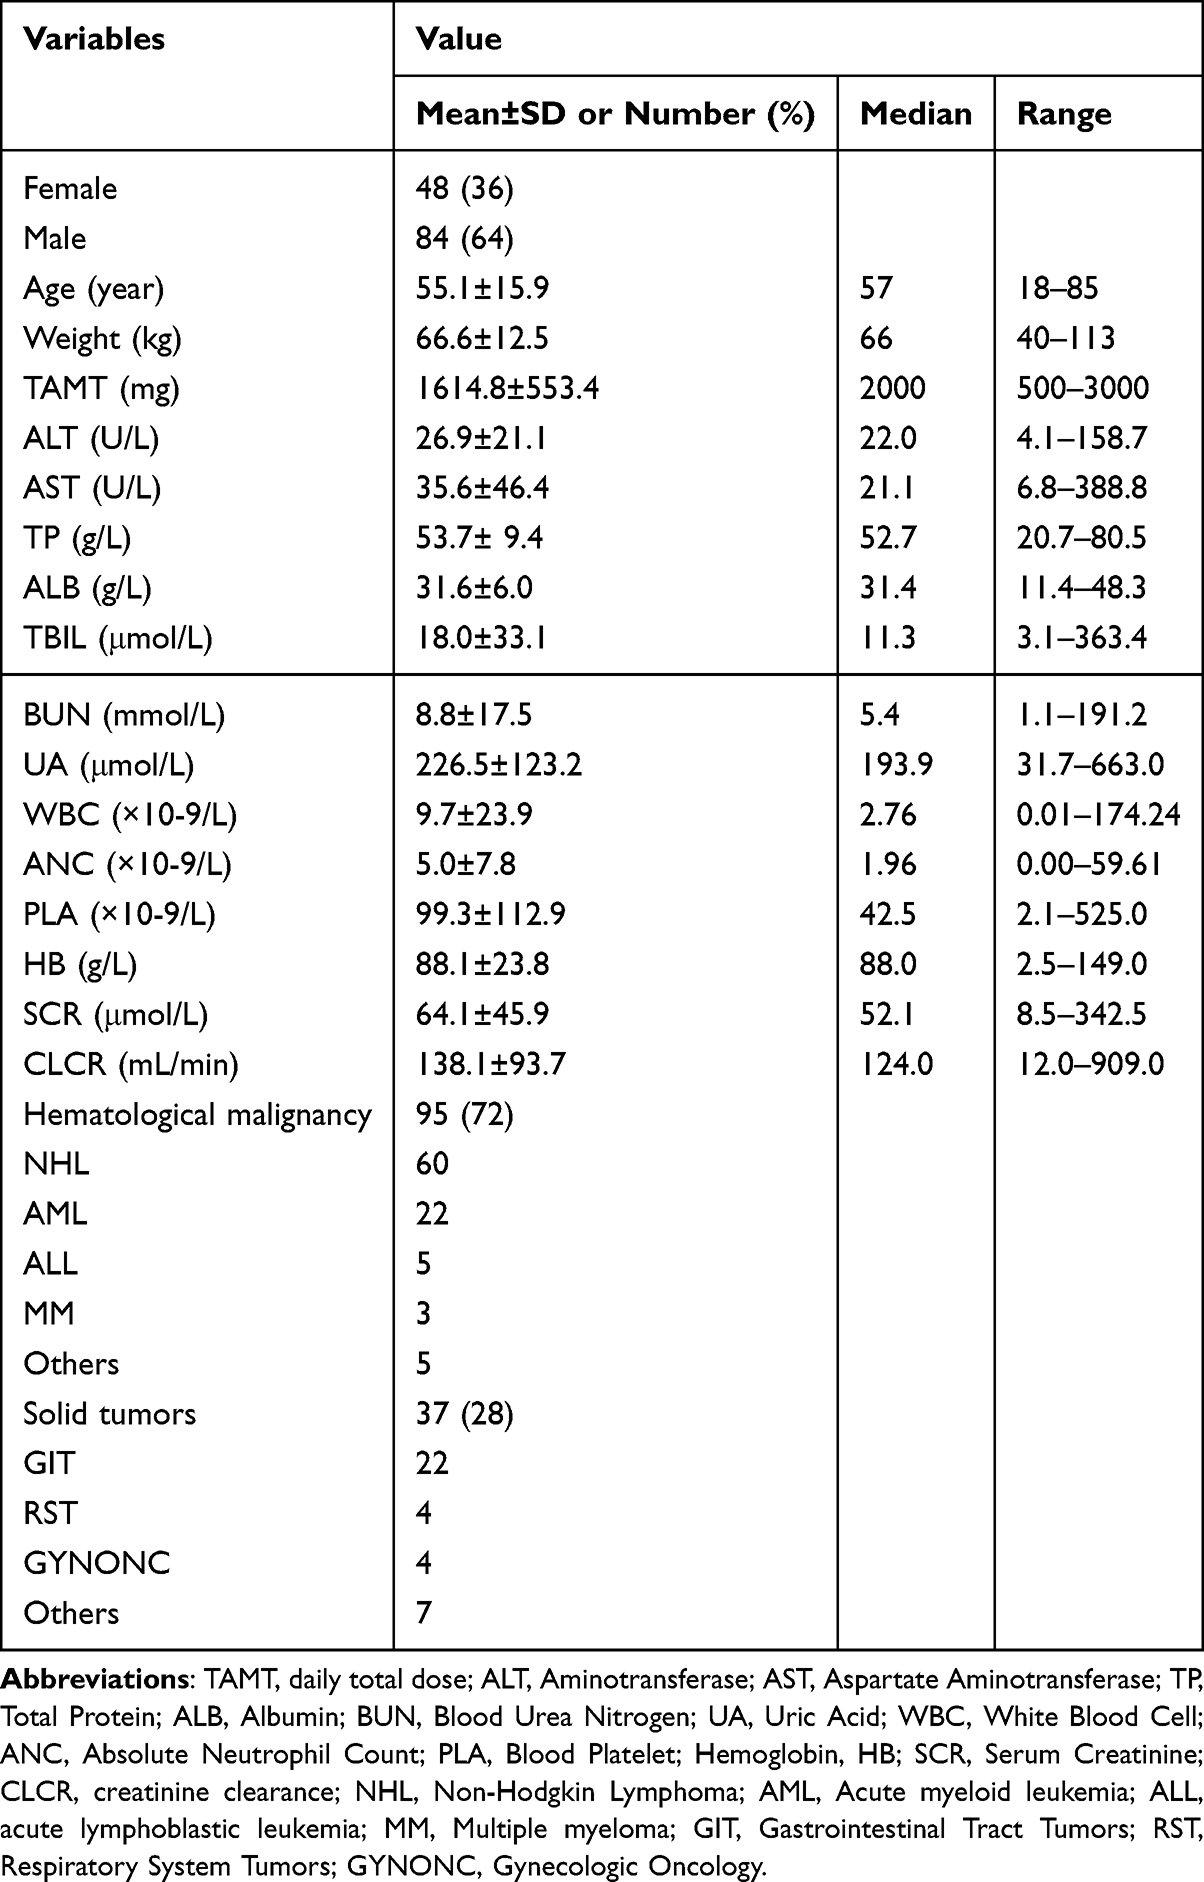 |
Table 1 Demographics and Biological Characteristics of Patients with Cancer in the Model Building Set |
Population Pharmacokinetic Model
The modeling dataset comprised three hundred and three vancomycin concentration measurements. The median concentration was 13.01 µg/mL, ranging from 1.15 to 81.45 µg/mL. The population pharmacokinetic of vancomycin was best characterized by a two-compartment model with first-order elimination, as evidenced by an OFV of 1408.759, percent relative standard errors (RSE%) below 30% and satisfactory goodness-of-fit plots (Table 2 and Figure 1). The combined residual error model provided the best description of the residual variability for the pharmacokinetic parameters (clearance CL, intercompartmental clearance V1, Volume of peripheral compartment V2, intercompartmental clearance Q).
 |
Table 2 Parameter Estimates of the Basic and Final Vancomycin Models and Bootstrap Results |
 |
Figure 1 Goodness of fits plot of basic model: (a) observed vancomycin concentrations (DV) vs. population-predicted concentration (PRED); (b) DV vs. individual predicted concentration (IPRED); (c) conditional weighted residuals (CWRES) vs. PRED; (d) CWRES vs. TIME. |
Figure 2 presented the correlations among covariates, showing strong correlations (eg., ALB with TP, ANC with WBC, SCR with CLCR, r>0.7). To avoid multicollinearity, AGE, WT, TAMT, ALT, AST, ALB, TBIL, BUN, UA, WBC, PLA, HB and SCR were selected for subsequent screening. AGE and BUN remained as statistically significant covariates for vancomycin clearance in the final model, while other covariates were excluded due to non-significance. The population pharmacokinetic parameter estimates of the final model are shown in Table 2. The RSE% for structural model parameters were <30%, indicating good precision. Incorporation of the covariates AGE, BUN led to a reduction in the inter-individual variability of clearance from 0.562 to 0.370, alongside a decrease in residual variability from 1.52 to 1.40. The final model is defined by Equations 5, 6, 7 and 8, characterizing CL, V1, V2 and Q.


 |
Figure 2 Correlation matrix heatmap between the covariates collected in the study. Each circle in the plot represents the Pearson correlation coefficient (r) between two variables. The color intensity (darkness) of the circle is proportional to the magnitude of the correlation coefficient—the larger the absolute value of r, the darker the color. When |r| > 0.7, there to be a strong correlation between the two covariates. |
Model Validation
The goodness-of-fit plots for final model were shown in Figure 3. From (Figure 3a and Figure 3b), it could be observed that both the population-predicted and individual-predicted values of the final model exhibit a strong correlation with the actual observed values, with the data evenly distributed on both sides of the y=x line. From (Figure 3c and Figure 3d), it could be seen that the conditional weighted residuals demonstrated a good fit to the actual observed values across various time periods and both high and low concentration ranges, with the residuals evenly distributed above and below y=0 and mostly lying between −4 and 4.
 |
Figure 3 Goodness of fits plot of final model: (a) observed vancomycin concentrations (DV) vs. population-predicted concentration (PRED); (b) DV vs. individual predicted concentration (IPRED); (c) conditional weighted residuals (CWRES) vs. PRED; (d) CWRES vs. TIME. |
 |
Figure 4 Visual predictive check of the final model. The blue hollow circles represent the observed data. The red and blue lines (top to bottom) show the 95th, 50th, and 5th percentiles of the observations, while the blue and red shaded areas represent the 95% confidence intervals for the corresponding percentiles of the simulated data. |
 |
Figure 5 Probability of target attainment (%) simulations of vancomycin dosing regimen at different MICs of 0.5, 1, 2, 4 μg/mL with the median BUN and age. |
 |
Figure 6 Probability of target attainment (%) simulations of vancomycin dosing regimen at different age, and BUN levels. (a) a corhort with the median BUN and MIC of 1μg/mL aged 24, 57, 79 years; (b) a corhort with the median age and MIC of 1μg/mL at the BUN level of 2.2, 5.35, 16.1 mmol/L. |
Figure 4 displayed the VPC plot generated from 1000 Monte Carlo simulations of the final PPK model. The observed data (represented by blue circles) and their empirical percentiles (blue lines: 95th and 5th; red line: 50th) were predominantly contained within the 95% confidence intervals (blue and red shaded regions) of the corresponding simulated percentiles. These results demonstrated that the model adequately captured the central tendency and variability of the observed data, confirming the model’s predictive performance.
Table 2 presented the bootstrap results of the vancomycin PPK model. The parameter values obtained were consistent with those estimated in the final population pharmacokinetic model of vancomycin. The median values of all parameters fall within the 5%–95% confidence intervals derived from bootstrapping. These final bootstrap results demonstrated that the established PPK model exhibited good reliability and stability for vancomycin in adult patients with cancer.
The external evaluation affirmed the final model’s accurate characterization of vancomycin pharmacokinetics in the study population. The model exhibited an MPE of −3.4% and an MAPE of 28.8%. The proportions of prediction errors within 20% and 30% were 43.5% and 62.9%, respectively, indicating satisfactory predictive performance across adult patients with cancer.
Simulation and Dose Optimization
Based on the simulation results using the final model in different dosing scenarios summarized, for the cancer patient aged 57 years with a BUN of 5.35 mmol/L, satisfactory antimicrobial activity (PTA ≥90%) was achieved with a daily vancomycin dose of 2000 mg (1000 mg q12h, PTA=93.5%) when the MIC was 0.5 mg/L, and with 4000 mg (1000 mg q6h, PTA=93.5%) when the MIC was 1 μg/mL. For MIC values ≥2 μg/mL, all PTA values fell below 90%, indicating the need for combination therapy or alternative agents during empirical treatment (Figure 5).
At an MIC of 1 μg/mL, the PTA varied with age and BUN (Figure 6). Effective regimens achieving PTA ≥90% were identified: 1250 mg q6h for cancer patients ranging 24–57 years, 1000 mg q6h for 57–79 years and 1000 mg q12h for ≥79 years. Similarly, effective regimens across BUN levels were 1000 mg q6h for BUN 2.2–5.35 mmol/L, and 1000 mg q8h for BUN ≥16.1 mmol/L.
Discussion
Patients with hematologic malignancies or solid tumor often experience pathophysiological alterations that can significantly influence the PK profile. In this study, we established a PPK model of vancomycin for Chinese adult cancer patients. Our analysis revealed that age and BUN levels significantly the estimated pharmacokinetic parameters. The final vancomycin PPK model demonstrated good predictive performance, as supported by both internal and external validation.
Compared with previous studies, several PPK models of vancomycin in cancer patients have been published, all of which used creatinine or creatinine clearance‑based renal function markers.8,9,19 To our knowledge, the present study is the first to identify blood urea nitrogen (BUN) and age as the only significant covariates for vancomycin clearance in adult cancer patients. By avoiding creatinine’s dependence on muscle mass, our BUN‑based model provides a practical alternative for malnourished or cachectic cancer patients. This novel finding adds a distinct perspective to the existing literature and directly addresses the clinical need for a more accessible dosing tool when creatinine‑based equations may misestimate renal function. Meanwhile, previous PPK models of vancomycin in patients with cancer have been largely limited to either hematologic malignancies or solid tumors alone.8,9,18,19 In contrast, our study enrolled a mixed cohort of 132 adult cancer patients (28% solid tumors, 72% hematologic malignancies), enabling a direct comparison of vancomycin clearance and apparent volume of distribution between these two groups—a comparison that has not been previously reported in such a comprehensive model.
Vancomycin was administered via intravenous infusion in the present study, which could directly skip the in vivo absorption process; hence, zero-order input structural models were preferentially selected for model construction. Given that TDM for vancomycin primarily relies on trough concentration measurements, data availability is often limited, making the one-compartment model more practical for PPK analysis.19,20 In contrast, this study included both peak concentration and multiple samples during the elimination phase in oncology patients. In addition, considering that the two-compartment model yielded a lower OFV values (1408.8 vs 1543.9) than the one-compartment model and demonstrated better goodness-of-fit in diagnostic plots, it was selected as the basic model for this study. Finally, in the two-compartment model, inter-individual variability (IIV) was retained only for CL, while IIV for V1, V2, and Q was fixed to zero. This decision was based on the following observations: firstly, the estimated ETA values for V2 and Q were zero after model runs; secondly, IIV included on V1 resulted in a reduction in the objective function value (OFV) of less than 3.84, a change that was not statistically significant. This might be attributed to the high homogeneity of the population studied. Exponential inter-individual variability was used to ensure positive parameter estimates and log-normal distribution assumptions. The residual error model (additive, proportional, or combined) was selected by comparing OFV and inspecting residual plots to ensure homoscedasticity across the concentration range. No data below the limit of quantification were present in our dataset, so no special handling was required. Model evaluation was performed using goodness-of-fit plots, VPC, and bootstrap analysis was conducted to confirm parameter stability.
In the PPK model of vancomycin for Chinese adult cancer patients in this study, the typical values for CL, V1, V2, and Q were 9.12L/h, 11.6 L, 49.5 L, and 7.46 L/h, respectively. The CL and V values identified for cancer patients differed from those previously published. This divergence can be explained by the distinct patient population included, such as differences in disease status, cancer type, or therapeutic regimens were are in a hyperdynamic state, resulting in drug CL higher than that of non-cancer patients. The results of a PPK model study conducted in Saudi Arabian indicated that vancomycin CL in cancer patients was significantly higher than that in non-cancer patients (7.4 vs 5.6 L/h).19 Belabbas et al reported that the typical values in Japanese patients with hematological malignancies was 15% higher than that in non-hematological malignancy patients.10 Furthermore, the same group showed that vancomycin CL was significantly higher by 23% in patients with febrile neutropenia than in those without (0.078 ± 0.030 vs 0.061 ± 0.026 mL/min).20 In contrast, the difference in apparent volume of distribution between the groups was not statistically significant (45 L vs 42 L, P=0.83).19 One explanation has been offered to explain these findings that neutropenia caused by chemotherapy or hematologic malignancies can lead to ARC, resulting in accelerated vancomycin clearance.10 Individualized dosing adjustment and therapeutic drug monitoring are strongly recommended. Research on vancomycin PPK in Chinese cancer patients is limited, with existing studies such as that by Lv et al focusing primarily on pediatric hematologic malignancy patients with augmented renal clearance.18 The present study aims to establish a PPK model for vancomycin in Chinese adult cancer patients, investigates the factors influencing its pharmacokinetic parameters, and explores strategies for optimizing dosing regimens.
Covariate selection was based on physiological rationale and prior literature. SCR, CLCR, BUN, and UA were selected due to vancomycin’s predominant renal elimination. ALT, AST, and TBIL were considered because hepatic dysfunction may alter drug disposition though secondary to renal impairment. ALB and TP reflect unbound vancomycin fraction, affecting distribution and clearance. Inflammatory markers (WBC, ANC, PLA, HB) were screened as systemic inflammation may alter vancomycin PK (eg, increased Vd) AGE, WT, and SEX capture established effects on Vd and clearance. TAMT and CANCER were included because cumulative dose and cancer type may influence PK behavior.
In line with the previous study, we found that age and BUN were significant covariates on CL of vancomycin for adult patients.21 The CL decreased with increasing age and BUN. The trend of CL with age in our study could be primarily attributed to physiological alterations associated with aging. Age-related alterations in both renal function (eg., decreased glomerular filtration rate) and body composition can significantly impact vancomycin pharmacokinetics in elderly patients, leading to reduced clearance and altered volume of distribution per kilogram of body weight.22 Notably, SADOH et al observed higher vancomycin clearance in elderly patients with malignancies, illustrating the complex and unpredictable pharmacokinetics in this group. The reciprocal effects between aging and the presence of malignancies have not yet been investigated. Therefore, this finding directly calls for personalized dosing and rigorous therapeutic drug monitoring in elderly cancer patients receiving vancomycin. Recent researches had established a significantly negative association between BUN and CL of vancomycin.17,23 Consequently, BUN serves as an independent marker for assessing residual renal function, distinct from Scr, and should be integrated into dosing algorithms. Moreover, severe infection can trigger systemic inflammation, leading to hemodynamic instability and acute kidney injury (AKI), characterized by significantly elevated BUN.24 Thus, BUN not only indicates renal function but also partly reflects the severity of the patient’s illness.25
We performed simulations to evaluate the impact of age and BUN on CL of vancomycin, aiming for a PK/PD target of AUC0-24h/MIC ≥400 more appropriate in adult cancer patients. For a cohort aged 57 years with BUN of 5.35 mmol/L, the current dosing regimens resulted in a >90% PTA against MIC of 0.5 μg/mL. Nevertheless, at an MIC of 1 μg/mL, the guideline recommended dose of did not meet the target PTA, with a target attainment rate of merely 69.4%. Therefore, higher doses of vancomycin (1000 mg/6h) were needed to achieve the optimal PTA (93.5%). When the MIC is ≥2 μg/mL, 1250 mg/6h is unlikely to achieve an AUC0-24h/MIC ≥400, and alternative antibiotics or combination therapy should be considered for treatment. This finding is consistent with the previous studies in children and ICU patients.18,19,26 In terms of age, 1250 mg/6h, 1000 mg/6h, 1000 mg/12h vancomycin are recommended for cancer patients aged 24–57 years, 57–79 years, ≥79 years, respectively. In terms of BUN, 1000 mg/6h, 1000 mg/6h and 1000 mg/8h are recommended for this particular population with BUN of 2.2–5.35 mmol/L, 5.35–16.1 mmol/L, and ≥16.1 mmol/L.
Several potential biases should be considered when interpreting this PopPK model. First, renal function was evaluated using estimated CLCR rather than directly measured values. This estimated indicator is susceptible to age, body composition, nutritional status and other factors, which may lead to inevitable deviations and affect the accuracy of relevant correlation analysis. Second, variations in cancer therapy regimens (eg., chemotherapy, targeted therapy, immunotherapy) may influence renal function, fluid status, or protein binding, thereby altering vancomycin pharmacokinetics. Future studies should stratify by treatment type, incorporate regimen as a categorical covariate, or conduct subgroup analyses. Third, concomitant antibiotics (eg., piperacillin-tazobactam, aminoglycosides) could modify renal clearance or increase nephrotoxicity. Researchers should document concomitant use and evaluate it as a time-varying covariate. Furthermore, precise timing of blood collection relative to infusion end is essential. We adhered to standardized protocols (eg., trough samples within 30 minutes pre-dose, peak samples at predefined post-infusion time points). Other biases, including missing data and assay variability, can be addressed through multiple imputation and regular assay calibration. In addition, the NPDE analysis in this study revealed a slight underestimation of interindividual variability (variance 1.65), possibly due to extreme tail individuals or sparse sampling (Figure 7). However, bootstrap and external validation confirmed parameter stability and unbiased predictions, and VPC supported overall model performance. Therefore, the model is considered acceptable for population pharmacokinetic predictions. Caution is needed when applying Bayesian individualized dosing, particularly regarding prediction intervals. Future studies could explore more flexible random effect distributions (eg., t-distribution) or increase sampling density to further improve the characterization of interindividual variability.
 |
Figure 7 Normalized prediction distribution errors (NPDE) diagnostic plots for the final population pharmacokinetic model. (A) Histogram showing the frequency distribution of the empirical npd (bars) compared with the theoretical standard normal distribution. (B) Quantile-quantile (Q-Q) plot of the empirical npd versus the theoretical standard normal distribution. (C) npd versus time after drug administration. (D) npd versus population predicted concentrations (Predicted DV). |
Conclusion
A two-compartment vancomycin PPK model was characterized in Chinese adult cancer patients. Age and BUN significantly influenced vancomycin clearance. The final model fit well and exhibited satisfactory predictive performance. Based on Monte Carlo simulations, vancomycin dosage should be adjusted on the basis of age and BUN. When MIC was 1 μg/mL, Chinese adult cancer patients aged 24–79 years required higher doses ranging 3–5 g/day than current recommended dosage. A dose of 2 g/day is recommended for patients over the age of 79 years. However, the benefits of dose escalation need to be weighed against the potential risk of nephrotoxicity.
Acknowledgments
This work was supported by the Key Projects of Hebei Provincial Natural Science Foundation (Grant numbers: H2021206432), Hebei Science and Technology Major Project for Biological Medicine Innovation and Development (Grant numbers: 23377707D) and Hebei Province Medical Scientific Research Project Plan (Grant numbers: 20221278).
Disclosure
The authors report no conflicts of interest in this work.
References
1. Liu C, Bayer A, Cosgrove SE, et al. Infectious Diseases Society of America. Clinical practice guidelines by the infectious diseases society of america for the treatment of methicillin-resistant Staphylococcus aureus infections in adults and children. Clin Infect Dis. 2011;52(3):e18–14. doi:10.1093/cid/ciq146
2. He N, Su S, Ye Z, et al. Evidence-based guideline for therapeutic drug monitoring of vancomycin: 2020 update by the division of therapeutic drug monitoring, Chinese pharmacological society. Clin Infect Dis. 2020;71:S363–S371. doi:10.1093/cid/ciaa1536
3. Rybak MJ, Le J, Lodise TP, et al. Therapeutic monitoring of vancomycin for serious methicillin-resistant Staphylococcus aureus infections: a revised consensus guideline and review by the American society of health-system pharmacists, the infectious diseases society of America, the pediatric infectious diseases society, and the society of infectious diseases pharmacists. Am J Health Syst Pharm. 2020;77(11):835–864. doi:10.1093/ajhp/zxaa036
4. Matsumoto K, Oda K, Shoji K, et al. Clinical practice guidelines for therapeutic drug monitoring of vancomycin in the framework of model-informed precision dosing: a consensus review by the Japanese society of chemotherapy and the Japanese society of therapeutic drug monitoring. Pharmaceutics. 2022;14(3):489. doi:10.3390/pharmaceutics14030489
5. Klastersky J, de Naurois J, Rolston K, et al. ESMO guidelines committee. Management of febrile neutropaenia: ESMO clinical practice guidelines. Ann Oncol. 2016;27:v111–v118. doi:10.1093/annonc/mdw325
6. Taplitz RA, Kennedy EB, Bow EJ, et al. Outpatient management of fever and neutropenia in adults treated for malignancy: American society of clinical oncology and infectious diseases society of America clinical practice guideline update. J Clin Oncol. 2018;36(14):1443–1453. doi:10.1200/JCO.2017.77.6211
7. Lalami Y, Klastersky J. Impact of chemotherapy-induced neutropenia (CIN) and febrile neutropenia (FN) on cancer treatment outcomes: an overview about well-established and recently emerging clinical data. Crit Rev Oncol Hematol. 2017;120:163–179. doi:10.1016/j.critrevonc.2017.11.005
8. Buelga DS, Del Mar Fernandez de Gatta M, Herrera EV, et al. Population pharmacokinetic analysis of vancomycin in patients with hematological malignancies. Antimicrob Agents Chemother. 2005;49(12):4934–4941. doi:10.1128/AAC.49.12.4934-4941
9. Okada A, Kariya M, Irie K, et al. Population pharmacokinetics of vancomycin in patients undergoing allogeneic hematopoietic stem-cell transplantation. J Clin Pharmacol. 2018;58(9):1140–1149. doi:10.1002/jcph.1106
10. Belabbas T, Yamada T, Egashira N, et al. Population pharmacokinetic model and dosing optimization of vancomycin in hematologic malignancies with neutropenia and augmented renal clearance. J Infect Chemother. 2023;29(4):391–400. doi:10.1016/j.jiac.2023.01.010
11. Izumisawa T, Wakui N, Kaneko T, et al. Increased vancomycin clearance in patients with solid malignancies. Biol Pharm Bull. 2020;43(7):1081–1087. doi:10.1248/bpb.b20-00083
12. Abdel Hadi O, Al Omar S, Nazer LH, et al. Vancomycin pharmacokinetics and predicted dosage requirements in pediatric cancer patients. J Oncol Pharm Pract. 2016;22(3):448–453. doi:10.1177/1078155215591386
13. Theuretzbacher U. Pharmacokinetic and pharmacodynamic issues for antimicrobial therapy in patients with cancer. Clin Infect Dis. 2012;54(12):1785–1792. doi:10.1093/cid/cis210
14. Roberts JA, Abdul-Aziz MH, Lipman J, et al; International Society of Anti-Infective Pharmacology and the Pharmacokinetics and Pharmacodynamics Study Group of the European Society of Clinical Microbiology and Infectious Diseases. Individualised antibiotic dosing for patients who are critically ill: challenges and potential solutions. Lancet Infect Dis. 2014;14(6):498–509. doi:10.1016/S1473-3099(14)70036-2
15. Ye Q, Wang Q, Chen W, et al. The population pharmacokinetics and dose optimization of polymyxin B in critically ill patients with or without extracorporeal membrane oxygenation. J Clin Pharm Ther. 2022;47(10):1608–1618. doi:10.1111/jcpt.13711
16. Maruyama T, Kimura T, Ebihara F, et al. Comparison of the predictive accuracy of the physiologically based pharmacokinetic (PBPK) model and population pharmacokinetic (PPK) model of vancomycin in Japanese patients with MRSA infection. J Infect Chemother. 2023;29(12):1152–1159. doi:10.1016/j.jiac.2023.08.017
17. Xu J, Zhu Y, Niu P, et al. Establishment and application of population pharmacokinetics model of vancomycin in infants with meningitis. Pediatr Neonatol. 2022;63(1):57–65. doi:10.1016/j.pedneo.2021.06.018
18. Lv CL, Lu JJ, Chen M, et al. Vancomycin population pharmacokinetics and dosing recommendations in haematologic malignancy with augmented renal clearance children. J Clin Pharm Ther. 2020;45(6):1278–1287. doi:10.1111/jcpt.13206
19. Alqahtani S, Almatrafi A, Bin Aydan N, et al. Optimization of vancomycin dosing regimen in cancer patients using pharmacokinetic/pharmacodynamic modeling. Pharmacotherapy. 2020;40(12):1192–1200. doi:10.1002/phar.2475
20. Alzahrani AM, Naeem A, AlAzmi A, et al. Altered pharmacokinetics parameters of vancomycin in patients with hematological malignancy with febrile neutropenia, a Bayesian software estimation. Antibiotics. 2023;12(6):979. doi:10.3390/antibiotics12060979
21. Goti V, Chaturvedula A, Fossler MJ, et al. Hospitalized patients with and without hemodialysis have markedly different vancomycin pharmacokinetics: a population pharmacokinetic model-based analysis. Ther Drug Monit. 2018 40(2):212-221. Ther Drug Monit. 2019;41(4):549. doi:10.1097/FTD.0000000000000666
22. Mulla H, Pooboni S. Population pharmacokinetics of vancomycin in patients receiving extracorporeal membrane oxygenation. Br J Clin Pharmacol. 2005;60(3):265–275. doi:10.1111/j.1365-2125.2005.02432.x
23. DelDot ME, Lipman J, Tett SE. Vancomycin pharmacokinetics in critically ill patients receiving continuous venovenous haemodiafiltration. Br J Clin Pharmacol. 2004;58(3):259–268. doi:10.1111/j.1365-2125.2004.02143.x
24. Bellomo R, Kellum JA, Ronco C. Acute kidney injury. Lancet. 2012;380(9843):756–766. doi:10.1016/S0140-6736(11)61454-2
25. Waikar SS, Bonventre JV. Biomarkers for the diagnosis of acute kidney injury. Nephron Clin Pract. 2008;109(4):c192–7. doi:10.1159/000142928
26. Del Mar Fernández de Gatta Garcia M, Revilla N, Calvo MV, et al. Pharmacokinetic/pharmacodynamic analysis of vancomycin in ICU patients. Intensive Care Med. 2007;33(2):279–285. doi:10.1007/s00134-006-0470-5
 © 2026 The Author(s). This work is published and licensed by Dove Medical Press Limited. The
full terms of this license are available at https://www.dovepress.com/terms
and incorporate the Creative Commons Attribution
- Non Commercial (unported, 4.0) License.
By accessing the work you hereby accept the Terms. Non-commercial uses of the work are permitted
without any further permission from Dove Medical Press Limited, provided the work is properly
attributed. For permission for commercial use of this work, please see paragraphs 4.2 and 5 of our Terms.
© 2026 The Author(s). This work is published and licensed by Dove Medical Press Limited. The
full terms of this license are available at https://www.dovepress.com/terms
and incorporate the Creative Commons Attribution
- Non Commercial (unported, 4.0) License.
By accessing the work you hereby accept the Terms. Non-commercial uses of the work are permitted
without any further permission from Dove Medical Press Limited, provided the work is properly
attributed. For permission for commercial use of this work, please see paragraphs 4.2 and 5 of our Terms.