Back to Journals » Drug Design, Development and Therapy » Volume 19
Population Pharmacokinetic and Pharmacodynamic Modeling Analysis of rhIL-7-hyFc, a Hybrid Fc-Fused Long-Acting Interleukin-7, to Support Optimal Dosing Regimens in Patients with Solid Cancer
Authors Park S ![]() , Lee SM, Pak KC, Byun MS, Choi D, Lim HS
, Lee SM, Pak KC, Byun MS, Choi D, Lim HS ![]()
Received 5 September 2025
Accepted for publication 28 September 2025
Published 17 October 2025 Volume 2025:19 Pages 9303—9320
DOI https://doi.org/10.2147/DDDT.S564085
Checked for plagiarism Yes
Review by Single anonymous peer review
Peer reviewer comments 2
Editor who approved publication: Prof. Dr. Tin Wui Wong
Seohyeon Park,1 Sang Min Lee,1 Kwan Cheol Pak,1 Mi-Sun Byun,2 Donghoon Choi,3 Hyeong-Seok Lim1
1Department of Clinical Pharmacology and Therapeutics, Asan Medical Institute of Convergence Science and Technology, Asan Medical Center, University of Ulsan College of Medicine, Seoul, Republic of Korea; 2Genexine, Inc., Seoul, Republic of Korea; 3Neoimmunetech, Inc., Rockville, MD, USA
Correspondence: Hyeong-Seok Lim, Department of Clinical Pharmacology and Therapeutics, Asan Medical Institute of Convergence Science and Technology, Asan Medical Center, University of Ulsan College of Medicine, 88, Olympic-Ro 43-Gil, Songpa-Gu, Seoul, 05505, Republic of Korea, Tel +82-2-3010-4613, Fax +82-2-3010-4622, Email [email protected]
Purpose: rhIL-7-hyFc (Efineptakin alfa) is a novel, long-acting recombinant human interleukin-7 developed to enhance immune responses by correcting T-cell deficiencies through increased lymphocyte counts. This study aimed to develop a population pharmacokinetic–pharmacodynamic (PK–PD) model to support selection of the recommended Phase 2 dose (RP2D) through optimization of dosing regimens.
Patients and Methods: Serum rhIL-7-hyFc concentrations and absolute lymphocyte counts (ALC) were collected from 35 patients with solid tumors enrolled in a Phase Ib clinical trial (NCT03478995), who received multiple intramuscular administrations of rhIL-7-hyFc at doses ranging from 0.06 to 1.7 mg/kg every 3 or 6 weeks. A sequential mixed-effects PK–PD model was developed using NONMEM® (version 7.4.3) based on individual PK parameters. Monte Carlo simulations with extended dosing intervals up to 12 weeks were conducted to explore serum concentration profiles, ALC dynamics over time, and exposure–response relationships.
Results: The PK data were best described by a two-compartment model with first-order absorption from two depot compartments, and inter-occasional variability in clearance was incorporated in the final model. To account for the time-delayed response, the PD model utilized a series of transit compartments representing lymphocyte maturation. The stimulatory effect of rhIL-7-hyFc on progenitor cell proliferation was described using a simple maximum effect model. The estimated half-maximum effective concentration (EC50) was 0.066 ng/mL, indicating a high potency in increasing serum lymphocyte levels. Monte-Carlo simulation based on the final PK–PD model showed a dose-dependent increase in ALC. A dose range of 0.6– 1.2 mg/kg administered at intervals of 6 to 12 weeks was suggested as feasible for the RP2D in further clinical trials.
Conclusion: A population PK–PD modeling and simulation results demonstrated a strong exposure–response relationship for ALC across dosing intervals, underscoring the mechanism-based therapeutic potential of rhIL-7-hyFc in cancer immunotherapy.
Keywords: rhIL-7-hyFc, PK/PD modeling, ALC, model-based exposure–response relationship, optimal dosing regimens
Introduction
Interleukin-7 (IL-7) is a non-redundant homeostatic cytokine that plays a pivotal role in T-cell biology. As a member of the common gamma-chain cytokine family, IL-7 is essential for the development, survival, and homeostatic proliferation of T lymphocytes.1 It enhances thymopoiesis, promotes the survival of naïve and memory T cells, and expands the peripheral T-cell pool by reducing apoptosis and stimulating proliferation.1,2 In healthy individuals, endogenous IL-7 levels are typically low (2–8 pg/mL) and inversely correlated with circulating T-cell counts, reflecting a feedback mechanism that regulates immune homeostasis.3 In lymphopenic states, such as those caused by congenital or acquired immunodeficiency, IL-7 levels can rise to as high as 60 pg/mL as a compensatory response; however, this endogenous elevation is often insufficient to restore immune competence.3–5 Exogenous IL-7 and its derivatives have been shown in multiple studies to reverse treatment-induced lymphopenia and support immune reconstitution in cancer, viral infections, and immunodeficiency syndromes.6–8
Lymphopenia, typically defined as an absolute lymphocyte count (ALC) < 1000 cells/μL, is a common and often prolonged complication of cancer therapy, particularly in regimens involving chemotherapy or protracted/fractionated radiotherapy.9,10 It has been consistently associated with poor survival outcomes across various solid tumors, including glioblastoma, lung, pancreatic, and head and neck squamous cell carcinomas (HNSCC).11–14 Persistent lymphopenia not only reflects impaired host immunity but also compromises anti-tumor responses and increases susceptibility to infections and treatment-related complications.15 Accordingly, therapeutic strategies aimed at restoring lymphocyte, particularly T cell, levels have gained traction as adjunctive approaches to improve treatment efficacy and clinical outcomes.16
In early-phase oncology trials, the identification of reliable mechanism-based biomarkers is critical for evaluating both the pharmacodynamic effects of immune-targeting therapies and their potential clinical benefits. In this context, peripheral ALC has emerged as a readily accessible and quantitative biomarker, providing a robust indicator of systemic immune competence.17–19 Biologically, IL-7 administration leads to a broad expansion of T-cells, including both CD4+ and CD8+ populations, in a roughly proportional manner. Measuring the composite ALC thus reflects the overall magnitude of IL-7-driven T-cell proliferation without being limited to one subset.19 Importantly, ALC is a clinically meaningful indicator of immune status: cancer patients’ baseline ALC or post-therapy lymphocyte recovery has been correlated with survival outcomes and response to treatments.9–19
Incorporating ALC through PK/PD modeling, provides critical insights into exposure–response relationships and facilitates the evaluation of candidate doses. Monte Carlo simulations, which account for interindividual variability, further enable the assessment of efficacy across diverse patient populations and support dose optimization under various clinical scenarios.20,21 Recent regulatory guidance emphasizes the importance of early exposure–response characterization using mechanistic biomarkers, offering a more rational and evidence-based framework for dose selection in clinical development, particularly for targeted and immuno-oncology22,23 Regulatory precedents in immuno-oncology, such as the dose selection for pembrolizumab based on an integrated approach that combines pharmacokinetic exposure, pharmacodynamic biomarkers (eg, receptor occupancy), and clinical outcomes, underscore the regulatory acceptance of biomarker-driven strategies for dose optimization.22
Native IL-7 has a short half-life (7–23 hours) and is rapidly cleared from circulation, limiting its therapeutic application.1–5 In contrast, rhIL-7-hyFc (efineptakin alfa), a long-acting Fc-fused IL-7 (half-life: 61–139 hours), achieves markedly prolonged systemic exposure via FcRn-mediated recycling and sustains robust T-cell expansion with infrequent dosing.24–26 Prior clinical experience with other IL-7 agents (eg, CYT107) has consistently demonstrated substantial lymphocyte increases in cancer and lymphopenic populations.24 Notably, anti-drug antibodies (ADA) were observed following exogenous IL-7 administration in early trials; however, these did not diminish IL-7–induced lymphocyte expansion.24 Preclinical and early-phase clinical studies have demonstrated that rhIL-7-hyFc significantly increases ALC, particularly CD4+ and CD8+ T-cell subsets.25,26 The objective of this study was to characterize the pharmacokinetics (PK) and pharmacodynamics (PD) of rhIL-7-hyFc in patients receiving multiple intramuscular doses. We developed a population PK/PD model to quantitatively describe the relationship between rhIL-7-hyFc exposure and changes in ALC, and conducted Monte Carlo simulations to evaluate the impact of various dosing regimens on ALC trajectories. These analyses aim to support dose selection and inform clinical development of rhIL-7-hyFc in patients with solid tumors.
Materials And Methods
Study Design
Data for the current modeling analysis were obtained from a phase 1b open-label clinical trial evaluating the safety, tolerability, and PK/PD of rhIL-7-hyFc in patients with locally advanced or metastatic solid tumors (NCT03478995). A total of 35 patients were enrolled: 29 were assigned to receive intramuscular injections of escalating doses (0.06, 0.12, 0.24, 0.48, 0.72, 0.96, 1.2, and 1.7 mg/kg; equivalent to 2.8–133.5 mg) every 3 weeks, and 6 patients were assigned to receive 1.2 mg/kg every 6 weeks.
The study received approval from the institutional review boards of Yonsei Cancer Center (IRB approval number: 4–2017-1167), Asan Medical Center (IRB approval number: 2017–1215), and Seoul St. Mary’s Hospital (IRB approval number: KC18MDDF0139), all located in Seoul, Republic of Korea. The reserach was conducted in accordance with the Declaration of Helsinki and the International Conference on Harmonisation of Technical Requirements for Registration of Pharmaceuticals for Human Use-Good Clinical Practice (ICH-GCP) guidelines. Written informed consent was obtained from all participants before enrollment.
Data Sampling and Bioanalytical Assay
Pharmacokinetic sampling was conducted at 0 (pre-dose), 0.5, 6, 12, 24, 48, 72, 168, 336 hours during Cycle 1. Additional blood samples were collected at 504, 672, 840, and 1008 hours. Serum concentrations of total IL-7 (endogenous and rhIL-7-hyFc) were quantified using the Quantikine HS ELISA kit (R&D Systems, Minneapolis, MN), which employs a human IL-7–specific capture antibody and an enzyme-linked detection system. The lower limit of quantitation (LLOQ) was 0.031 ng/mL. As the PD variable, ALC was measured weekly at 0, 168, 336, 504, 672, 840, and 1008 hours. Thereafter, ALC was collected at 1512, 2016, 2520, 3024, 3528, 4032, and 4536 hours. All PK and PD samples were collected from individual trial participants, with each patient considered as an independent observational unit. These measurements represent repeated administrations and longitudinal observations conducted within a single clinical study. Detailed descriptions for bioanalytical assay methods have been published previously.26,27
PK–PD Modeling Analysis
Estimation Methods
Population PK and PK–PD analyses were performed using nonlinear mixed-effects modeling in NONMEM® (version 7.4.3, ICON Development Solutions, Ellicott City, MD, USA), compiled with gFortran on a Windows 10 platform. The ADVAN13 subroutine and the first-order conditional estimation with interaction (FOCE-I) were employed. Data preparation and graphical analyses were conducted using R (version 4.1.3).28 An overview of the workflow for this modeling and simulation is provided in Figure 1.
 |
Figure 1 An overview of the workflow for PK–PD modeling and simulation. |
PK and PD models were developed sequentially. First, the PK model was constructed and parameterized; individual PK parameter estimates were then used as input for PD modeling.29 Various linear and nonlinear compartmental models were evaluated based on statistical criteria and graphical diagnostics, including goodness-of-fit (GOF) plots. To capture the observed time delay between serum rhIL-7-hyFc concentrations and changes in ALC, a previously described semi-mechanistic model was adopted. This model includes a proliferative ALC compartment, three transit compartments representing cell maturation, and a compartment representing circulating lymphocytes. The structural PD model, originally developed by Friberg et al,30 is illustrated in Figure 2.


Inter-occasional variability (IOV) as well as interindividual variability (IIV) were evaluated for each fixed-effect parameter in the PK and PK–PD models.31 The final model was selected based on graphical diagnostics and statistical criteria.32 Nested models were compared using likelihood ratio tests (LRT), assuming differences in −2 log-likelihood (−2LL) follow a chi-square distribution. For base model development without covariates, p < 0.05 (equivalent to a decrease in the minimum objective function value [MOFV] by 3.84; χ² distribution, degree of freedom = 1) was considered statistically significant. The Wald statistic was used to evaluate parameter significance, and 95% confidence intervals (CIs) were estimated from NONMEM output; parameters with CIs excluding zero were considered statistically significant.
Individual PK and PD parameters (Pi) were described using the following exponential error model:

where PTV is the typical value of the parameter, and ηi and ηj are random effects representing IIV and IOV, respectively. Both ηi and ηj were assumed to follow a normal distribution with a mean of zero and estimated variances. To assess parameter precision and stability, a nonparametric bootstrap analysis with 1000 replicates was performed. The 95% CI was obtained using the percentile method.33
Selection of Covariates
A total of 26 demographic and clinical covariates were evaluated for their potential to improve the fit of the PK and PK–PD models. These included: sex, age, body weight, height, smoking status, alcohol consumption, red blood cell (RBC) count, hemoglobin (Hb), hematocrit (Hct), white blood cell (WBC) count, neutrophil (%), lymphocyte (%), monocyte (%), eosinophil (%), basophil (%), platelet count, mean corpuscular hemoglobin (MCH), mean corpuscular hemoglobin concentration (MCHC), absolute neutrophil count (ANC), ALC, prothrombin time (PT), activated partial thromboplastin time (aPTT), PT in international normalization ratio (INR), thyroid-stimulating hormone (TSH), T3 (Triiodothyronine), and free T4 (Thyroxine).
PK and PK–PD models were developed using a stepwise covariate modeling.34 Covariates were retained during forward selection if p < 0.005 (ΔMOFV > 7.88) and removed during backward elimination if p > 0.001 (ΔMOFV > 10.83). After initial univariate screening, covariates yielding the largest MOFV reduction were added sequentially to the base model until no further improvement was observed, forming the full model. Backward elimination was then applied iteratively until only statistically significant covariates remained in the final model.
Model Validation
Internal validation of model adequacy was assessed by comparing observed and model-predicted values through basic GOF diagnostics and individual scatter visual predictive checks (VPC).35 VPCs were performed by simulating 1000 replicates for both PK and PD models. The median predictions and 95% prediction intervals for serum rhIL-7-hyFc concentrations and ALC were plotted and overlaid with observed values.
Monte Carlo Simulation for PK and PD (ALC) of rhIL-7-hyFc Over Time
Based on the MTD and observed changes in ALC, PK–PD simulations were performed to investigate extended dosing intervals of up to 12 weeks for rhIL-7-hyFc. To explore the time-dependent relationship between serum rhIL-7-hyFc concentrations and ALC, Monte Carlo simulations (1000 replicates) were performed for repeated intramuscular administration of rhIL-7-hyFc at doses of 0, 0.05, 0.1, 0.2, 0.4, 0.6, 0.8, 1.0, and 1.2 mg/kg, with dosing intervals of 6,8,9 or 12 weeks. In addition to the dosing intervals evaluated in the clinical study (every 3 or 6 weeks), hypothetical regimens of every 8, 9 and 12 weeks were included in the simulations to explore a broader range of potential dosing schedules. Simulation outcomes were presented as overlay plots of PK and PD profiles over time.
Monte Carlo Simulation to Predict the Exposure–Response Relationship for ALC at Steady State
The exposure (dose)–response relationship between rhIL-7-hyFc and ALC was investigated under the assumption that increases in ALC are associated with clinically meaningful efficacy in patients with cancer. Based on the simulated PK and PD data, the area under the concentration-time curve (AUC) and the area under the effect-time curve (AUEC) at steady state were calculated for each dosing interval. The average rhIL-7-hyFc concentration and average ALC were subsequently derived by normalizing AUC values to the respective dosing interval.
Results
Patient Data
A total of 402 serum concentration measurements and 256 ALC observations of rhIL-7-hyFc were included in this PK–PD modeling analysis. All patients underwent intensive PK sampling from 0 to 72 hours after the first dose. In total, data from 75 treatment cycles across 35 patients with solid tumors were analyzed. All 35 patients contributed PK –PD data during Cycle 1. In Cycle 2, PK –PD data were available for 26 patients (74%), while six patients provided data during Cycle 3. Only one patient had data extending beyond three treatment cycles. Long-term follow-up after repeated dosing could not be obtained, as most patients had late-stage cancer with very short life expectancies.27
Eligible patients were ≥19 years of age with an Eastern Cooperative Oncology Group (ECOG) performance status of 0–1, and adequate hematologic and end organ function. They had histologically confirmed, locally advanced, recurrent, or metastatic solid tumors that were incurable and had failed or were unsuitable for standard therapy. Exclusion criteria included anti-tumor therapy within 3 weeks or prior use of an immune checkpoint inhibitors (ICI) or immunomodulatory antibody within 12 weeks. rhIL-7-hyFc was well tolerated and safe across a dose range of 0.06 to 1.2 mg/kg. Anti-drug antibody development was observed across all doses and dosing intervals; however, it did not impact the safety profile of rhIL-7-hyFc. In the 1.7 mg/kg group, one patient experienced a dose-limiting toxicity (DLT) of ≥grade 3 hypersensitivity, leading to the selection of 1.2 mg/kg as the maximum tolerated dose (MTD).27 Full details of the study design and assessments of safety and immunogenicity have been reported previously.27
Demographic characteristics are summarized in Table 1. The median baseline serum IL-7 concentration was 0.05 ng/mL (range: 0.02–0.23). The median baseline ALC was 1268 cells/μL (range: 341–2453), with 34% of patients (12/35) presenting with ALC >1500 cells/μL and two patients exhibiting severe lymphopenia (ALC <500 cells/μL). The mean age of patient was 58 years (range, 40–75), and 31% (11/35) were classified as elderly (aged >60 years). The sex distribution was approximately balanced; however, notable differences were observed in body weight between males and females. The mean body weight in males was 67 kg (range: 49–110 kg) compared with 55 kg (range: 42–68 kg) in females.
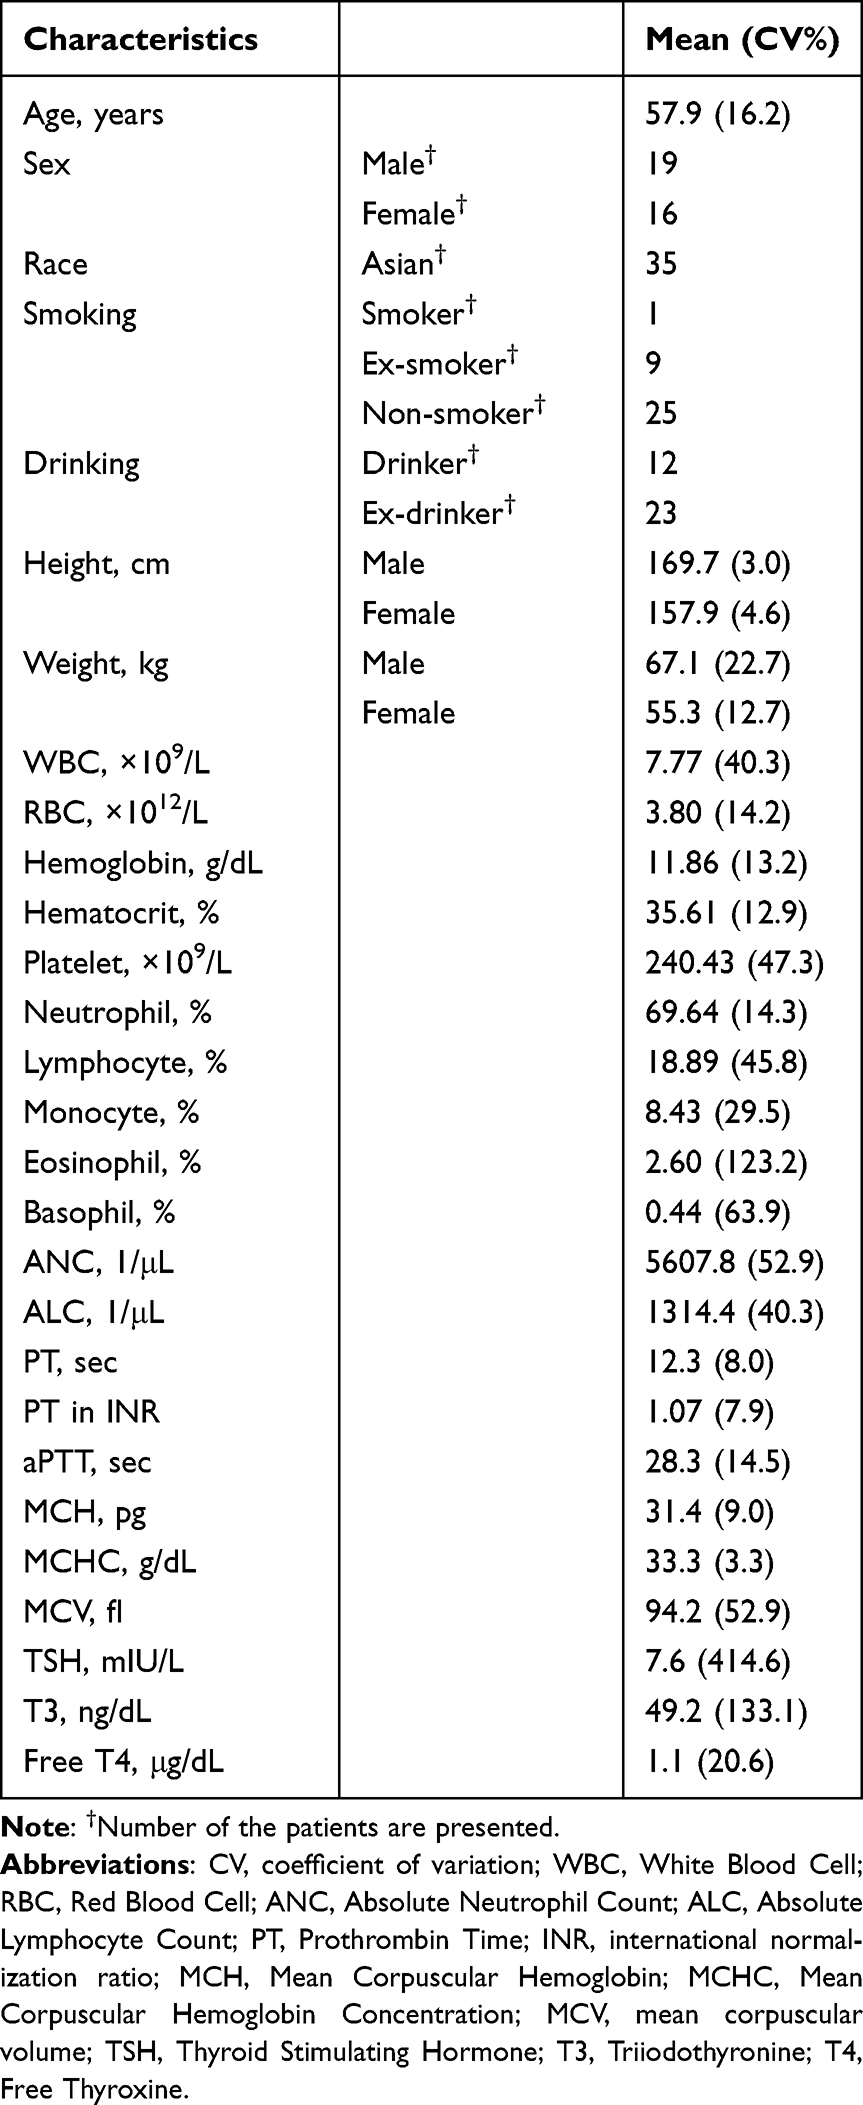 |
Table 1 Demographic and Baseline Information of the Patients with Solid Cancer (n=35) Included in the PK-PD Modeling Analysis |
Pharmacokinetic Model Development
Final Pharmacokinetic Model
The serum concentration-time profile of rhIL-7-hyFc after intramuscular administration in patients with cancer was best described by a two-compartment model with linear disposition kinetics and a combined additive and proportional residual error model. Since the ELISA method used to measure serum drug concentrations does not distinguish between endogenous IL-7 and exogenous rhIL-7-hyFc, baseline (pre-dose) endogenous IL-7 levels were retained in the analysis without substitution or correction, under the assumption that baseline levels remained constant for each individual. Both endogenous IL-7 and rhIL-7-hyFc concentrations were modeled using the same residual error structure, as follows:

Where  is the observed total concentration (endogenous IL-7 + rhIL-7-hyFc);
  is the model-predicted rhIL-7-hyFc concentration; is the observed IL-7 baseline concentration;
  ,
,  , ε1 and
  are random variables normally distributed with zero mean with respective variances. However,
  and ε1 share the same variance, as do
  and ε2, and the random effect
  and
and  persist across all observations for each individual.
Introduction of two depot compartments in the absorption model, where each of the two doses is administered divided by two fractions with a time interval, well described the double peaks during the absorption phase. The model also incorporated IIV in bioavailability. IOV was tested for each fixed effect parameter; inclusion of IOV in clearance (CL) significantly improved model fit. However, due to data limitations, IIV and IOV in CL could not be estimated separately, and a combined random effect parameter was estimated instead.
The PK model indicated that clearance of rhIL-7-hyFc increases approximately 350 hours (14 days) after treatment initiation, leading to reduced average drug concentrations. This time-dependent change was captured by implementing a stepwise increase in CL at an estimated time point (TCLchange) within each patient in the model, using the MTIME feature in NONMEM. Clearance before and after this point was denoted as (CL<TCLchange) and (CL> TCLchange), respectively. Sex was the only covariate influencing CL< TCLchange. The estimated clearance values were 4.82 L/h in females, 12.40 L/h in males (both CL<TCLchange), and 45.80 L/h CL> TCLchange in both sexes. The estimated absorption rate constant (Ka) was 0.341/h, and the apparent steady-state volume of distribution (Vss/F = VC/F+ VP/F) was 16290.0 L. Final PK parameter estimates are summarized in Table 2.
 |
Table 2 Parameter Estimates of the Final Pharmacokinetic Model for rhIL-7-hyFc in Patients with Solid Cancer. (n=35) |
Pharmacokinetic Model Evaluation
Basic GOF plots and individual VPC plots (Figure 3) demonstrated that the final PK model adequately described the observed serum concentration-time data. While slight underprediction was noted around the peak concentration (Cmax) at higher doses after the first administration, the overall predictive performance remained acceptable Residuals were evenly distributed around the line of identity (y=0), with no apparent trends or systematic deviations, indicating that the assumption of normally distributed residuals was met. Standard errors for the estimated PK parameters were generally small, and lower bounds of the 95% confidence intervals, calculated under the assumption of normal distribution, were above zero for most parameters (Table 2), supporting the robustness and precision of the parameter estimates.
Figure 3 Continued. Figure 3 Model prediction versus observation plots for goodness-of-fit for pharmacokinetic model. (A) Basic goodness-of-fit plots for the final PK model of rhIL-7-hyFc. Population predicted concentration is model predicted typical concentration of the population; Individual predicted concentration refers to model predicted individual concentration; Black, dashed lines are reference lines. (B) Representative individual VPC plots of the PK model by dose cohorts: observed concentration over time versus median model prediction and 95% prediction interval. (a) ID = C1010 (Dose = 0.06 mg/kg) (b) ID = C2010 (Dose = 0.12 mg/kg) (c) ID = C3010 (Dose = 0.24 mg/kg) (d) ID = C4010 (Dose = 0.48 mg/kg) (e) ID = C5030 (Dose = 0.72 mg/kg) (f) ID = C6010 (Dose = 0.96 mg/kg) (g) ID = C7010 (Dose = 1.2 mg/kg) (h) ID = C8010 (Dose = 1.7 mg/kg).

Pharmacodynamic Model for Absolute Lymphocyte Count
Final Pharmacodynamic Model
The PD model for ALC was developed sequentially, using individual empirical Bayes estimates of PK parameters obtained from the final PK model. Lymphocyte kinetics were described through a series of compartments representing progenitor cell proliferation, lymphocyte maturation, and circulation in peripheral blood. The model structure comprised one compartment for progenitor cells, three transit compartments to represent the maturation process, and a final compartment for circulating lymphocytes. A feedback mechanism was incorporated to regulate progenitor cell production based on circulating lymphocyte concentrations, as previously described.30 The stimulatory effect of rhIL-7-hyFc on progenitor cell production (denoted as  ) was described using a standard maximum effect model. The dynamics of lymphocyte production and drug stimulation were defined by the following differential equations:


where  is the proliferation rate constant of progenitor cells;
  represents the amount of progenitor cells; is the drug effect; is the circulating lymphocyte count;
  is the baseline lymphocyte count in blood circulation; Kcirc is the transit rate constant. The stimulatory effect of rhIL-7-hyFc was modeled as:
  , where
  is the serum concentration of rhIL-7-hyFc,
  is the maximum stimulatory effect on progenitor cell proliferation, and EC50 is the concentration at which 50% of the maximum effect is achieved.
Including the IOV on any fixed-effect parameter did not improve the model fit. A combined residual error model (additive and proportional) was found to best describe the residual variability. The final PD parameter estimates for ALC are provided in Table 3.
 |
Table 3 Parameter Estimates of Final Pharmacodynamic Model of rhIL-7-hyFc in Patients with Solid Cancer. (n=35) |
Pharmacodynamic Model Evaluation
No systemic bias was observed in basic goodness-of-fit or individual VPC plots (Figure 4), indicating that the PD model adequately describes the observed ALC over time. The 95% confidence intervals for all parameter estimates, constructed using the normal distribution assumption, did not include zero, further supporting the robustness of the model.
Figure 4 Continued. Figure 4 Model prediction versus observation plots for goodness-of-fit for pharmacodynamic model. (A) Basic goodness-of-fit plots for the final PD model of ALC. Population predicted ALC is model predicted typical value of ALC level in the population; Individual predicted ALC refers to model predicted individual ALC level; Black, dashed lines are reference lines. (B) Representative individual VPC plots for PD model of ALC by dose cohorts: Observed ALC over time with median prediction and 95% prediction interval. (a) ID = C1010 (Dose = 0.06 mg/kg) (b) ID = C2010 (Dose = 0.12 mg/kg) (c) ID = C3010 (Dose = 0.24 mg/kg) (d) ID = C4010 (Dose = 0.48 mg/kg) (e) ID = C5030 (Dose = 0.72 mg/kg) (f) ID = C6010 (Dose = 0.96 mg/kg) (g) ID = C7010 (Dose = 1.2 mg/kg) (h) ID = C8010 (Dose = 1.7 mg/kg).

Monte Carlo Simulation for Evaluation of Optimal Dose Regimens
Serum rhIL-7-hyFc Concentration and Absolute Lymphocyte Count Over Time
Simulations revealed a consistent pharmacological effect of rhIL-7-hyFc on ALC, with increases observed even at the lowest simulated dose of 0.05 mg/kg administered every 12 weeks. Representative simulated profiles of serum rhIL-7-hyFc concentrations and ALC following multiple intramuscular doses of 0.6 mg/kg and 1.2 mg/kg every 12 weeks are shown in Figure 5.
 |
Figure 5 Representative simulated serum concentration and ALC over time plots. (a) 1.2mg/kg Intramuscular Injection Every 12 Weeks. (b) 0.6 mg/kg Intramuscular Injection Every 12 Weeks. |
Exposure–Response Relationship Between rhIL-7-hyFc and Absolute Lymphocyte Count
At simulated steady-state for the longest dosing interval, the lowest simulated dose (0.05 mg/kg every 12 weeks) resulted in predicted serum IL-7 concentrations of 0.05 ng/mL, which remained close to the estimated EC50 of 0.066 ng/mL. At the maximum tolerated dose (1.2 mg/kg) administered every 12 weeks, the predicted concentration was markedly higher (1.09 ng/mL) than the estimated EC90 of 0.594 ng/mL. Notably, at the longest dosing interval, the lowest dose approaching EC90 was 0.6 mg/kg, with a predicted concentration of 0.54 ng/mL (Figure 6).
 |
Figure 6 Dose-Response Relationship. Predicted exposure–ALC relationship at steady state after multiple intramuscular injections of rhIL-7-hyFc at various doses. (a) Predicted ALC Administered Every 12 Weeks. (b) Predicted ALC Administered Every 6 Weeks. |
Monte Carlo simulations based on the final PK–PD model demonstrated a dose-dependent increase in ALC. At steady state, average ALC levels exceeded 1500 cells/μL across all the evaluated regimens, and administration of 0.6–1.2 mg/kg every 6–12 weeks increased ALC from baseline by more than 1000 cells/μL (+1088 to +1802 cells/μL). A steep rise in ALC was predicted between 0 and 0.6 mg/kg, with a plateauing trend at doses above 0.6 mg/kg. With intramuscular administration every 6 or 12 weeks, simulation predicted steady-state mean ALCs of 2439–2898 cells/μL at 0.6 mg/kg (increases of +1088 and +1535 from baseline, respectively) and 2716–3165 cells/μL at 1.2 mg/kg (additional increases of +276 and +267 relative to 0.6 mg/kg, respectively).
Although the estimated clearance rose from 12.4 L/h (male) and 4.82 L/h (female) to 45.80 L/h (both male and female) during repeated dosing (Table 2)., the predicted steady-state average concentrations across most evaluated regimens exceeded the estimated EC50 of 0.066 ng/mL, indicates high potency. The increase in clearance was not dose-dependent, as no correlation was observed between Bayesian-estimated individual clearance and the administered dose. While sex was a statistically significant covariate associated with clearance, the predicted ALC levels were comparable between males and females (2723 and 2709 cells/μL, respectively, at 1.2 mg/kg every 12 weeks), suggesting limited clinical relevance.
Based on these results, intramuscular administration of 0.6–1.2 mg/kg every 6 to 12 weeks was proposed as the optimal dosing range for further clinical evaluation. The predicted exposure–response relationships at steady state from intramuscular administration every 6 or 12 weeks are illustrated in Figure 6.
Discussion
Intramuscular administration of rhIL-7-hyFc increased ALC in a dose-dependent manner, consistent with its mechanism of action. Although serum rhIL-7-hyFc concentrations increased with higher doses, further increases in ALC were minimal, indicating a plateau effect. This plateau is consistent with the maximum effect PD model, in which saturable stimulation of progenitor proliferation and homeostatic feedback collectively constrain lymphocyte expansion despite rising drug exposure. The low EC90 value (0.594 ng/mL), approximately 9 times the EC50 as derived from a Emax model, aligns with a plateau in response at relatively low dose levels. These dynamics suggest that at dose levels beyond the plateau, further increases in drug concentration produce only minimal ALC responses, thereby attenuating fluctuations in ALC.
Traditionally, oncology dose-finding studies have determined the MTD based on DLTs, and this dose was carried forward into later-phase trials. However, many modern targeted and immuno-oncology agents often demonstrate different dose-response relationships with wider therapeutic indices compared to cytotoxic chemotherapy, such that doses below the MTD may have similar activity with fewer toxicities.36 Accordingly, dose selection should prioritize quantitative exposure–response analyses to identify an optimal biological dose at which biomarker or clinical responses approach their near-maximal levels, rather than defaulting to the MTD.37,38 When the exposure–response curve shows a clear plateau, the EC90—concentration achieving 90% of the maximal effect—can be estimated from a fitted exposure–response model near the asymptote and regarded as a biologically effective dose for subsequent clinical development.39,40
In this study, exploration of a wide dose range—including lower doses—enabled reliable characterization of the exposure (dose)–response relationship and robust estimation of key parameters such as EC50. The simulation results demonstrated that the concentration range between the simulated plateau-reaching dose (defined as the dose at EC90) and the observed MTD (1.2 mg/kg) was 0.54–2.37 ng/mL, corresponding to doses of 0.6–1.2 mg/kg administered every 6 or 12 weeks. Within this range, the predicted steady-state average ALCs exceeded 2500 cells/μL, representing an approximately 1.8- to 2.3-fold increase from baseline. Accordingly, a dosing regimen of 0.6–1.2 mg/kg every 6 to 12 weeks is proposed as the optimal dosing range for RP2D, which is expected to achieve clinically meaningful immune reconstitution in patients with cancer. These findings are consistent with recent clinical studies reporting that rhIL-7-hyFc induces sustained lymphocyte responses.41–43
This study has several limitations. First, most patients (77%, 27/35) received one or two doses, and only one patient received long-term treatment (nine dosing cycles every 3 weeks), with final PK and PD samples collected at 6.4 months and 9.5 months, respectively, after the first dose. Consequently, data for long-term treatment were limited allowing estimation of IOV across cycles, restricting validation of the PK/PD using observed data. Second, only ALC was used as the PD marker, although other immune cell subsets, including tumor-infiltrating lymphocytes such as CD4+ and CD8+ T cells, may follow different kinetic patterns. Mechanism-based modeling using these subtypes as biomarkers predictive of treatment response would offer a more refined and individualized understanding of treatment effect. Furthermore, external validation across different tumour types and linkage to clinically relevant outcomes, such as survival or immune-response endpoints, are needed before the RP2D can be considered definitive.
Despite these limitations, this study highlights the novelty of applying population PK–PD modeling to characterize rhIL-7-hyFc in patients with solid tumors. This approach enabled pharmacological characterization of long-acting IL-7 and clarified the relationship between drug exposure and ALC of immune activation. The key findings—a dose-dependent increase in ALC, a low EC50 estimate, and rational identification of an appropriate dosing range—were consistently supported by VPCs, bootstrap confidence intervals, and Monte Carlo simulations. The plateau in ALC observed beyond 0.6 mg/kg corresponded to the Emax relationship predicted by the model, reinforcing the internal validity of the analysis. In light of the limited clinical data on long-acting IL-7 and its potential role in mitigating treatment-related lymphopenia, these findings support a promising extended-interval dosing strategy with meaningful implications for cancer immunotherapy.
Conclusion
A population PK–PD model was successfully developed to describe the pharmacokinetics and pharmacodynamics of rhIL-7-hyFc in patients with solid tumors, using ALC as a exploratory biomarker in early clinical trials. Simulations following repeated intramuscular dosing demonstrated a clear exposure–response relationship, indicating that rhIL-7-hyFc exerts its pharmacologic effect at relatively low doses with sufficient duration to sustain elevated ALC levels across regimens, including intervals of up to 12 weeks. These results provide quantitative insights to support the selection of optimal dosing strategies. The proposed dosing range is a modeling-driven recommendation intended to inform the selection of a recommended phase 2 dose (RP2D).
Abbreviations
ALC, absolute lymphocyte counts; ANC, absolute neutrophil count; aPTT, activated partial thromboplastin time; AUC, area under the concentration; AUEC, area under the effect-time curve; CI, confidence interval; CL, Clearance; Cmax, Maximum Concentration; CV coefficient of variation; DLT, dose-limiting toxicity; EC50, half-maximum effective concentration; ECOG, Eastern Cooperative Oncology Group; FOCE-I, first-order conditional estimation with interaction; GOF, goodness of fit; Hb, hemoglobin; Hct, hematocrit; ICI, immune checkpoint inhibitors; IIV inter-individual variabilities; IL-7, Interleukin-7; INR, international normalization ratio; IOV inter-occasional variabilities; MCHC, mean corpuscular hemoglobin concentration; MCH, mean corpuscular hemoglobin; MOFV, minimized objective function value; MTD, maximum tolerated dose; NONMEM, nonlinear mixed-effects modeling; PK–PD, pharmacokinetic–pharmacodynamic; PT, prothrombin time; RBC, red blood cell; RP2D, recommended phase 2 dose; T4, thyroxine; T3, triiodothyronine; TSH, thyroid-stimulating hormone; VPC, visual predictive checks; WBC, white blood cell.
Data Sharing Statement
The datasets analyzed in the present study are not publicly available because of proprietary considerations and confidentiality restrictions. The analysis code is available from the corresponding author upon reasonable request.
Disclosure
Mi-Sun Byun and Donghoon Choi were employed by Genexine, Inc. and NeoImmuneTech, Inc., respectively. The remaining authors declare that the research was conducted without any commercial or financial relationships that could be construed as a potential conflict of interest.
References
1. Mazzucchelli R, Durum SK. Interleukin-7 receptor expression: intelligent design. Nat Rev Immunol. 2007;7(2):144–154. doi:10.1038/nri2023
2. Fry TJ, Mackall CL. The many faces of IL-7: from lymphopoiesis to peripheral T cell maintenance. J Immunol. 2005;174(11):6571–6576. doi:10.4049/jimmunol.174.11.6571
3. Lundström W, Fewkes NM, Mackall CL. IL-7 in human health and disease. Semin Immunol. 2012;24(3):218–224. doi:10.1016/j.smim.2012.02.005
4. Mackall CL, Fry TJ, Gress RE. Harnessing the biology of IL-7 for therapeutic application. Nat Rev Immunol. 2011;11(5):330–342. doi:10.1038/nri2970
5. Sportès C, Babb RR, Krumlauf MC, et al. Phase I study of recombinant human interleukin-7 administration in subjects with refractory malignancy. Clin Cancer Res. 2010;16(2):727–735. doi:10.1158/1078-0432.CCR-09-1547
6. Pellegrini M, Calzascia T, Toe JG, et al. IL-7 engages multiple mechanisms to overcome chronic viral infection and limit organ pathology. Cell. 2011;144(4):601–613. doi:10.1016/j.cell.2011.01.011
7. Levy Y, Sereti I, Tambussi G, et al. Effects of recombinant human interleukin 7 on T-cell recovery and thymic output in HIV-infected patients receiving antiretroviral therapy: results of a phase I/IIa randomized, placebo-controlled, multicenter study. Clin Infect Dis. 2012;55(2):291–300. doi:10.1093/cid/cis321
8. Rosenberg SA, Sportès C, Ahmadzadeh M, et al. IL-7 administration to humans leads to expansion of CD8+ and CD4+ cells but a relative decrease of CD4+ T-regulatory cells. J Immunother. 2006;29(3):313–319. doi:10.1097/01.cji.0000210375.71710.74
9. Trédan O, Ménétrier-Caux C, Ray-Coquard I, et al. ELYPSE-7: a randomized placebo-controlled phase IIa trial with CYT107 exploring the restoration of CD4+ lymphocyte count in lymphopenic metastatic breast cancer patients. Ann Oncol. 2015;26(7):1353–1362; Epub 2015 Apr 7. Erratum in: Ann Oncol. 2018 Feb 1;29(2):523. doi: 10.1093/annonc/mdx058. doi: 10.1093/annonc/mdv173
10. Ray-Coquard I, Cropet C, Van Glabbeke M, et al; European Organization for Research and Treatment of Cancer Soft Tissue and Bone Sarcoma Group. Lymphopenia as a prognostic factor for overall survival in advanced carcinomas, sarcomas, and lymphomas. Cancer Res. 2009; 69(13):5383–5391. doi:10.1158/0008-5472.CAN-08-3845
11. Grossman SA, Ellsworth S, Campian J, et al. Survival in patients with severe lymphopenia following treatment with radiation and chemotherapy for newly diagnosed glioblastoma. J Neurooncol. 2011;102(1):167–171. doi:10.1007/s11060-010-0309-x
12. Campian JL, Ye X, Brock M, Grossman SA. Treatment-related lymphopenia in patients with stage III non–small-cell lung cancer. Cancer Invest. 2013;31(3):183–188. doi:10.3109/07357907.2013.767371
13. Cho Y, Park S, Byun HK, et al. Impact of treatment-related lymphopenia on immunotherapy for advanced non-small cell lung cancer. Int J Radiat Oncol Biol Phys. 2019;105(5):1065–1073. doi:10.1016/j.ijrobp.2019.09.013
14. Wild AT, Ye X, Ellsworth SG, et al. The association between chemoradiation-related lymphopenia and clinical outcomes in patients with locally advanced pancreatic adenocarcinoma. Am J Clin Oncol. 2015;38(3):259–265. doi:10.1097/COC.0b013e3182940ff9
15. Campian JL, Sarai G, Ye X, et al. Association between severe treatment-related lymphopenia and progression-free survival in patients with newly diagnosed squamous cell head and neck cancer. Head Neck. 2014;36(12):1747–1753. doi:10.1002/hed.23535
16. Mackall CL, Fleisher TA, Brown MR, et al. Age, thymopoiesis, and CD4+ T-lymphocyte regeneration after intensive chemotherapy. N Engl J Med. 1995;332(3):143–149. doi:10.1056/NEJM199501193320303
17. Postow MA, Chasalow SD, Kuk D, et al. Absolute lymphocyte count as a prognostic biomarker for overall survival in patients with advanced melanoma treated with ipilimumab. Melanoma Res. 2020;30(1):71–75. doi:10.1097/CMR.0000000000000633
18. Ho WJ, Yarchoan M, Hopkins A, et al. Association between pretreatment lymphocyte count and response to PD1 inhibitors in head and neck squamous cell carcinomas. J Immunother Cancer. 2018;6(1):84. doi:10.1186/s40425-018-0395-x
19. Sereti I, Dunham RM, Spritzler J, et al. IL-7 administration drives T cell–cycle entry and expansion in HIV-1 infection. Blood. 2009;113(25):6304–6314. doi:10.1182/blood-2008-10-184622
20. Lim HS, Kim SJ, Noh YH, et al. Exploration of optimal dosing regimens of haloperidol, a D2 antagonist, via modeling and simulation analysis in a D2 receptor occupancy study. Pharm Res. 2013;30(3):683–693. doi:10.1007/s11095-012-0906-2
21. Lim HS. Evolving role of modeling and simulation in drug development. Transl Clin Pharmacol. 2019;27(1):19–23. doi:10.12793/tcp.2019.27.1.19
22. Ruiz-Garcia A, Baverel P, Bottino D, et al. A comprehensive regulatory and industry review of modeling and simulation practices in oncology clinical drug development. J Pharmacokinet Pharmacodyn. 2023;50(3):147–172. doi:10.1007/s10928-023-09850-2
23. FDA OCP guidance, optimizing the dosage of human prescription drugs and biological products for the treatment of oncologic diseases. 2024. Available from: https://www.fda.gov/regulatory-information/search-fda-guidance-documents/optimizing-dosage-human-prescription-drugs-and-biological-products-treatment-oncologic-diseases.
24. Park JH, Lee SW, Choi D, Lee C, Sung YC. Harnessing the power of IL-7 to boost T cell immunity in experimental and clinical immunotherapies. Immune Netw. 2024;24(1):e9. doi:10.4110/in.2024.24.e9
25. Kim MY, Jayasinghe R, Devenport JM, et al. A long-acting interleukin-7, rhIL-7-hyFc, enhances CAR T cell expansion, persistence, and anti-tumor activity. Nat Commun. 2022;13(1):3296. doi:10.1038/s41467-022-30860-0
26. Lee SW, Choi D, Heo M, et al. hIL-7-hyFc, A long-acting IL-7, increased absolute lymphocyte count in healthy subjects. Clin Transl Sci. 2020;13(6):1161–1169. doi:10.1111/cts.12800
27. Kim GM, Kim S, Lee MA, et al. GX-I7, a long-acting IL-7, safely and effectively increased peripheral CD8+/CD4+ T cells and TILs in patients with locally advanced or metastatic solid tumours. Br J Cancer. 2025;133(4):524–532. doi:10.1038/s41416-025-03069-3
28. R Core Team. R: A Language and Environment for Statistical Computing. R Foundation for Statistical Computing, Vienna, Austria. 2022. Available from: Https://Www.R-Project.org/.
29. Zhao L, Ji P, Li Z, et al. The antibody drug absorption following subcutaneous or intramuscular administration and its mathematical description by coupling physiologically based absorption process with the conventional compartment pharmacokinetic model. J Clin Pharmacol. 2013;53(3):314–325. doi:10.1002/jcph.4
30. Friberg LE, Henningsson A, Maas H, et al. Model of chemotherapy-induced myelosuppression with parameter consistency across drugs. J Clin Oncol. 2002;20(24):4713–4721. doi:10.1200/JCO.2002.02.140
31. Karlsson MO, Sheiner LB. The importance of modeling interoccasion variability in population pharmacokinetic analyses. J Pharmacokinet Biopharm. 1993;21(6):735–750. doi:10.1007/BF01113502
32. Acta Universitatis Upsaliensis. Methodological Studies on Covariate Model Building in Population Pharmacokinetic-Pharmacodynamic Analysis. 2002:ISSN0282–7484,280
33. Baverel PG, Savic RM, Karlsson MO. Two bootstrapping routines for obtaining imprecision estimates for nonparametric parameter distributions in nonlinear mixed effects models. J Pharmacokinet Pharmacodyn. 2011;38(1):63–82. doi:10.1007/s10928-010-9177-x
34. Wählby U, Jonsson EN, Karlsson MO. Comparison of stepwise covariate model building strategies in population pharmacokinetic-pharmacodynamic analysis. AAPS Pharm Sci. 2002;4(4):E27. doi:10.1208/ps040427
35. Karlsson MO, Savic RM. Diagnosing model diagnostics. Clin Pharmacol Ther. 2007;82(1):17–20. doi:10.1038/sj.clpt.6100241
36. Glasmacher A, Garralda E, Gwaltney C, et al. Dose optimization in cancer drug development: review and outcome of a multi-stakeholder workshop. Eur J Cancer. 2025;226:115593. doi:10.1016/j.ejca.2025.115593
37. Laird G, Xu L, Liu M, et al. Beyond exposure-response: a tutorial on statistical considerations in dose-ranging studies. Clin Transl Sci. 2021;14(4):1250–1258. doi:10.1111/cts.12998
38. Ball K, Dovedi SJ, Vajjah P, et al. Strategies for clinical dose optimization of T cell-engaging therapies in oncology. MAbs. 2023;15(1):2181016. doi:10.1080/19420862.2023.2181016
39. Fraisse J, Dinart D, Tosi D, et al. Optimal biological dose: a systematic review in cancer phase I clinical trials. BMC Cancer. 2021;21(1):60. doi:10.1186/s12885-021-07782-z
40. Sachs JR, Mayawala K, Gadamsetty S, et al. Optimal dosing for targeted therapies in oncology: drug development cases leading by example. Clin Cancer Res. 2016;22(6):1318–1324. doi:10.1158/1078-0432.CCR-15-1295
41. Ramaswami R, Kask AS, D’Amico L, et al. Phase I study of efineptakin alfa (NT-I7) for the treatment of kaposi sarcoma. J Immunother Cancer. 2025;13(2):e010291. doi:10.1136/jitc-2024-010291
42. Campian JL, Grossman SA, Kask AS, et al. Phase I study of NT-I7, a long-acting interleukin-7, in severe treatment-related lymphopenia following standard radiation and temozolomide for high-grade glioma. Neurooncol Adv. 2025;7(1):vdaf117. doi:10.1093/noajnl/vdaf117
43. Ahn S, Park JS, Kim H, et al. Compassionate use of recombinant human IL-7-hyFc as a salvage treatment for restoring lymphopenia in patients with recurrent glioblastoma. Cancer Med. 2023;12(6):6778–6787. doi:10.1002/cam4.5467
 © 2025 The Author(s). This work is published and licensed by Dove Medical Press Limited. The
full terms of this license are available at https://www.dovepress.com/terms
and incorporate the Creative Commons Attribution
- Non Commercial (unported, 4.0) License.
By accessing the work you hereby accept the Terms. Non-commercial uses of the work are permitted
without any further permission from Dove Medical Press Limited, provided the work is properly
attributed. For permission for commercial use of this work, please see paragraphs 4.2 and 5 of our Terms.
© 2025 The Author(s). This work is published and licensed by Dove Medical Press Limited. The
full terms of this license are available at https://www.dovepress.com/terms
and incorporate the Creative Commons Attribution
- Non Commercial (unported, 4.0) License.
By accessing the work you hereby accept the Terms. Non-commercial uses of the work are permitted
without any further permission from Dove Medical Press Limited, provided the work is properly
attributed. For permission for commercial use of this work, please see paragraphs 4.2 and 5 of our Terms.