Back to Journals » International Journal of Nanomedicine » Volume 12
Polysaccharide-based nanoparticles for co-loading mitoxantrone and verapamil to overcome multidrug resistance in breast tumor
Authors Xu Y ![]() , Asghar S, Gao S, Chen Z, Huang L
, Asghar S, Gao S, Chen Z, Huang L ![]() , Yin L
, Yin L ![]() , Ping Q, Xiao Y
, Ping Q, Xiao Y
Received 5 July 2017
Accepted for publication 7 September 2017
Published 10 October 2017 Volume 2017:12 Pages 7337—7350
DOI https://doi.org/10.2147/IJN.S145620
Checked for plagiarism Yes
Review by Single anonymous peer review
Peer reviewer comments 2
Editor who approved publication: Prof. Dr. Dongwoo Khang
Yurui Xu,1 Sajid Asghar,2 Shiya Gao,1 Zhipeng Chen,3 Lin Huang,1 Lining Yin,1 Qineng Ping,1 Yanyu Xiao1
1Department of Pharmaceutics, State Key Laboratory of Natural Medicines, China Pharmaceutical University, Nanjing, People’s Republic of China; 2Faculty of Pharmaceutical Sciences, Government College University Faisalabad, Faisalabad, Pakistan; 3Department of Pharmacy, Nanjing University of Chinese Medicine, Nanjing, People’s Republic of China
Abstract: The aim of this study was to evaluate the potential of polyelectrolyte complex nanoparticles (PENPs) based on hyaluronic acid/chitosan hydrochloride (HA/HCS) for co-loading mitoxantrone (MTO) and verapamil (VRP) to overcome multidrug resistance in breast tumors. PENPs co-loaded with MTO and VRP (MTO-VRP-PENPs) were affected by the method of preparation, molecular weight of HA, mass ratios and initial concentrations of HA/HCS, pH, and drug quantities. Optimized MTO-VRP-PENPs were ~209 nm in size with a zeta potential of approximately −24 mV. Encapsulation efficiencies (%) of MTO and VRP were 98.33%±0.27% and 44.21%±8.62%, respectively. MTO and VRP were successfully encapsulated in PENPs in a molecular or amorphous state. MTO-VRP-PENPs showed significant cytotoxicity in MCF-7/ADR cells in contrast to MTO-loaded PENPs (MTO-PENPs). The reversal index of MTO-VRP-PENPs was 13.25 and 10.33 times greater than that of the free MTO and MTO-PENPs, respectively. In conclusion, MTO-VRP-PENPs may serve as a promising carrier to overcome tumor drug resistance.
Keywords: hyaluronic acid, chitosan hydrochloride, mitoxantrone hydrochloride, verapamil hydrochloride, co-delivery, multidrug resistance
Introduction
Breast cancer, the most common invasive malignancy in women worldwide, is the second leading cause of cancer-related death after lung cancer. Currently, the main treatment for breast cancer is surgical resection with the combination of chemotherapy and radiotherapy. Mitoxantrone (MTO), a cell cycle nonspecific anticancer drug, can kill cancer cells in any cell cycle by inhibiting DNA replication and transcription. It has been clinically approved in the treatment of breast cancer, acute leukemia, hepatocellular carcinoma, and malignant lymphoma.1
Despite significant progress in early diagnosis and treatment, inadequate selection of anticancer drugs and multidrug resistance (MDR) to conventional chemotherapeutics continuously pose a tremendous challenge to effective breast cancer therapy.2 Particularly, drug resistance is a major obstacle in the treatment of breast cancer and may potentially lead to tumor relapse and the failure of therapy.3 In physiological conditions, P-glycoprotein (P-gp) is mainly responsible for the transport of toxic chemicals out of the cell for its protection. While, in pathological conditions, P-gp is overexpressed in tumor cells and takes part in MDR.4 Because of the intimate relationship with MDR, P-gp has been widely studied as an important target for MDR reversal in recent years. Verapamil (VRP), a calcium antagonist, was reported to reverse MDR by Tsuruo et al.5 The MDR reversal mechanism was later demonstrated to involve both substrate competitive inhibition and gene regulation in the gene transcription process.6 In addition, VRP has also been reported to inhibit the activation of Scr kinase family to suppress tumor growth.7 However, P-gp not only exists in tumor tissues but also is widely distributed in the kidney, liver, adrenal glands, blood–brain barrier, and gastrointestinal tract, leading to unpredictable pharmacokinetic changes and adverse reactions.
There is growing interest in developing multi-agent co-delivery nanocarriers that can simultaneously incorporate and deliver multiple types of therapeutic drugs to disease sites in a targeted and controlled manner for combined therapy. These co-delivery nanocarriers may potentially allow synergetic effects of different therapeutic approaches to eventually improve overall treatment outcomes. Therefore, nanocarriers co-loaded with MTO and VRP could reverse MDR and reduce side effects. Polyelectrolyte complex nanoparticles (PENPs) are formed when two oppositely charged polyelectrolytes interact via electrostatic attraction and desolvation. PENPs have demonstrated great potential in biomedical and nano-biotechnological applications, including controlled drug release, good biocompatibility, and gene transfection.8 In this study, chitosan hydrochloride (HCS) was chosen as the cationic material owing to the abundance of positively charged terminal amine groups and better water solubility than chitosan (CS). Hyaluronic acid (HA) was chosen as the polyanion due to its negative charge in neutral and alkaline environments and tumor-targeting property through specific binding to the CD44 molecule, an integral membrane glycoprotein overexpressed on the surface of various tumor cells.9–12
In the current study, PENPs were prepared using HCS and HA to simultaneously encapsulate positively charged MTO and neutral VRP (Figure 1) to enhance the selectivity of MTO and reverse the MDR of cancer cells. Key properties such as particle size, zeta potential, morphology, and encapsulation efficiency (EE%) and drug loading (DL%) of MTO and VRP were characterized. In vitro drug release was studied to explore the drug release pattern. Using doxorubicin hydrochloride (DOX) hydrochloride as a fluorescence probe, the cellular uptake of PENPs in both human breast cancer cell line MCF-7 and its adriamycin-resistant strain (MCF-7/ADR cell line) was investigated to explore the tumor-targeting and MDR suppression efficiency of the preparations. Cell retention rate (RR) of the preparations in MCF-7/ADR cell line was calculated to evaluate the MDR reversal effect of the preparation. Furthermore, the exact location of the preparation in cancer cells after being taken in was inspected by means of confocal laser scanning microscopy (CLSM).
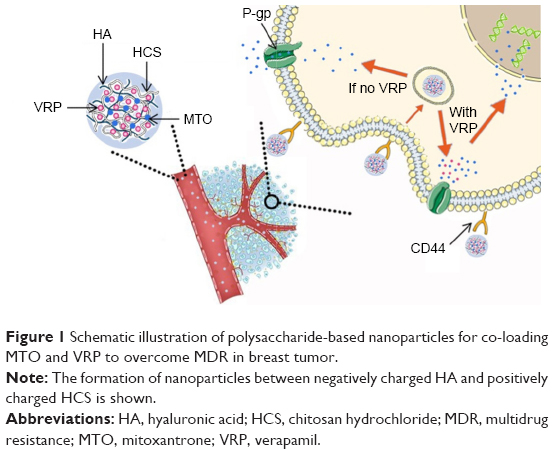 | Figure 1 Schematic illustration of polysaccharide-based nanoparticles for co-loading MTO and VRP to overcome MDR in breast tumor. |
Materials and methods
MTO (purity, 98%), VRP (purity, 98%), and DOX (purity, 98%) were purchased from Sunnyhope Pharmaceutical Co., Ltd. (Sichuan, China), Huamaike Biotechnology Co., Ltd. (Beijing, China), and Aladdin Reagent Co., Ltd. (Shanghai, China), respectively. HCS (molecular weight [MW] =100 kDa determined by viscometry; degree of deacetylation 86% determined by 1H-nuclear magnetic resonance [NMR] spectroscopy) was purchased from Golden-Shell Biochemical Co., Ltd. (Zhejiang, China). HA (MW =10 kDa, 50 kDa, 120 kDa, and 500 kDa, determined by viscometry) was purchased from C.P. Freda Pharmaceutical Co., Ltd. (Shandong, China). The 3(4,5-dimethylthiazol-2-yl)-2,5-diphenyltetrazolium bromide (MTT) was purchased from Sigma-Aldrich Co. (St Louis, MO, USA). All other chemicals and reagents were of analytical grade and used without further purification.
Preparation of PENPs co-loaded with MTO and VRP (MTO-VRP-PENPs) and MTO-loaded PENPs (MTO-PENPs)
Different PENPs were prepared according to our previous work with slight modifications.13 In brief, 2 mg/mL solutions of HA and HCS were prepared in deionized water and filtered through 0.45 μm microporous membranes. Blank PENPs were prepared by simply mixing the abovementioned solutions with a 6:1 volume ratio of HA:HCS. The mixture was kept stirring (400 rpm) for 2 h followed by filtration through a 0.45 μm filter. To prepare MTO-VRP-PENPs, MTO was added to the HA solution to obtain the concentration of 0.3 mg/mL of MTO (MTO-HA solution), and pH of the solution was adjusted to 4.0; VRP was added to the HCS solution to attain the concentration of 2 mg/mL of VRP (VRP-HCS solution). MTO-HA solution was added dropwise into the VRP-HCS solution under magnetic stirring (400 rpm) at 25°C, and the resultant opalescent preparation was further stirred for 2 h to form MTO-VRP-PENPs. MTO-PENPs were prepared using the same procedure but without the addition of VRP.
Changes in the properties of blank PENPs were monitored for the changes in initial concentrations of HA and HCS solutions, MW of HA, and mass ratio of HA to HCS. The order of drug addition was also investigated in the formation of drug-loaded PENPs: if MTO or VRP was dissolved in HA solution and then mixed with HCS solution to obtain MTO loaded PENPs or VRP loaded PENPs (HMC-PENPs/HVC-PENPs); CMH-PENPs/CVH-PENPs if MTO or VRP was dissolved in HCS solution and then mixed with HA solution; if MTO or VRP were added into blank PENPs to obtain MTO-loaded PENPs or VRP-loaded PENPs (CHM-PENPs/CHV-PENPs). In addition, drug concentration, pH, and mixing time were also investigated.
Characterization of MTO-VRP-PENPs and MTO-PENPs
The particle size, polydispersity index (PI), and zeta potential of different PENPs were analyzed by Zetasizer 3000HS (Malvern Instruments, Malvern, UK). MTO-VRP-PENPs’ morphological observation was performed by transmission electron microscopy (TEM; H-7000; Hitachi Ltd., Tokyo, Japan). EE% and DL% were determined by the ultrafiltration method. In brief, 1 mL of MTO-VRP-PENPs or MTO-PENPs was transferred to an ultrafiltration centrifuge tube (MW cutoff [MWCO] of 100 kDa) and centrifuged for 30 min at 10,000 rpm. Approximately 100 μL of the filtrate dissolved in 10 mL of mobile phase was analyzed by Agilent 1100 series high-performance liquid chromatography (HPLC) system (Agilent Technologies, Palo Alto, CA, USA) for measuring MTO and VRP concentrations. In addition, 100 μL of PENPs dissolved in 10 mL of mobile phase was sonicated for 5 min followed by centrifugation for 10 min at 12,000 rpm. The supernatant was analyzed by HPLC for MTO and VRP. The stationary phase, μBondapak C18 column (150×4.6 mm, 5 μm), was kept at 40°C. The mobile phase for MTO was a 48:52 v/v mixture of methanol:0.2 mol/L ammonium acetate aqueous solution (pH adjusted to 2 by H3PO4), and effluent was monitored at 241 nm. The mobile phase of VRP was a 55:45:1 v/v mixture of acetic acid/sodium acetate buffer solution (1.36 g sodium acetate and 33 mL glacial acetic acid and volume made up to 1,000 mL):methanol:triethylamine, and effluent was monitored at 278 nm. The flow rate was set at 1.0 mL/min, and the injection volume was 20 μL. The EE% and DL% were calculated as follows:
|
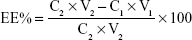
where C1 and V1 are the concentrations of the drug and the volume in the filtration tube after ultrafiltration, respectively, and C2 and V2 are the concentrations of the drug and the preparation volume before ultrafiltration, respectively.
|
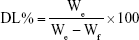
where We is the amount of the drug in PENPs, and Wf is the amount of the feeding materials.
Differential scanning calorimetry (DSC) analysis
The thermal properties of MTO and VRP in the finalized formulation of MTO-VRP-PENPs were assessed using a Thermal Analyzer-60 WS, DSC-60 (Shimadzu, Kyoto, Japan). DSC patterns of MTO, VRP, blank PENPs, the physical mixture of VRP, MTO, and blank PENPs, and MTO-VRP-PENPs were tested in 20 mL/min N2 and at 10 K/min heating rate.
In vitro release study
The in vitro release behavior of MTO-VRP-PENPs was carried out in 5% (w/v) glucose solution (pH 7.4) using a dialysis method as reported previously.13 Briefly, 1 mL of MTO-VRP solution (the same quantities of MTO and VRP were dissolved in deionized water) and MTO-VRP-PENPs (CMTO =0.3 mg/mL, CVRP =0.3 mg/mL) were transferred into dialysis bags (MWCO of 8–12 kDa) with both terminals clamped. The dialysis bags were immediately immersed into 50 mL of glucose solution under magnetic stirring in a water bath (250 rpm, 37°C). At specific intervals, 1 mL of the medium was withdrawn and replaced with 1 mL of fresh release medium maintained at 37°C. The withdrawn samples were analyzed for measuring MTO and VRP concentrations by the HPLC system, as described earlier. The in vitro release assay was performed in triplicate.
Cell culture
MCF-7 (a human breast adenocarcinoma cell line) and MCF-7/ADR (a human breast carcinoma cell line that has been made resistant by DOX and expresses a high level of P-gp) were both obtained from the cell bank of Chinese Academy of Sciences (Shanghai, China). MCF-7 cells were cultured in DMEM/high glucose medium (Thermo Fisher Scientific, Waltham, MA, USA) supplemented with 10% fetal calf serum (Thermo Fisher Scientific) and 1% 100 μg/mL penicillin–100 U/mL streptomycin (Thermo Fisher Scientific); MCF-7/ADR cells were cultured in RPMI 1640 medium (HyClone) supplemented with 15% fetal calf serum and 1% 100 μg/mL penicillin–100 U/mL streptomycin. Both cell lines were cultured at 37°C in 5% CO2 atmosphere.
Cytotoxicity study
MCF-7 cells and MCF-7/ADR cells were plated at a density of 5×10³ cells/well in 96-well plates and incubated at 37°C under a humidified atmosphere with 5% CO2 for 24 h. Subsequently, the cells were treated with MTO solution, MTO-PENPs, and MTO-VRP-PENPs with increasing doses (total amount of MTO in PENPs): 0.05, 0.1, 0.5, 1, 5, 10, and 20 μg/mL for 24 h. Cytotoxicity was carried out by MTT assay in both MCF-7 and MCF-7/ADR cell lines. The plates were incubated for an additional 4 h. The culture medium was removed by aspiration. Thereafter, 150 μL of dimethyl sulfoxide (DMSO) was added to each well to dissolve the formazan crystals while slightly stirring the cells using an automated shaker. The absorbance of samples in 570 nm (A570 nm) was detected by enzyme-linked immunosorbent assay (ELISA; Thermo Electron Corporation, Beverly, MA, USA). The study was carried out six times. The ratio of the A570 nm of the preparations to that of the untreated cells as a percentage was used to express the cytotoxicity (IC50).
Cellular uptake studies
DOX was selected as a fluorescent probe to study the uptake of cells through flow cytometry. Both DOX and MTO are non-cell cycle-specific anticancer drugs and the MDR mechanism of DOX is similar to MTO, mainly due to the efflux by P-gp, whereas DOX has a strong fluorescence, which is conducive to flow cytometry.14 PENPs co-loaded with DOX and VRP (DOX-VRP-PENPs) and DOX-PENPs were prepared using the same method as MTO-VRP-PENPs, and MTO-PENPs except replacing MTO with DOX.
MCF-7 and MCF-7/ADR cells were seeded in 24-well plates (Costar, Washington, DC, USA) with 5×10⁵ cells/well density. After 24 h of cell culturing, the medium was replaced with DOX solution, DOX-PENPs, and DOX-VRP-PENPs to evaluate the effect of concentration (0.05–20 μg/mL of DOX equivalent for 4 h) and incubation time (1, 2, 4, 6, and 8 h at 10 μg/mL of DOX). The medium was then removed, and the cells were washed with ice-cold PBS three times followed by trypsinization. The cells were centrifuged at 1,000 rpm for 3 min and analyzed by flow cytometer (BD Biosciences, San Jose, CA, USA). Both investigations were carried out in triplicate.
Cell RR studies
MCF-7/ADR cells were seeded in 24-well plates with 5×10⁵ cells/well density. After 24 h of cell culturing, the media were replaced by DOX solution, DOX-PENPs, and DOX-VRP-PENPs (dissolved in RPMI 1640 cell culture medium without serum, CDOX =10 μg/mL) and incubated for another 2 h at 37°C. The cells were then washed with ice-cold PBS three times and re-cultured for 0, 0.5, 1, 2, and 4 h with RPMI 1640 cell culture medium (free of serum) before trypsinization for flow cytometry analysis. The cell RR was defined as the percentage of residual fluorescence intensity:
|
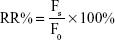
where Fs is the fluorescence intensity of cells re-cultured for a specific period, and F0 is the fluorescence intensity of cells re-cultured for 0 h.
In addition, the reversal index was defined as the ratio of IC50 of solution to the IC50 of formulations.15
Intracellular trafficking16
MCF-7/ADR cells were seeded in confocal dishes with 5×10⁵ cells/well density and cultured at 37°C for 24 h. The culture was then replaced by 400 μL of DOX-VRP-PENPs (diluted by RPMI 1640 cell culture medium without serum) and incubated for 4 h. The cells were washed thrice with ice-cold PBS, and Hoechst 33342 was used to dye the nucleus for 30 min. After, cells were washed thrice by PBS, and 0.5 mL paraformaldehyde (3.7% w/v) was added for 15 min to fix the cells. Then, cells was washed thrice by PBS, and the samples were analyzed by CLSM (Leica Microsystems, Wetzlar, Germany).
Statistical analyses
One-way analysis of variance (ANOVA) was performed on all experimental data, and the means were compared using Student’s t-test at the 5% level with SPSS 11.0 software (SPSS Inc., Chicago, IL, USA). Differences were considered to be significant at P<0.05.
Results and discussion
Preparation of HA–HCS PENPs
With the application of nanotechnology in drug delivery systems, numerous strategies are being developed to overcome MDR. Previous studies have shown the difficulties associated with the ordinary nano-drug delivery systems to achieve effective intracellular concentration due to smaller amounts of cellular uptake, slower intracellular release rate, and easy drug efflux.17 Therefore, to solve the problem of the common nanocarriers in overcoming MDR, a plethora of efforts to endow the nanocarriers with more functions is under investigation, and co-loading of P-gp inhibitors is one of the important strategies. Currently, there are reports of VRP and DOX co-loading in uniform mesoporous carbon spheres, liposomes, and bovine serum albumin nanoparticles.18–20 There are also a few reports about VRP-loaded polysaccharide or polyelectrolyte complexes;21 however, there are few reports about the co-loading of MTO and VRP in polyelectrolyte nanoparticles.22 Some pharmacological studies have showed that co-administration of MTO and VRP could enhance the efficacy of MTO.23,24 Polyelectrolyte nanoparticles are usually used as the hydrophilic drug carrier; in this study, interaction of small molecule drugs with biocompatible materials was used to achieve drug loading, and a double drug carrier system with high drug loading and stability was obtained after comprehensive formulation investigation.
The formation of PENPs is driven by a variety of forces mainly through three steps: first, the mixing process involves the formation of an unstable complex of polyelectrolytes via electrostatic bonding. Second, the intracomplex formation process depends on the formation of new chemical bonds and the deformation of polymer chains inside the complex. Third, the intercomplex aggregation is governed by intermolecular forces. This finally leads to the formation of PENPs by desolvation.25
The polyelectrolyte composite system according to the macro-state can be divided into: 1) soluble complexes; 2) phase separation boundary colloid system; 3) supernatant and poly-salt precipitation system; 4) polyanions and poly-cationic concentrated solution of a macro-homogeneous system. No matter what the chemical structure of two polyelectrolytes, the abovementioned four conditions can be changed by changing the reaction conditions, such as the initial concentration, proportion, pH, or ionic strength to achieve mutual conversion.26
Effect of the MW of HA
The MW of polyelectrolytes is one of the important factors that affect the properties of PENPs.27–29 Figure 2 shows the size and zeta potential of the blank PENPs prepared with different MWs of HA (2 mg/mL) and HCS solutions (2 mg/mL) at 400 rpm stirring for 2 h. PENPs prepared with 10 kDa HA (Figure 2A) showed little change in size with changes in HCS and HA ratio (300–320 nm). PENPs prepared with 50 kDa HA were in the range of 200–300 nm (Figure 2B). At a 2:1 ratio of HCS:HA, slightly bigger PENPs of 120 kDa HA were obtained (418.8 nm), but increase in HA content initially decreased the size to 209 nm (HCS:HA =1:2) which increased to 279 nm on further increase in HA (HCS:HA =1:6; Figure 2C). Except for the 1:1 ratio of HCS:HA (>300 nm), 500 kDa HA PENPs were too large and size exceeded 500 nm (Figure 2D).
 | Figure 2 Particle size and zeta potential of blank PENPs prepared by different mass ratios of HCS (2 mg/mL) and HA (2 mg/mL). |
Decrease in HCS ratio from 2:1 to 1:2 markedly decreased the zeta potential of the blank PENPs from positive to negative, but the trend became more stable with further decrease in HCS. This indicates neutralization of the positive charge of HCS induced by increasing chains of HA. However, excessive increase in HA (the ratio of HA:HCS >3:1) allowed a majority of the −NH2 on the HCS to be occupied by the carboxyl of HA; thus, the excess carboxyl groups of HA remained exposed to the outside of the PENPs with a stable negative surface charge.27–29 Particle size of PENPs prepared by 50 kDa HA was under 300 nm for all the HCS:HA volume ratios, so 50 kDa HA was chosen for subsequent experiments.
Effect of the initial concentrations of HA and HCS solutions
When the volume ratio of HCS to 50 kDa HA was fixed at 1:6, the effect of the initial concentrations of HA and HCS on particle size of blank PENPs was investigated.
We can infer from Table 1 that the size of blank PENPs was mainly related to the concentration of 50 kDa HA. Zeta potential did not change significantly (around −27 mV), by virtue of a greater proportion of HA than that of HCS in the PENPs. Large-sized particles were obtained for 50 kDa HA solutions with strength greater than 2 mg/mL. In addition, when the concentration of 50 kDa HA solution was less than 2 mg/mL, the system began to precipitate with the increase in HCS concentration. Our results are in good agreement with the findings of Buchhammer et al,30 that above a certain critical concentration PENPs become unstable and form insoluble precipitates. So, the concentrations of 2 mg/mL HA and HCS were selected for further studies.
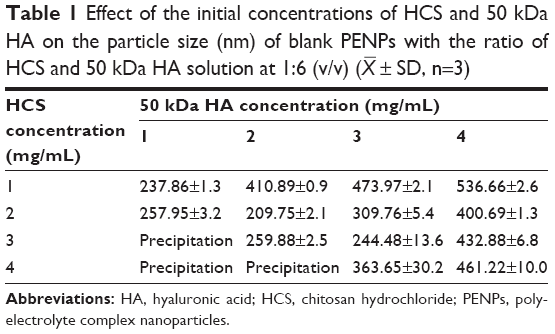 | Table 1 Effect of the initial concentrations of HCS and 50 kDa HA on the particle size (nm) of blank PENPs with the ratio of HCS and 50 kDa HA solution at 1:6 (v/v) ( |
 ± SD, n=3)
Effect of drug loading order
Tables 2 and 3 summarize the effect of the order of addition of drugs on the particle size, zeta potential, and EE% of PENPs when the volume ratio of HCS (2 mg/mL) to HA (2 mg/mL) was fixed at 1:6, and the drug concentrations were MTO =0.3 mg/mL and VRP =2 mg/mL.
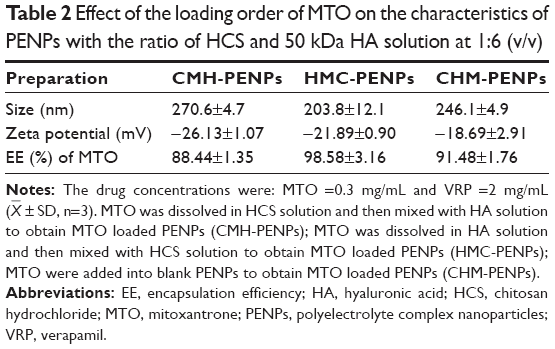 | Table 2 Effect of the loading order of MTO on the characteristics of PENPs with the ratio of HCS and 50 kDa HA solution at 1:6 (v/v) |
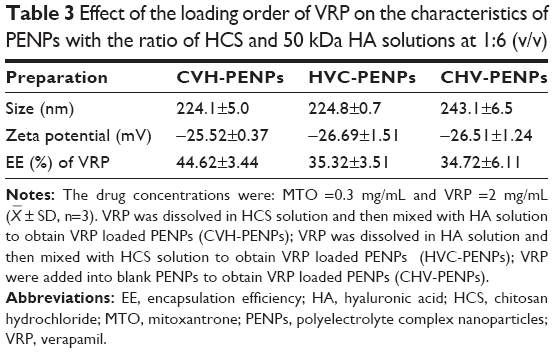 | Table 3 Effect of the loading order of VRP on the characteristics of PENPs with the ratio of HCS and 50 kDa HA solutions at 1:6 (v/v) |
It is obvious from Table 2 that HMC-PENPs possessed the smallest size (203.8 nm) and higher EE% of MTO (98.58%) than the other two kinds of PENPs. In the HMC-PENP preparation method, MTO molecules might get adsorbed to HA by virtue of electrovalent attraction through the electropositive imino group of MTO with the carboxyl group of HA. Particle size and zeta potential of VRP-loaded PENPs (Table 3) prepared by a different method were almost similar but with a maximum EE% of only 44.62% for CVH-PENPs. VRP could not combine with the carrier material by ionic interaction because of its electrical neutrality. Encapsulation of VRP into the PENPs could be due to the Van der Waals’ forces between the drug and the polymers. Peng et al31 prepared alginate/calcium carbonate hybrid microparticles to co-deliver DOX and VRP and obtained much lower EE% of VRP (49.6%) as compared to the positively charged DOX (90.0%), which is consistent with our results. From the experimental results, the affinity of VRP with HCS was slightly higher than HA, so the preparation method of CVH-PENPs was chosen.
Effect of the mass ratio of HCS and HA in MTO-VRP-PENPs
The effect of HCS:HA ratio on the characteristics of MTO-VRP-PENPs, when the drug concentrations were MTO =0.3 mg/mL and VRP =2 mg/mL, and 2 mg/mL of HA and HCS solutions were used, is given in Table 4.
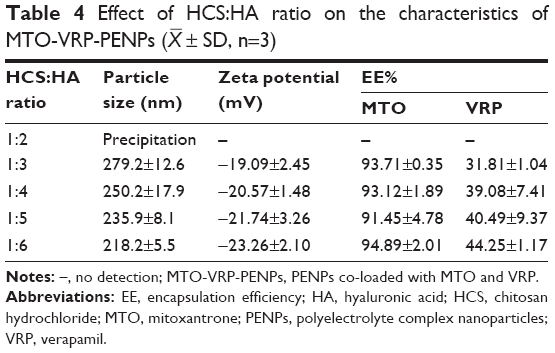 | Table 4 Effect of HCS:HA ratio on the characteristics of MTO-VRP-PENPs ( |
A slight but gradual decrease in the particle size and potential of PENPs was observed for increasing proportion of HA. The EE% of MTO remained more than 90% for all ratios, but the EE% of VRP gradually increased. Higher levels of HA in the PENPs could have caused more tight wrapping of HCS resulting in decreased loss of the adsorbed drug and thus higher VRP encapsulation. So, HCS:HA ratio of 1:6 was chosen for further experiments.
Screening drug concentrations
When screening for the concentration of MTO, the VRP concentration was fixed at 2 mg/mL, and when screening for the VRP concentration, the MTO concentration was fixed at 0.3 mg/mL, while other preparation conditions were kept constant as determined earlier. MTO-VRP-PENPs properties are given in Tables 5 and 6.
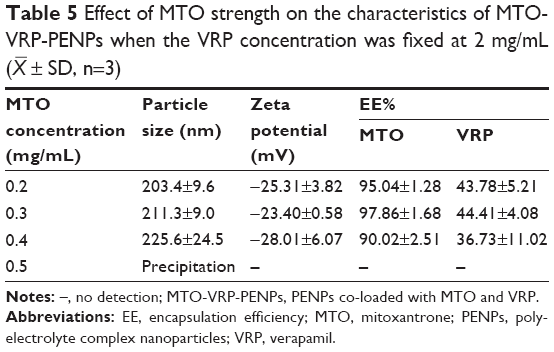 | Table 5 Effect of MTO strength on the characteristics of MTO-VRP-PENPs when the VRP concentration was fixed at 2 mg/mL ( |
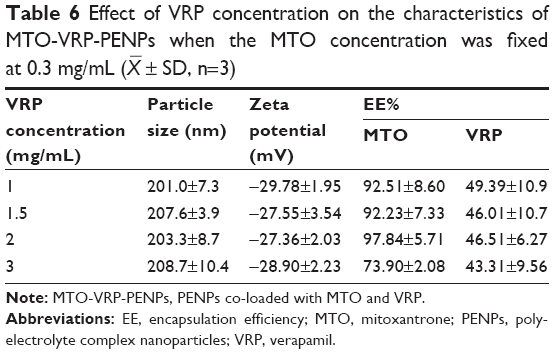 | Table 6 Effect of VRP concentration on the characteristics of MTO-VRP-PENPs when the MTO concentration was fixed at 0.3 mg/mL ( |
Precipitation of the preparation observed at higher level of MTO might be explained by increase in the pH of the medium due to its strong alkaline nature, leading to instability of the nanoparticles. Quantity of VRP also did not affect EE% of MTO as the interaction between VRP and the carrier material was weaker. However, 3 mg/mL of VRP significantly lowered EE% of MTO (73.90%±2.08%). Both MTO and VRP in the co-loaded PENP system were likely to occupy the hydrophilic sites due to their hydrophilic nature, so the EE% of MTO reduced with the increase of VRP concentration, indicating interference caused by VRP with the encapsulation of MTO in the polyelectrolyte system, at higher concentrations during the loading process. Finally, 0.3 mg/mL MTO and 2 mg/mL VRP were chosen in the making of PENPs.
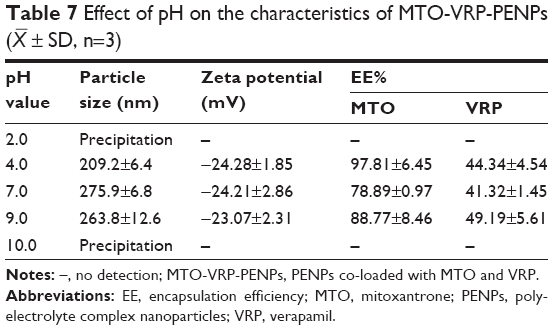
Effect of the system pH
In general, when PENPs are formed by strong electrolytes, the pH of the medium has little effect on the complexation process. If one component of the system is a weak electrolyte, the pH of the medium will affect the dissociation degree and effective charge density of weak polyelectrolyte ionic groups (such as −COO− in HA),32 thereby affecting PENP formation. In addition, pH can affect the conformation and the chain rigidity of the polymer.33 Therefore, PENP formation can be affected by pH environment operating through the abovementioned factors, resulting in particle size and zeta potential variations.
In this study, the pH of the solution determines the degree of ionization of carboxylic acid groups of the HA (pKa 3.2) and amino groups of the HCS (pKa 6.5), which might affect the particle size, zeta potential, and drug loading of PENPs (pKa of MTO is 8.5).34 Table 7 presents results showing that particle size and zeta potential of PENPs and EE% of both MTO and VRP changed by the addition of weak acid (acetic acid) or weak base (aqueous ammonia) in the MTO-HA solution. PENPs made at pH 4.0 and pH 9.0 had the maximum EE% and DL%% of both MTO and VRP compared to those made at pH 7.0 (Table 7), indicating that better interaction between the HA and MTO exists in the appropriate acid/alkali medium, making electrostatic adsorption more stable. Extreme pH conditions (2 and 10) did not favor the formation of PENPs. Formulations made at pH 4.0 generated smaller size MTO-VRP-PENPs; therefore, pH 4.0 was selected as the optimum medium pH.
 | Table 7 Effect of pH on the characteristics of MTO-VRP-PENPs ( |
Effect of the mixing time
As summarized in Table 8, the EE% and DL% of MTO and VRP were at higher levels for a 2 h mixing time. Particle size and zeta potential did not vary significantly with the mixing time. However, longer mixing time caused significant decrease in the EE% of both drugs. Because of prolonged stirring drug leakage might have occurred, as energy around the particles could have been intensified by the molecular motion leading to increased collision between the particles.
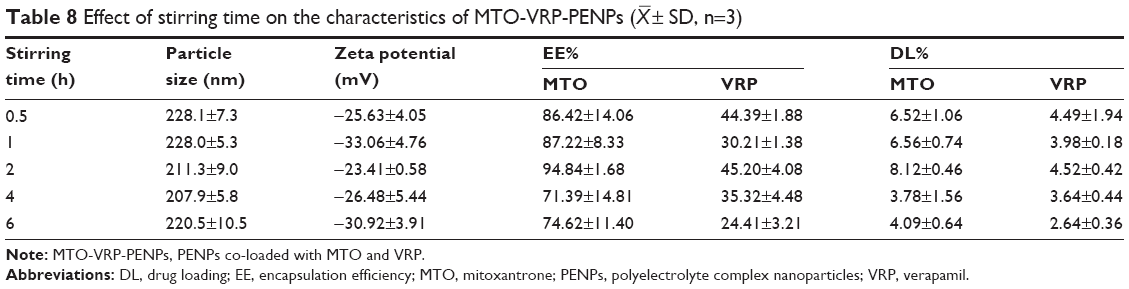 | Table 8 Effect of stirring time on the characteristics of MTO-VRP-PENPs ( |
Table 9 summarizes the key features of the optimized MTO-VRP-PENPs and MTO-PENPs. Figure 3F showed that TEM image of MTO-VRP-PENPs was the quasi-spherical shape.
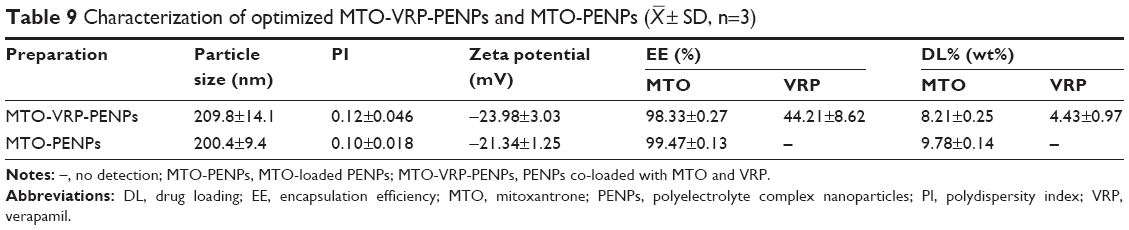 | Table 9 Characterization of optimized MTO-VRP-PENPs and MTO-PENPs ( |
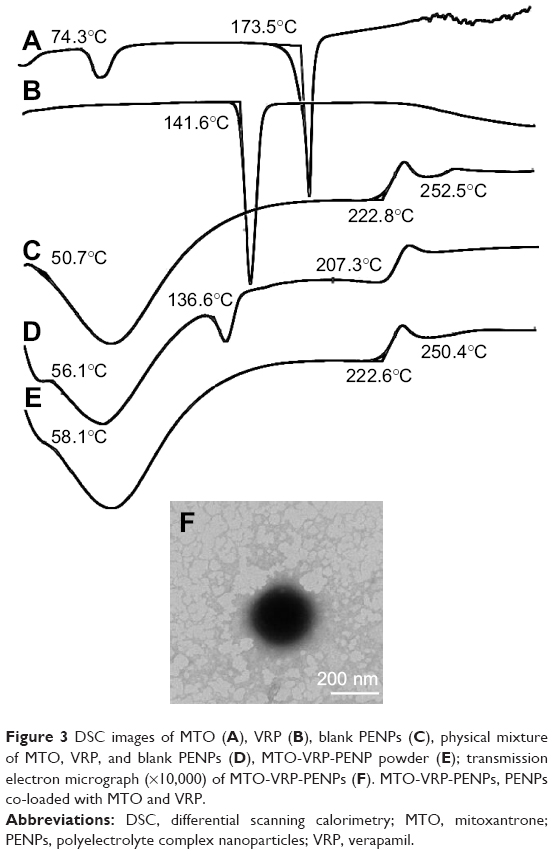 | Figure 3 DSC images of MTO (A), VRP (B), blank PENPs (C), physical mixture of MTO, VRP, and blank PENPs (D), MTO-VRP-PENP powder (E); transmission electron micrograph (×10,000) of MTO-VRP-PENPs (F). MTO-VRP-PENPs, PENPs co-loaded with MTO and VRP. |
DSC analysis
Figure 3 shows the DSC thermograms of pure MTO, pure VRP, blank PENPs, physical mixture of MTO, VRP, and blank PENPs, and MTO-VRP-PENP powder. Pure MTO and VRP showed a sharp endothermal peak at 173.5°C and 141.6°C, respectively, indicating the typical behavior of the drugs.35 The thermogram of the physical mixture of drugs and blank PENPs did not show peak of MTO but showed a low-intensity characteristic the peak of VRP. It showed that the negatively charged hydrophilic PENPs interacted with both hydrophilic drugs even in the physical mixing process. Positively charged hydrophilic MTO showed much better interaction with the carrier due to the electrostatic charges. This type of phenomenon has been observed for the solid dispersions prepared by physical mixing of hydrophilic carrier with the drugs.36 There was no significant difference in the diffraction pattern of blank PENPs and MTO-VRP-PENPs, indicating that the addition of MTO and VRP had not changed the nature of PENPs and the drugs were entrapped inside the PENPs in a molecular or amorphous state.
In vitro release study
The release studies showed rapid release of MTO (78.12%) and VRP (87.36%) from MTO-VRP solution within the first 2 h (Figure 4). MTO-VRP-PENPs released the MTO in a controlled fashion (only 38.61% up to 5 h and 60% until 24 h), whereas the release of VRP from MTO-VRP-PENPs was much quicker than that of MTO (82.77% at 5 h). Positively charged MTO would have been firmly combined with HA through electrostatic interactions, whereas weak intermolecular Van der Waal’s forces might explain rapid expulsion of VRP (a neutral drug), which is consistent with the previous findings.37
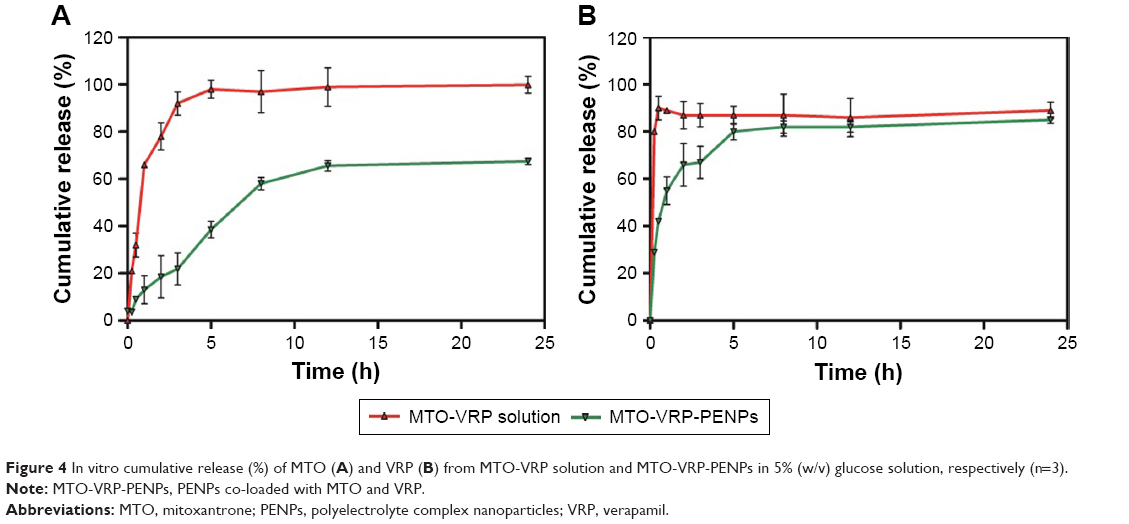 | Figure 4 In vitro cumulative release (%) of MTO (A) and VRP (B) from MTO-VRP solution and MTO-VRP-PENPs in 5% (w/v) glucose solution, respectively (n=3). |
Cytotoxicity assays
MTT assay was performed to evaluate the effect of blank PENPs on the cell viability of MCF-7 and MCF-7/ADR cells. Results showed that the cell viability of MCF-7 and MCF-7/ADR cells incubated with blank PENPs at tested concentrations ranging from 10 to 500 μg/mL for 24 h were all over 80% (data no shown), indicating that blank PENPs in the studied concentrations have no effect on cell viability of MCF-7 and MCF-7/ADR cells, suggesting blank PENPs might be good biocompatible carriers for drug delivery.
Figure 5A and B indicates concentration-dependent inhibition of the growth of MCF-7 and MCF-7/ADR cells by three formulations. All preparations did not show cytotoxicity for MCF-7 and MCF-7/ADR cells when the concentration of MTO was below 0.1 μg/mL. Cell survival rate of MCF-7/ADR cells was reduced to 44.66% when the concentration of MTO was 5 μg/mL in the MTO-VRP-PENPs group, whereas the survival rate of MCF-7/ADR cells was 80.37% and 67.57% in the MTO solution and MTO-PENPs groups, respectively. The cytotoxicity of MTO-VRP-PENPs was significantly higher than the other two groups at the same concentrations; the MCF-7/ADR cell survival rate of MTO-VRP-PENPs, MTO-PENPs, and MTO solution was 18.26%, 55.28%, and 61.67%, respectively, for 20 μg/mL MTO. These results suggested that synergistic delivery of chemotherapy drugs by MTO-VRP-PENPs could achieve enhanced therapeutic efficacy.
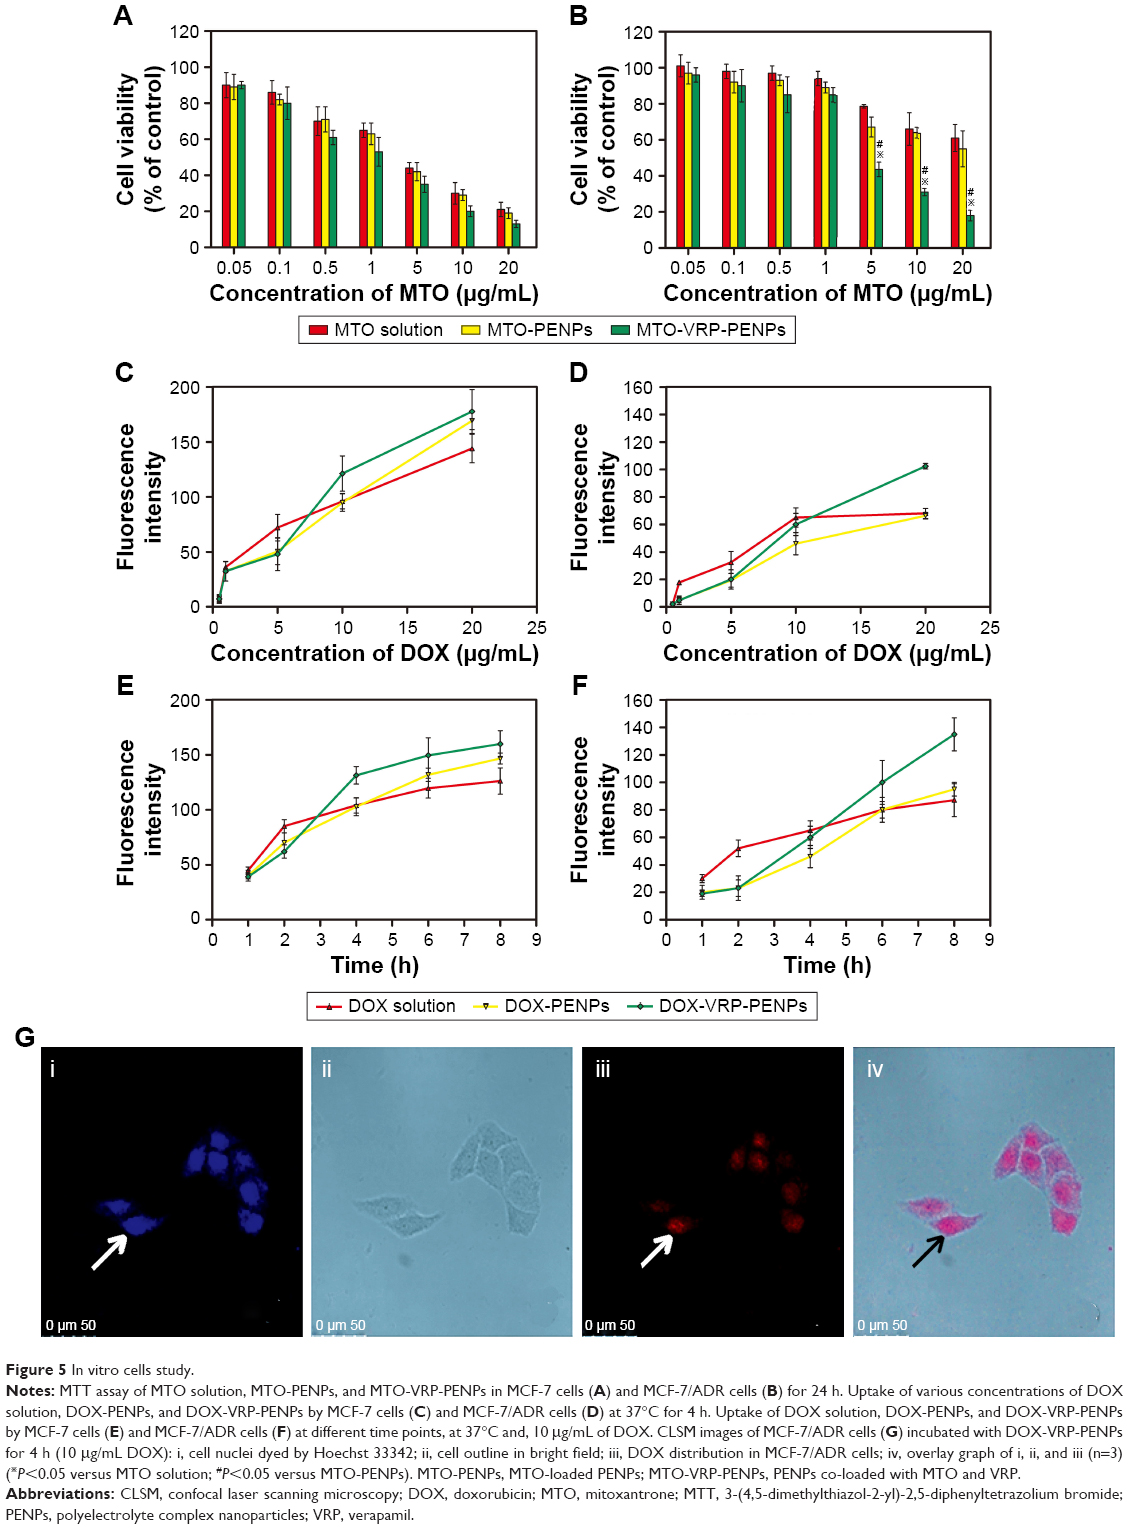 | Figure 5 In vitro cells study. |
MCF-7 cells were sensitive to free MTO solution (IC50 of 2.40±0.53 μg/mL, n=3), while MCF-7/ADR cells were resistant to free MTO solution (IC50 of 49.15±0.28 μg/mL, n=3). MTO-PENPs showed slightly better cytotoxicity than MTO solution for MCF-7 (IC50 of 2.06±0.64 μg/mL, n=3) and MCF-7/ADR cells (IC50 of 38.33±0.38 μg/mL, n=3). However, MTO-VRP-PENPs showed greater cytotoxicity in both MCF-7 cells (IC50 of 1.19±0.48 μg/mL, n=3) and MCF-7/ADR cells (IC50 of 3.71±0.15 μg/mL, n=3) in contrast to the MTO-PENPs and free MTO solution. VRP is a first-generation P-gp inhibitor shown to reverse drug resistance in P-gp overexpressing MDR tumor cells.38 Since the released VRP molecules from PENPs had the ability to competitively bind with the P-gp,39–41 the accumulation of released MTO molecules in MCF-7/ADR cells was significantly improved, leading to a much higher cytotoxicity of MTO-VRP-PENPs compared to the MTO-PENPs. A recently published study demonstrated that P-gp-mediated MDR could be overcome by encapsulating anticancer drug vincristine and VRP in poly(lactic-co-glycolic) acid (PLGA) nanoparticles.42
Cellular uptake study
To study the uptake kinetics of different PENPs in MCF-7 and MCF-7/ADR cells, cells were treated with DOX solution, DOX-PENPs, and DOX-VRP-PENPs at different times and concentrations, where DOX was used as a fluorescent probe for flow cytometry. The particle sizes and zeta potentials of DOX-PENPs and DOX-VRP-PENPs, and EE% of DOX were 206±3.12 nm, 210.54±2.36 nm, −22.66±1.23 mV, −20.18±2.14 mV, 98.84%±2.34%, and 99.27%±1.21%, respectively. EE% of VRP in DOX-VRP-PENPs was 45.67%±1.47%. Furthermore, the DOX released from the PENPs was released in a controlled release manner similar to the release of MTO (data not shown). Figure 5C and D illustrates that there was an obvious concentration-dependent internalization of DOX solution, DOX-PENPs, and DOX-VRP-PENPs in MCF-7 and MCF-7/ADR cells up to 4 h. In either MCF-7 or MCF-7/ADR cells, the uptake of the DOX solution group was higher than that of the nanoparticle group when DOX concentration was ≤5 μg/mL. Hydrophilic DOX could move along with water molecules into the cells through the passive transport;43 this was much faster than the active PENP uptake process. Fluorescent intensity of DOX-PENPs in MCF-7 cells at 20 μg/mL concentration and at 4 h was significantly enhanced as HA-based CD44 targeting could have promoted the endocytosis of nanoparticles by cells.44 MCF-7/ADR cells’ uptake of DOX solution was much lower than the MCF-7 cells, indicating obvious efflux of DOX from MCF-7/ADR cells. PENPs co-loaded with VRP could improve MCF-7/ADR cell uptake of DOX significantly, which suggests that the VRP could inhibit the extracellular efflux mechanism of DOX-VRP-PENPs in MCF-7/ADR cells by P-gp. Drug-resistant cells may have more P-gp, and the co-loaded PENPs showed better reversal effect.
In either MCF-7 or MCF-7/ADR cells (Figure 5E and F), the DOX solution reflected faster uptake than DOX-PENPs and DOX-VRP-PENPs in the first 2 h. On the other hand, the uptake curves of DOX-PENPs and DOX-VRP-PENPs increased quickly after 2 h. The total uptake concentration of DOX-VRP-PENPs at 8 h in MCF-7/ADR cells was significantly higher than that of DOX solution (1.55 times) and DOX-PENPs (1.42 times) owing to the presence of VRP to inhibit the efflux of DOX.45 The total uptake concentration of DOX-VRP-PENPs in MCF-7 cells at 8 h was slightly higher than that of the other two groups, which was consistent with uptake condition under different concentrations.
To further study the intracellular location of PENPs co-loaded with VRP, the MCF-7/ADR cells were visualized post incubation with DOX-VRP-PENPs for 4 h by CLSM. As depicted in Figure 5G, red fluorescence of DOX and blue fluorescence of Hoechst 33342 almost overlapped in MCF-7/ADR cells’ nuclei. This certainly showed that DOX-VRP-PENPs successfully reached the nucleus in significant quantities after getting into the cells, to ensure the cytotoxic role of DOX.46,47 Overall, these results iterate that PENPs co-loaded with VRP have great potential for the delivery of cytotoxic drugs to overcome MDR in tumor treatments.
Cell RR study
As evident from Table 10, the RR of both the DOX solution and DOX-PENPs groups immediately dropped to about 54% just after 0.5 h post incubation with MCF-7/ADR cells. However, the retention capacity of DOX-VRP-PENPs in MCF-7/ADR cells was around 60% even at 4 h post incubation. These results showed obvious reversal of MDR effected by co-loaded nanoparticles. In addition, IC50 of free MTO, MTO-PENPs, and MTO-VRP-PENPs on MCF-7/ADR cells was 49.15, 38.33, and 3.71 μg/mL, respectively (Table 11). The enhanced cytotoxicity of MTO-PENPs was mainly attributed to the effect of PENPs which can be internalized into tumor cells via CD44. The reversal index of MTO-PENPs on MCF-7/ADR cells was improved as reversal index was 1.28 compared to free MTO. The reversal index of MTO-VRP-PENPs on MCF-7/ADR cells was markedly improved (13.25 times to free MTO, and 10.33 times to MTO-PENPs), suggesting that the co-loaded PENPs could effectively reverse MDR of tumor cells. The enhanced efficacy of MTO-VRP-PENPs on MCF-7/ADR cells might result from the synergistic effect of VRP and MTO. The presence of VRP in PENPs would have affected the efflux of MTO, thus increasing residence time of the cytotoxic drug and hence its activity.
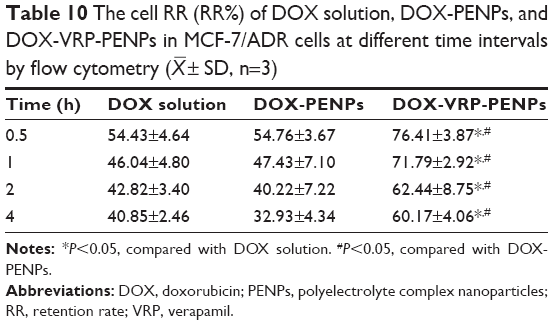 | Table 10 The cell RR (RR%) of DOX solution, DOX-PENPs, and DOX-VRP-PENPs in MCF-7/ADR cells at different time intervals by flow cytometry ( |
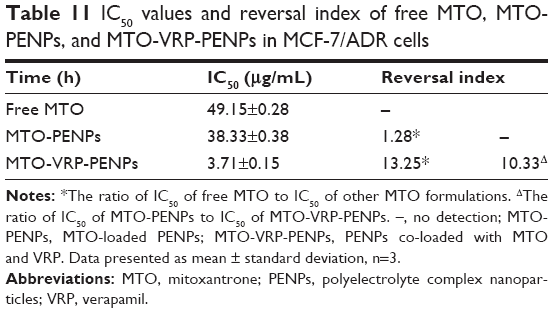 | Table 11 IC50 values and reversal index of free MTO, MTO-PENPs, and MTO-VRP-PENPs in MCF-7/ADR cells |
Conclusion
In this study, we successfully co-encapsulated MTO and P-gp inhibitor VRP in PENPs based on HA and HCS. Various factors were observed to affect the size, zeta potential, and EE% of MTO and VRP in the co-loaded PENPs. Optimized MTO-VRP-PENPs possessed a particle size and zeta potential of about 200 nm and −23.98±3.03 mV, respectively. EE% of MTO and VRP was 98.33%±0.27% and 44.21%±8.62%, respectively. MTO and VRP were encapsulated in the PENPs in a molecular state. Importantly, MTO-VRP-PENPs showed improved cytotoxicity, cellular uptake, and significant reversal of drug resistance in MCF-7/ADR cells in contrast to the MTO-PENPs. Our results suggest that MTO-VRP-PENPs could be a potential system to overcome tumor drug resistance.
Acknowledgments
This work has been supported by the National Natural Science Foundation of China (Program No 81503027) and College Students Innovation Project for the R&D of Novel Drugs (Program No J1030830).
Disclosure
The authors report no conflicts of interest in this work.
References
Reszka R, Beck P, Fichtner I, Hentschel M, Richter J, Kreuter J. Body distribution of free, liposomal and nanoparticle-associated mitoxantrone in B16-melanoma-bearing mice. J Pharmacol Exp Ther. 1997;280(1):232–237. | ||
Imai Y, Tsukahara S, Asada S, Sugimoto Y. Phytoestrogens/flavonoids reverse breast cancer resistance protein/ABCG2-mediated multidrug resistance. Cancer Res. 2004;64(12):4346–4352. | ||
Huang Y, Cole SP, Cai T, Cai YU. Applications of nanoparticle drug delivery systems for the reversal of multidrug resistance in cancer. Oncol Lett. 2016;12(1):11–15. | ||
Amin ML. P-glycoprotein inhibition for optimal drug delivery. Drug Target Insights. 2013;7(7):27–34. | ||
Tsuruo T, Iida H, Tsukagoshi S, et al. Overcoming of vincristine resistance in leukemia in vivo and in vitro through enhanced cytotoxicity of vincristine and vinblastine by verapamil. Cancer Res. 1981;41(5):1967–1972. | ||
Muller C, Goubin F, Ferrandis E, et al. Evidence for transcriptional control of human mdr1 gene expression by verapamil in multidrug-resistant leukemic cells. Mol Pharmacol. 1995;47(1):51–56. | ||
Tsubaki M, Komai M, Itoh T, et al. By inhibiting src, verapamil and dasatinib overcome multidrug resistance via increased expression of bim and decreased expressions of mdr1 and survivin in human multidrug-resistant myeloma cells. Leuk Res. 2014;38(1):121–130. | ||
Nikolaeva O, Budtova T, Alexeev V, et al. Interpolymer complexation between polyacrylic acid and cellulose ethers: formation and properties. J Polym Sci Polym Phys. 2000;38(10):1323–1330. | ||
Eliaz RE, Szoka FC. Liposome-encapsulated doxorubicin targeted to CD44: a strategy to kill CD44-overexpressing tumor cells. Cancer Res. 2001;61(6):2592–2601. | ||
Yoon HY, Koo H, Choi KY, et al. Tumor-targeting hyaluronic acid nanoparticles for photodynamic imaging and therapy. Biomaterials. 2012;33(15):3980–3989. | ||
Lee H, Mok H, Lee S, Oh YK, Park TG. Target-specific intracellular delivery of siRNA using degradable hyaluronic acid nanogels. J Control Release. 2007;119(2):245–252. | ||
Choi KY, Chung H, Min KH, et al. Self-assembled hyaluronic acid nanoparticles for active tumor targeting. Biomaterials. 2010;31(1):106–114. | ||
Yang L, Gao S, Asghar S, et al. Hyaluronic acid/chitosan nanoparticles for delivery of curcuminoid and its in vitro evaluation in glioma cells. Int J Biol Macromol. 2015;72:1391–1401. | ||
Zhao Y, Zhou Y, Wang D, et al. pH-responsive polymeric micelles based on poly(2-ethyl-2-oxazoline)-poly(d,l-lactide) for tumor-targeting and controlled delivery of doxorubicin and p-glycoprotein inhibitor. Acta Biomater. 2015;17:182–192. | ||
Meng L, Xia X, Yang Y, et al. Co-encapsulation of paclitaxel and baicalein in nanoemulsions to overcome multidrug resistance via oxidative stress augmentation and P-glycoprotein inhibition. Int J Pharm. 2016;513(1–2):8–16. | ||
Chi Y, Yin X, Sun K, et al. Redox-sensitive and hyaluronic acid functionalized liposomes for cytoplasmic drug delivery to osteosarcoma in animal models. J Control Release. 2017;261:113–125. | ||
Kratz F, Warnecke A. Finding the optimal balance: challenges of improving conventional cancer chemotherapy using suitable combinations with nano-sized drug delivery systems. J Control Release. 2012;164(2):221–235. | ||
Wan L, Jiao J, Cui Y, et al. Hyaluronic acid modified mesoporous carbon nanoparticles for targeted drug delivery to cd44-overexpressing cancer cells. Nanotechnology. 2016;27(13):135102. | ||
Tang J, Zhang L, Gao H, et al. Co-delivery of doxorubicin and p-gp inhibitor by a reduction-sensitive liposome to overcome multidrug resistance, enhance anti-tumor efficiency and reduce toxicity. Drug Deliv. 2014;23(4):1130–1143. | ||
Chen B, Wu C, Zhuo RX, et al. A self-assembled albumin based multiple drug delivery nanosystem to overcome multidrug resistance. RSC Adv. 2015;5(9):6807–6814. | ||
Čalija B, Savić S, Krajišnik D, et al. pH-sensitive polyelectrolyte films derived from submicron chitosan/eudragit®100-55 complexes: physicochemical characterization and in vitro drug release. J Appl Polym Sci. 2015;132(39):42583. | ||
Liu Z, Wu XY, Bendayan R. In vitro investigation of ionic polysaccharide microspheres for simultaneous delivery of chemosensitizer and antineoplastic agent to multidrug-resistant cells. J Pharm Sci. 1999;88(4):412–418. | ||
He X, Wang J, Dou J, et al. Antitumor efficacy induced by a tumor cell vaccine treated with mitoxantrone alone or in combination with reserpine and verapamil in mice. Exp Ther Med. 2011;2(5):911–916. | ||
Chen JW, Qiu WL, He RG. Verapamil enhancement of antitumor effect of mitoxantrone on ACC-2 cell line in vitro and in vivo. Zhonghua Kou Qiang Yi Xue Za Zhi. 1994;29(5):262–265. | ||
Tsuchida E, Abe K, Honma M. Aggregation of polyion complexes between synthetic polyelectrolytes. Macromolecules. 1976;9(1):112–117. | ||
Jewell CM, Zhang J, Fredin NJ, Wolff MR, Hacker TA, Lynn DM. Release of plasmid DNA from intravascular stents coated with ultrathin multilayered polyelectrolyte films. Biomacromolecules. 2006;7(9):2483–2491. | ||
Halder A, Maiti S, Sa B. Entrapment efficiency and release characteristics of polyethyleneimine-treated or -untreated calcium alginate beads loaded with propranolol-resin complex. Int J Pharm. 2005;302(1–2):84–94. | ||
Karibyants N, Dautzenberg H. Preferential binding with regard to chain length and chemical structure in the reactions of formation of quasisoluble polyelectrolyte complexes. Langmuir. 1998;14(16):4427–4434. | ||
Schatz C, Lucas JM, Viton C, Domard A, Pichot C, Delair T. Formation and properties of positively charged colloids based on polyelectrolyte complexes of biopolymers. Langmuir. 2004;20(18):7766–7778. | ||
Buchhammer HM, Mandy M, Marina O. Formation of mono-sized polyelectrolyte complex dispersions: effects of polymer structure, concentration and mixing conditions. Colloids Surf A. 2003;218(1):151–159. | ||
Peng Y, Sun HY, Wang ZC, Xu XD, Song JC, Gong ZJ. Fabrication of alginate/calcium carbonate hybrid microparticles for synergistic drug delivery. Chemotherapy. 2016;61(1):32–40. | ||
Mekhloufi G, Sanchez C, Renard D, Guillemin S, Hardy J. pH-induced structural transitions during complexation and coacervation of beta-lactoglobulin and acacia gum. Langmuir. 2005;21(1):386–394. | ||
Ghosh S, Kobal I, Zanette D, et al. Conformational contraction and hydrolysis of hyaluronate in sodium hydroxide solutions. Macromolecules. 1993;26(17):4685–4693. | ||
Shu S, Zhang X, Teng D. Polyelectrolyte nanoparticles based on water-soluble chitosan–poly (l-aspartic acid)–polyethylene glycol for controlled protein release. Carbohydr Res. 2009;344(10):1197–1204. | ||
Hu T, Cao H, Yang C, et al. LHD modified mechanism-based liposome co-encapsulation of mitoxantrone and prednisolone using novel lipid bilayer fusion for tissue-specific co-localization and synergistic anti-tumor effects. ACS Appl Mater Inter. 2016;8(10):6586–6601. | ||
Leonardi D, Salomon CJ. Unexpected performance of physical mixtures over solid dispersions on the dissolution behavior of benznidazole from tablets. J Pharm Sci. 2013;102(3):1016–1023. | ||
Qin M, Lee YE, Ray A, Kopelman R. Overcoming cancer multidrug resistance by codelivery of doxorubicin and verapamil with hydrogel nanoparticles. Macromol Biosci. 2014;14(8):1106–1115. | ||
Krishna R, Mayer LD. Multidrug resistance (MDR) in cancer: mechanisms, reversal using modulators of MDR and the role of MDR modulators in influencing the pharmacokinetics of anticancer drugs. Eur J Pharm Sci. 2000;11(4):265–283. | ||
Gottesman MM, Pastan I. Biochemistry of multidrug resistance mediated by the multidrug transporter. Annu Rev Biochem. 1993;62(1):385–427. | ||
Fardel O, Lecureur V, Guillouzo A. The p-glycoprotein multidrug transporter. Gen Pharmacol. 1996;27(8):1283–1291. | ||
Stavrovskaya AA. Cellular mechanisms of multidrug resistance of tumor cells. Biochemistry (Mosc). 2000;65(1):95–106. | ||
Song XR, Cai Z, Zheng Y, et al. Reversion of multidrug resistance by co-encapsulation of vincristine and verapamil in PLGA nanoparticles. Eur J Pharm Sci. 2009;37(3–4):300–305. | ||
Niu J, Huang A, Xiao Y, et al. Octreotide-mediated tumor cell uptake and intracellular ph-responsive drug delivery of the self-assembly supramolecular nanocarrier. J Drug Target. 2013;21(5):415–426. | ||
Su Z, Chen M, Xiao Y, et al. Ros-triggered and regenerating anticancer nanosystem: an effective strategy to subdue tumor’s multidrug resistance. J Control Release. 2014;196(11):370–383. | ||
Wong HL, Bendayan R, Rauth AM, Wu XY. Development of solid lipid nanoparticles containing ionically complexed chemotherapeutic drugs and chemosensitizers. J Pharm Sci. 2004;93(8):1993–2008. | ||
Febvay S, Marini DM, Belcher AM, Clapham DE. Targeted cytosolic delivery of cell-impermeable compounds by nanoparticle-mediated, light-triggered endosome disruption. Nano Lett. 2010;10(6):2211–2219. | ||
Wu C, Gong MQ, Liu BY, Zhuo RX, Cheng SX. Co-delivery of multiple drug resistance inhibitors by polymer/inorganic hybrid nanoparticles to effectively reverse cancer drug resistance. Colloids Surf B Biointerfaces. 2017;149:250–259. |
 © 2017 The Author(s). This work is published and licensed by Dove Medical Press Limited. The
full terms of this license are available at https://www.dovepress.com/terms
and incorporate the Creative Commons Attribution
- Non Commercial (unported, 3.0) License.
By accessing the work you hereby accept the Terms. Non-commercial uses of the work are permitted
without any further permission from Dove Medical Press Limited, provided the work is properly
attributed. For permission for commercial use of this work, please see paragraphs 4.2 and 5 of our Terms.
© 2017 The Author(s). This work is published and licensed by Dove Medical Press Limited. The
full terms of this license are available at https://www.dovepress.com/terms
and incorporate the Creative Commons Attribution
- Non Commercial (unported, 3.0) License.
By accessing the work you hereby accept the Terms. Non-commercial uses of the work are permitted
without any further permission from Dove Medical Press Limited, provided the work is properly
attributed. For permission for commercial use of this work, please see paragraphs 4.2 and 5 of our Terms.