Back to Journals » International Journal of Nanomedicine » Volume 9 » Issue 1
Polymersomes containing quantum dots for cellular imaging
Authors Camblin M, Detampel P, Kettiger H, Wu D, Balasubramanian V, Huwyler J
Received 14 December 2013
Accepted for publication 7 February 2014
Published 12 May 2014 Volume 2014:9(1) Pages 2287—2298
DOI https://doi.org/10.2147/IJN.S59189
Checked for plagiarism Yes
Review by Single anonymous peer review
Peer reviewer comments 4
Marine Camblin,1 Pascal Detampel,1 Helene Kettiger,1 Dalin Wu,2 Vimalkumar Balasubramanian,1,* Jörg Huwyler1,*
1Division of Pharmaceutical Technology, 2Department of Chemistry, University of Basel, Basel, Switzerland
*These authors contributed equally to this work
Abstract: Quantum dots (QDs) are highly fluorescent and stable probes for cellular and molecular imaging. However, poor intracellular delivery, stability, and toxicity of QDs in biological compartments hamper their use in cellular imaging. To overcome these limitations, we developed a simple and effective method to load QDs into polymersomes (Ps) made of poly(dimethylsiloxane)-poly(2-methyloxazoline) (PDMS-PMOXA) diblock copolymers without compromising the characteristics of the QDs. These Ps showed no cellular toxicity and QDs were successfully incorporated into the aqueous compartment of the Ps as confirmed by transmission electron microscopy, fluorescence spectroscopy, and fluorescence correlation spectroscopy. Ps containing QDs showed colloidal stability over a period of 6 weeks if stored in phosphate-buffered saline (PBS) at physiological pH (7.4). Efficient intracellular delivery of Ps containing QDs was achieved in human liver carcinoma cells (HepG2) and was visualized by confocal laser scanning microscopy (CLSM). Ps containing QDs showed a time- and concentration-dependent uptake in HepG2 cells and exhibited better intracellular stability than liposomes. Our results suggest that Ps containing QDs can be used as nanoprobes for cellular imaging.
Keywords: quantum dots, polymersomes, cellular imaging, cellular uptake
Introduction
Development of highly sensitive and stable imaging probes is of considerable interest in many areas of biomedical research, ranging from cellular biology to molecular imaging and diagnostics. Fluorescent semiconductor quantum dots (QDs) are promising fluorescent nanoprobes offering an alternative to conventional organic fluorophores due to their unique properties.1,2 QDs show superior optical and chemical properties, ie, broad spectral absorption with a narrow emission band, higher brightness of fluorescence despite a low quantum yield, high photostability, and resistance to photobleaching.3,4 However, poor chemical stability, particle aggregation, and toxicity mediated by the cadmium semiconductor core limit the use of QDs in imaging.5–7 These limitations are of major concern in applications where cellular uptake of QDs is required to visualize intracellular compartments.
In cell culture media, QDs have low stability due to particle aggregation and surface degradation, which leads to minimal cellular uptake and difficulties with respect to the interpretation of cellular images.8 Therefore, attempts have been made to improve the stability and promote cellular uptake of QDs using surface chemistry modifications. This includes the functionalization of QDs with biomolecules such as antibodies,9 proteins,10 or peptides,11 as well as their coating with polymers or amphiphilic copolymers.12,13 However, modification of the QD surface may significantly alter their fluorescence properties.14 Once taken up by target cells, QDs often end up in the endolysosomal compartment or aggregate in intracellular regions.15 Earlier studies showed that QDs may disintegrate under acidic conditions in these compartments, leading to intracellular release of toxic heavy metals. This leads to oxidative stress, induction of apoptosis, and eventually, cell death.16 Recently, it was shown that polymer-coated QDs could be stabilized during cellular uptake. However, their coating dissociated in intracellular compartments such as lysosomes.17 Thus, new strategies are needed to improve both the uptake and the intracellular stability of QDs.
Amphiphilic block copolymers are known to self-assemble into various supramolecular aggregates such as micelles, tubes, sheets, or vesicles in aqueous solutions.18 In particular, polymersomes (Ps; so-called polymeric vesicles) have gained increasing interest in recent years for various biomedical applications, including their use as drug and gene delivery nanocarriers, nanoreactors, and even artificial organelles.19 Ps are nanometer-sized hollow spheres with an aqueous cavity surrounded by a hydrophobic membrane and hydrophilic inner and outer surfaces. They are promising candidates for nanocarriers because many hydrophilic and hydrophobic molecules can be incorporated into their aqueous cavity or their membrane, respectively.20,21 Additionally, chemical surface modifications can be used to tailor their physicochemical and biological properties to improve the delivery of a wide range of therapeutics.22,23 Numerous types of Ps have been proposed as nanocarriers for encapsulating small drug molecules, larger therapeutic proteins, and other types of nanoparticles.24–26 Reports on the use of Ps as carriers of water-soluble nanoparticles such as QDs are scarce.27 Recently, Ps prepared from amphiphilic poly (D,L-lactide)-poly(2-methacryloyl-oxy-ethylphosphorylcholine) (PLA-PMPC) diblock copolymers have been used to encapsulate phosphorylcholine-coated QDs. This coating confers hydrophilic properties to the QDs and also creates ion-pair interactions with PMPC, binding QDs to the inner and outer surfaces of Ps.27 However, this approach has limitations, since the presence of physiological buffer can destabilize the QDs and release them from the surface of the Ps.
The present study aimed to use a recent type of diblock copolymers composed of poly(dimethylsiloxane)-poly (2-methyloxazoline) (PDMS-PMOXA)28 to prepare Ps and to load them with QDs. The hydrophilic fraction and molecular weight of the PDMS-PMOXA were chosen to meet the prerequisites for diblock amphiphilic copolymers to form vesicles.29 The neutral hydrophilic PMOXA outside the Ps thereby acts as a protein repellent, similar to conventional polyethylene glycol (PEG), to minimize interactions with phagocytic cells such as macrophages and monocytes.30,31 In this way, colloidal stability, cellular delivery, and intracellular stability needed for cellular imaging were improved. QDs were loaded into the aqueous cavity of Ps made of PDMS-PMOXA without altering the surface properties of Ps. Loading efficiency and colloidal stability in suspension were characterized by transmission electron microscopy (TEM), fluorescence spectroscopy (FS), zeta potential, and fluorescence correlation spectroscopy (FCS). The cellular toxicity of PDMS-PMOXA Ps was excluded by the 3-(4,5-dimethylthiazol-2-yl)-2,5-diphenyltetrazolium bromide (MTT) assay. Intracellular delivery of Ps containing QDs was investigated in human liver carcinoma (HepG2) cells. Concentration- and time-dependent cellular uptake of Ps containing QDs in HepG2 cells was analyzed using confocal laser scanning microscopy (CLSM). Results were compared to those obtained for liposomes containing QDs.
Materials and methods
Amphiphilic block copolymers
Poly (dimethylsiloxane)-poly (2-methyloxazoline) (PDMS65-PMOXA14) was kindly provided by Prof Wolfgang Meier (Department of Chemistry, University of Basel, Basel, Switzerland). This amphiphilic diblock copolymer was synthesized as described elsewhere.28,31 An excess of pre-activated PDMS was used to induce the polymerization of the hydrophilic PMOXA blocks. Unreacted PDMS was removed from the diblock copolymer by centrifugation.
Preparation of Ps
Ps were prepared using a film rehydration method.32 PDMS-PMOXA diblock copolymer (5 mg) was first dissolved in pure ethanol (1 mL). The polymeric solution was evaporated to dryness using a rotary evaporator (Rotavapor; BÜCHI Labortechnik AG, Flawil, Switzerland; 174 mbar, 40°C, 80 rpm) to obtain a thin film. Residual humidity was removed in a vacuum oven (Vacutherm; Thermo Scientific, Wohlen, Switzerland) in high vacuum (0.3 mbar, 40°C, 4 hours). Phosphate buffer solution (PBS; 1 mL, 0.1 mM) was added to the film for rehydration under vigorous stirring at room temperature for 6 hours. The resulting suspension was extruded (Mini extruder; Avanti Polar Lipids, Alabaster, AL, USA) eleven times through a polycarbonate filter with an average pore diameter of 0.4 μm, followed by eleven extrusions through a filter with an average pore diameter of 0.2 μm (Nucleopores; Whatman, VWR International AG, Dietikon, Switzerland).
Loading of QDs
An aliquot (100 μL) of QDs solution (8 μM solution in 50 mM borate, pH 9) with a maximum red fluorescence emission of 625 nm (Qdot® ITK™ carboxyl quantum dots, cadmium–selenium core; Invitrogen, Life technologies, Lucerne, Switzerland) was mixed with PBS (900 μL, 1 mM) to obtain a final QDs concentration of 200 nM. The photoluminescence yield of CdSe QDs was previously reported to be negligible for emission wavelengths in the red spectral range.33 This suspension was added to a dry polymer film and stirred for 6 hours at room temperature and protected from light. QDs were encapsulated in Ps during the self-assembly process. After extrusion (as described in paragraph Preparation of PS), non-encapsulated QDs were removed by size-exclusion chromatography using a Sepharose 2B column (Sigma Aldrich, Buchs, Switzerland) eluted with PBS (0.1 mM). The first fraction corresponding to the Ps-containing QDs was detected by UV absorption at 280 nm. It should be noted that free QDs cannot be separated from the suspension by dialysis due to their big molecular size.
Dynamic light scattering
Suspensions of empty Ps and Ps-containing QDs were measured for average size and size distribution using dynamic light scattering (DLS) with a Delsa™ Nano C (Beckman Coulter, Inc., Nyon, Switzerland) equipped with Dual 30 mW laser diodes (wavelength lambda: 632.8 nm). Data were analyzed using the CONTIN program34 (DelsaNano UI software version 3.73/2.30, Beckman Coulter, Inc.).
Surface charge – zeta potential
Suspensions of free QDs, empty Ps, and Ps-containing QDs were measured for zeta potential determination using electrophoretic light scattering in a Delsa™ Nano C. Suspensions were measured in a flow cell using PBS as buffer. Data were converted with the Smoluchowski equation (DelsaNano UI software, Beckman Coulter, Inc.).
Transmission electron microscopy
Samples for transmission electron microscopy (TEM) were prepared using an aliquot (5 μL) of suspension of empty Ps and Ps-containing QDs on a carbon-coated grid. Samples were negatively stained with freshly prepared 2% uranyl acetate. The grids were air-dried overnight before TEM analysis (CM-100; Philips, Eindhoven, the Netherlands).
Fluorescence spectroscopy
A microplate fluorescence spectrometer (SpectraMax M2e, Molecular Device, Biberach an der Riss, Germany) was used to analyze the efficiency of loading QDs into Ps. All samples (free QDs, empty Ps, and Ps-containing QDs) were excited at 405 nm, and continuous emission spectra were recorded from 500 to 700 nm. All measurements were performed in a polystyrene 96-well microplate (Greiner-bio one, Frickenhausen, Germany). Fluorescence intensity of QDs changes over time. Therefore, fluorescence signals are represented in relative fluorescent units.
FCS
FCS measurements were performed on the surface of a cover glass using a Zeiss 510-META/Confocor2 laser-scanning microscope (Carl Zeiss AG, Feldbach, Switzerland) equipped with an argon laser (477 nm) in the FCS mode. Fluctuations of fluorescence intensity were processed by means of an autocorrelation function. FCS was used to analyze the loading of QDs into Ps and to determine quantitatively the number of QDs in each polymersome.35 Diffusion times of free QDs determined independently were included in the fitting procedure. All results represent the average of ten measurements. For stability determinations, Ps-containing QDs were analyzed regularly over a period of 6 weeks.
Cell culture
HepG2 cells (ATCC HB-8065) were kindly provided by Prof Dietrich von Schweinitz (University Hospital Basel, Basel, Switzerland). Cells were cultured in Dulbecco’s Modified Eagle Medium (DMEM) supplemented with low glucose (1 g/L), 10% fetal bovine serum (FBS), 0.1 mM non-essential amino acids (NEAA), 2 mM GlutaMAX™, and 10 mM HEPES (all obtained from Gibco, Life Technologies, Lucerne, Switzerland) at 37°C under 5% CO2 and saturated humidity. Cells were confirmed to be free of mycoplasma (MycoAlert™; Lonza, Visp, Switzerland).
MTT cellular toxicity assay
The 3-(4,5-dimethylthiazol-2-yl)-2,5-diphenyltetrazolium bromide (MTT) assay was used with some modifications as described elsewhere.36 The MTT stock solution (Roth AG, Arlesheim, Switzerland) was prepared by dissolving 5 mg MTT/mL PBS, sterile-filtered, and stored at 4°C. Briefly, HepG2 cells were seeded at a density of 2.5 × 10⁴ cells/well in a 96-well plate. After 24 hours, the medium was removed and 100 μL aliquots containing the corresponding concentration of Ps were added. A blank medium served as a negative control. After 24 hours, the medium was replaced by blank medium containing 10% MTT solution. The plates were incubated for 2 hours at 37°C, and the resultant formazan crystals were dissolved by adding 3% soduim dodecyl sulfate (20 μL) and 40 mM HCl (100 μL) in isopropanol. Optical density was measured at 550 nm using a spectrophotometer (SpectraMax M2e; Molecular Device). Test substances showed no absorbance overlapping with the signal of MTT. Unspecific background signal was determined at 680 nm and subtracted to reduce artifacts.
Cellular uptake of Ps-containing QDs
We analyzed the cellular uptake of Ps-containing QDs in HepG2 liver cancer cells using CLSM. HepG2 cells were cultured on poly-D-lysine–coated cover slips (#1.5; Menzel Glasbearbeitungswerk GmbH & Co, KG, Braunschweig, Germany). Cells were incubated at 37°C with Ps (100–500 μg/mL) or liposomes (0.14 mM of phospholipids) loaded with QDs. Nucleus counterstaining was performed by adding Hoechst 33342 dye (1 μg/mL) to the cells 5 minutes before the completion of the uptake assay. Cells were washed three times with cold D-PBS (Dulbecco’s PBS) and fixed for 15 minutes with 2% paraformaldehyde at 4°C. After an additional wash, slides were embedded in Prolong Gold antifade reagent (Gibco) and sealed with nail polish after drying. Samples were analyzed with an Olympus FV-1000 inverted confocal laser scanning microscope (Olympus, Le Mont-sur-Lausanne, Switzerland), using a 60× Plan Apo N oil-immersion objective (numerical aperture 1.40), and images were processed using either the Olympus FluoView software (v3.1, Olympus) or Gimp software (v2.8; GNU image manipulation program, http://www.gimp.org). Intracellular QDs were activated by light-emitting diodes (LEDs) with a wavelength of 400 nm (210 mW/cm2) or 490 nm (190 mW/cm2),37 using a pE-2 LED (CoolLED Limited, Andover, UK) excitation system. For activation, samples were exposed to a wavelength of 490 nm for 1 minute prior to analysis.
Results and discussion
Characterization of Ps
These last years, the development of Ps for technical or pharmaceutical applications is increasing. In this study, we have formulated Ps with a PDMS-PMOXA diblock copolymer, composed of 65 siloxane and 14 2-methyloxazoline units (Figure 1B),28,31 as nanosized carriers for QDs.
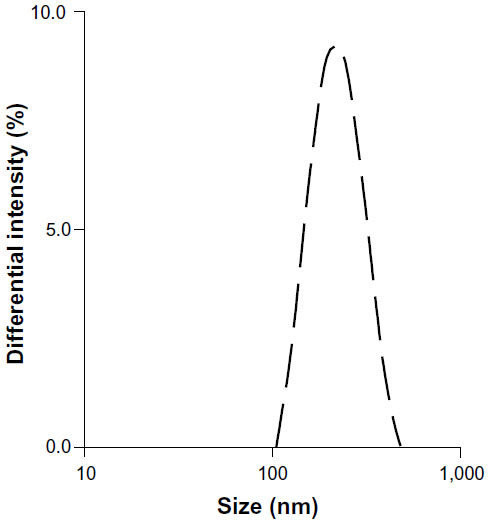
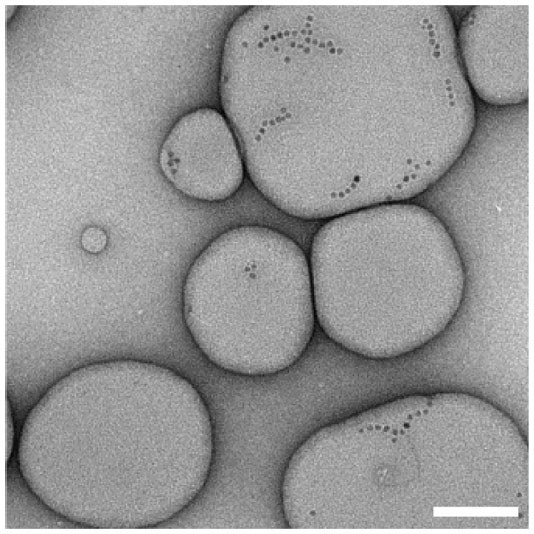
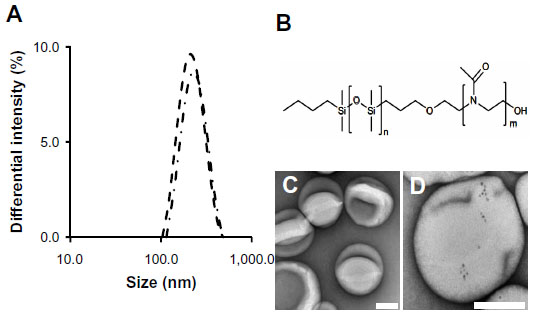 | Figure 1 Chemical composition, size, and morphology of PDMS-PMOXA Ps-containing QDs. (A) Size distribution of Ps determined by DLS. Average diameter of Ps was 200 nm (dashed line: empty Ps, dot-dashed line: Ps-containing QDs); (B) chemical structure of PDMS-PMOXA amphiphilic block copolymers; (C) TEM analysis of Ps; (D) TEM analysis of Ps-containing QDs. |
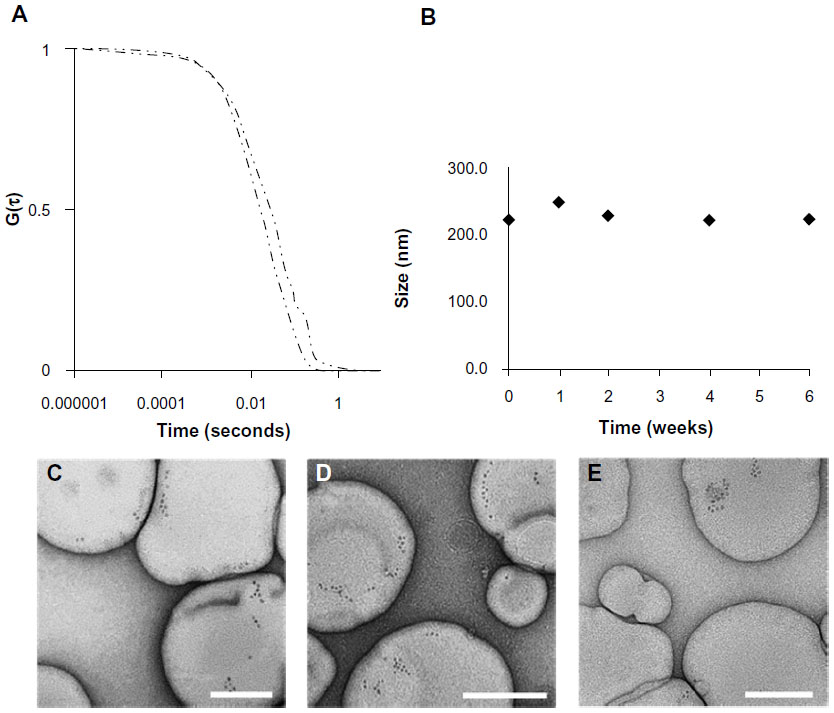
Size and morphology of extruded PDMS-PMOXA Ps were determined by DLS and TEM (Figure 1). The mean hydrodynamic diameter was approximately 205 nm for empty Ps and 223 nm for Ps-containing QDs (Figure 1A). Table 1 shows the polydispersity index (PDI) of free QDs, empty Ps, and Ps-containing QDs. The very low PDI values for both Ps preparations indicated a homogeneous population with a very narrow size distribution range.
 | Table 1 Size, PDI, and surface charge of QDs and Ps |
However, the absence of a significant difference in average diameters of the two Ps preparations suggests that encapsulation of high-molecular weight QD nanoparticles did not affect the molecular self-assembly of PDMS-PMOXA copolymers into Ps. In TEM investigations, we observed spherical vesicles with a diameter of approximately 200 nm, confirming the formation of Ps. Collapsed Ps revealed a hollow vesicular structure (Figure 1C). A recent report on self-assembly of a similar molecular composition of PDMS-PMOXA into vesicular structures supports our findings.28
Loading of QDs into Ps
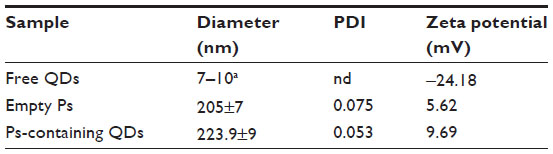
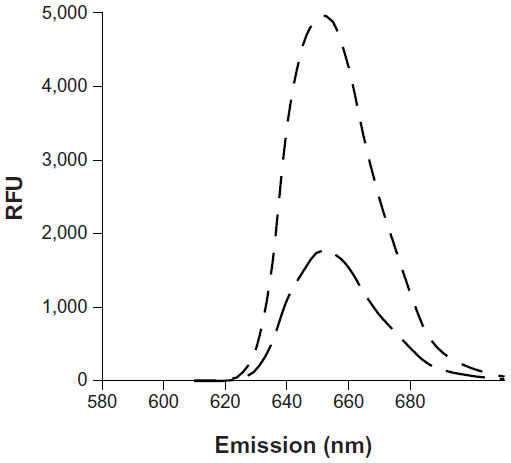
TEM investigations showed the presence of monodispersed QDs inside the Ps. QDs incorporated into Ps had the same appearance as free QDs in suspension, confirming that QDs were located in the aqueous compartment of the Ps without any aggregations. The morphology of empty Ps and Ps loaded with QDs remained the same (Figure 1D), confirming that encapsulation of QDs did not affect the formation of Ps. The number of QDs per Ps ranged from a single QD to tens of QDs, according to the statistical probability of available QDs in close proximity (for loading) during Ps formation. The stabilizing effect of the Ps provides indirect evidence that the QDs are contained inside the Ps, and are not just loosely attached to the outer surface of the Ps membrane. Figure 2A shows characteristic emission spectra of free QDs, empty Ps, and Ps-containing QDs at the excitation wavelength of 405 nm. The appearance of the characteristic emission of QDs without any shift in the Emmax (625 nm) in Ps-containing QDs and the absence of this emission peak in empty Ps demonstrated the loading of QDs in Ps without alteration of the fluorescent properties of QDs. Thus, QDs can be incorporated into Ps without aggregation and without affecting the fluorescence properties of QDs. The main advantage of QDs is not their high quantum yield, which is often lower than that of many organic dyes. However, their high absorption rate and increased photostability finally result in a brighter fluorescence signal. Moreover, the Stokes shift leads to a very low background signal. In Figure 2A, fluorescence signals obtained from Ps-containing QDs are lower than from free QDs. This can be explained by the fact that QDs are encapsulated within Ps, which absorbs some of the excitation light. In addition, not all QDs were entrapped within the Ps during their preparation and were thus lost during the consecutive purification steps. However, this reduced fluorescence intensity of encapsulated QDs can be easily compensated by an increased excitation light intensity since there is no risk of photobleaching.
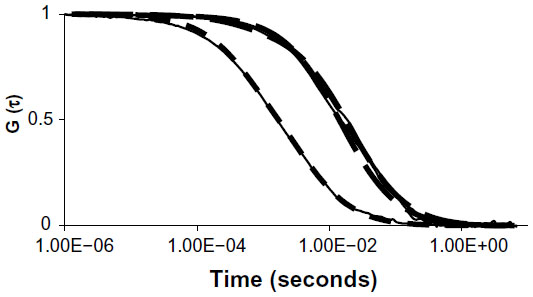
 | Figure 2 Analysis of QDs loading efficacy by fluorescence spectroscopy and FCS. (A) Emission fluorescence spectra of free QDs (dotted-lines), Ps-containing QDs (dot-dashed lines), and empty Ps (dashed lines), excitation wavelength 405 nm; (B) FCS auto-correlation curves, experimental (solid lines) and fitted (dashed-lines) of free QDs (dotted-lines) and Ps-containing QDs (dot-dashed lines). |
Free QDs are characterized by a negative surface charge (zeta potential: −25 mV; Table 1). After loading into Ps, the zeta potential increases to 9 mV. This positive value is very similar to the zeta potential of empty Ps. Thus, masking of the surface charge of QDs after loading into Ps is an indication of their presence within the Ps as opposed to a mere binding to the outer surface of the Ps.
FCS analyzes the intensity fluctuations of molecules in a defined confocal volume. These signals can be correlated to the diffusion time of molecules (τD). We determined that τD=4,000 μs for freely diffusing QDs and τD=15,000–17,000 μs for QDs loaded into Ps (Figure 2B). This is in agreement with the reported diffusion time of Ps of a similar size based on the PDMS-PMOXA block copolymer.28
Molecular brightness measurements have been used to calculate the number of fluorescent molecules encapsulated inside each polymersome.25,38 We estimated the average number of QDs per polymersome based on brightness obtained from the count rate per molecule (cpm, kHz). We calculated an average of four QDs/polymersome based on the brightness of free QDs and QDs encapsulated in Ps. The loading efficiency of Ps in our study was comparable with the reported loading efficiency of liposomes (ie, three QDs/liposome on average).39,40 However, we aimed to improve the loading efficiency by introducing 5% amine-functionalized PDMS-PMOXA copolymers in hydroxyl-functionalized PDMS-PMOXA copolymers to generate charges in the copolymer system (Figures S1–S4 in supplementary material). We calculated an average of eight QDs/Ps based on brightness measurements. This was clearly superior to the loading of purely hydroxyl-functionalized copolymers (neutral charge). Our results suggest that introducing a small amount of amine-functionalized monomers to the copolymer system causes favorable electrostatic interactions leading to improved loading efficiency. Geometric considerations and analysis of TEM images suggest that much higher loading efficiency can be achieved up to a theoretical maximal up-loading content of 4,900 QDs per polymersome. However, the achieved accumulation of QDs at picomolar concentrations within individual Ps is sufficient to induce a bright fluorescence signal suitable for cellular imaging (see below).
Stability of Ps-containing QDs
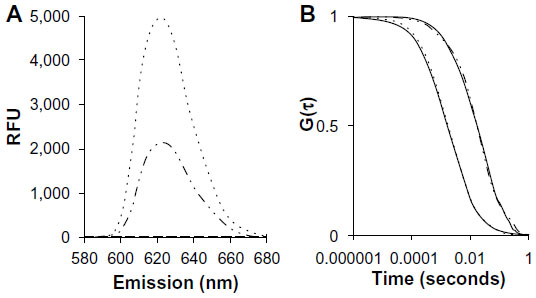
The stability of Ps-containing QDs was investigated using size measurements by DLS, morphology analysis by TEM, and FCS analysis yielding release profiles of QDs from Ps. These tests were carried out over a period of 6 weeks at regular intervals (Figure 3). We did not observe any significant changes in size (~200 nm) or size distribution, suggesting that Ps were highly stable and remained intact (Figure 3D). In addition, TEM showed the presence of QDs inside the Ps (~200 nm), with no free QDs outside the Ps between day 1 and week 6 (Figure 3B and C).
 | Figure 3 Long-term stability of Ps-containing QDs. |
For stability analysis, auto-correlation curves obtained with FCS were fitted with a two components model. Diffusion times of free QDs were determined independently and were included in the fitting procedure. The majority of the particle population (99.9%) represented QDs encapsulated in Ps, as confirmed by corresponding diffusion times (τD=15,000–17,000 μs), that were similar to those of freshly prepared Ps loaded with QDs (Figure 3A). This finding confirms that QDs were not released from the Ps even after 6 weeks, due to the robust impermeable membrane of the Ps (~15 nm).28 In addition, passive transmembrane diffusion is unlikely due to the high molecular weight of the QDs. Thus, DLS, TEM, and FCS experiments clearly indicated that Ps were highly stable. They retained their size and shape and entrapped the QDs for a long period of time.
Cellular viability (MTT) assay
Various types of PMOXA-PDMS-PMOXA tri-block copolymers were previously suggested to be non-toxic and non-immunogenic.30,31 The PDMS-PMOXA diblock copolymer used in the present study showed no cellular toxicity in a HepG2 human liver carcinoma cell line (Figure 4). There was no loss of viability in HepG2 cells after 24 hours of incubation with PDMS-PMOXA Ps at concentrations up to 300 μg/mL.
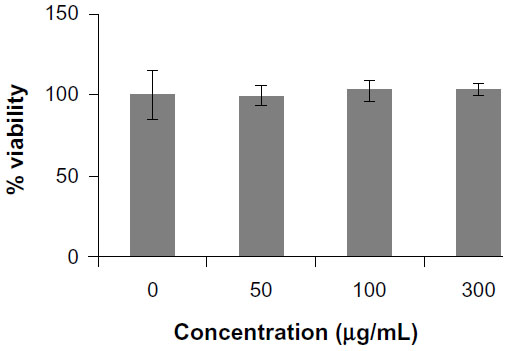 | Figure 4 Viability of HepG2 cells incubated with Ps (MTT assay). HepG2 cells showed no loss of viability after 24 hours of incubation with different concentrations of Ps (50–300 μg/mL). |
Cellular uptake of Ps-containing QDs
Time-and dose-dependent uptake kinetics of Ps-containing QDs were studied using incubation times of 1, 7, and 24 hours and different polymer concentrations (100 μg/mL, 300 μg/mL, 500 μg/mL). While no uptake was observed for any concentrations after 1 hour of incubation, the uptake rate increased linearly from 7 hours to 24 hours, indicating the time-dependent uptake of Ps-containing QDs. Simultaneously, we observed a gradual increase in the uptake rate between the low concentration (100 μg/mL) to higher concentration (300 μg/mL), suggesting dose-dependent uptake (Figure 5). The appearance of red fluorescent signals, mainly in the perinuclear regions, was indicative of the intracellular accumulation of Ps-containing QDs in HepG2 cells. Concentrations of Ps used for imaging purposes rarely exceed 100 μg/mL. Under these conditions, cellular uptake is minimal. Free QDs are rapidly taken up by living cells. However, this process is not specific, and therefore QDs cannot be used to label defined tissues or sub-populations of cells within tissues. In addition, free Cd/Se QDs are cytotoxic because of their heavy metal core. In contrast, Ps-containing QDs were demonstrated in our work to be non-cytotoxic. Their cellular uptake is negligible. This absence of unspecific cellular interactions is a mandatory prerequisite for their use to implement specific targeting strategies. For this latter purpose (ie, to promote cellular targeting and uptake), Ps can be modified by covalent modification of their surfaces using, for example, receptor-specific targeting ligands. Thus, surface-modified, polymer-based nanoparticles can be conveniently labeled with stabilized QDs to study and visualize their cellular interactions.41 The low uptake between 1 hour and 7 hours suggests that the PMOXA block acts as a protein repellent, reducing cellular interactions of Ps. This property has previously been described for other types of nanoparticles such as PEGylated liposomes,41 and is a prerequisite for in vivo implementation of targeting strategies. Thus, prolonged incubation (24 hours) was needed to induce forced uptake by HepG2 cells. We presume that cellular uptake can be further increased by surface modifications of the Ps, such as, for example, cationization or coupling of specific receptor ligands.41 Previous publications suggest that cellular uptake of nanoparticles is a prerequisite to induce cellular toxicity.42 In order to explore the potential toxic effect of the Ps, the concentration in medium was increased to 300 μg/mL. A long incubation time (24 hours) under these conditions led to cellular uptake. However, the MTT assay demonstrated an absence of toxicity under these conditions of forced uptake. Therefore, we recommend to limit incubation times with Ps-containing QDs to 24 hours and not to exceed a polymer concentration of 100 μg/mL.
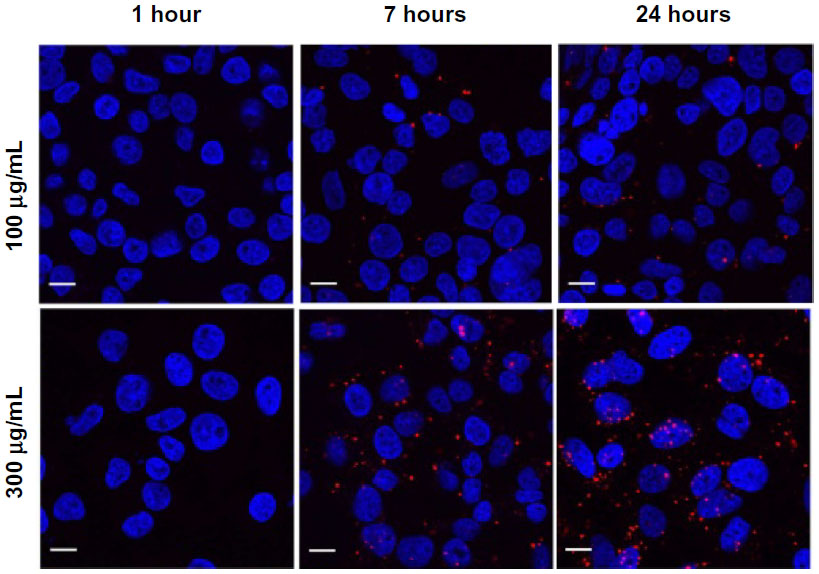 | Figure 5 Dose- and time-dependent uptake of Ps-containing QDs in HepG2 cells. Ps concentrations incubated with HepG2 cells were 100 μg/mL (upper row, recommended concentration) to 300 μg/mL (lower row). Incubation times were 1 hour (left column), 7 hours (center column), and 24 hours (right column, condition of forced uptake). QDs were photo-activated at a wavelength of 490 nm for 1 minute. Red fluorescence: Ps-containing QDs, blue fluorescence: nuclei stained with Hoechst 33342. |
Intracellular stability of Ps-containing QDs
QDs encapsulated in Ps or liposomes can be photoactivated by UV irradiation at 405 nm. This is a widely used technique to enhanced fluorescence signals of QDs in suspension or cells.43 Photoactivation was made evident by a blue-shift of cellular emission fluorescence signals by 10 nm (Ps) or 15 nm (liposomes), as compared to free QDs (Figure 6C). This is indicative of the slow degradation of the QD core under these conditions. In liposomes, photoactivation of encapsulated QDs resulted in a blurred and unspecific staining of the whole cell cytoplasm (data not shown, preparation of liposomes containing QDs can be found in supplementary material). However, photoactivation of QDs in Ps resulted in a sharp and punctuated intracellular staining pattern (Figure 6A and B). These results suggest that QDs encapsulated in Ps were retained in the intact polymer vesicles, whereas QDs encapsulated in liposomes were released into the cytoplasm due to degradation of the liposomal carrier.
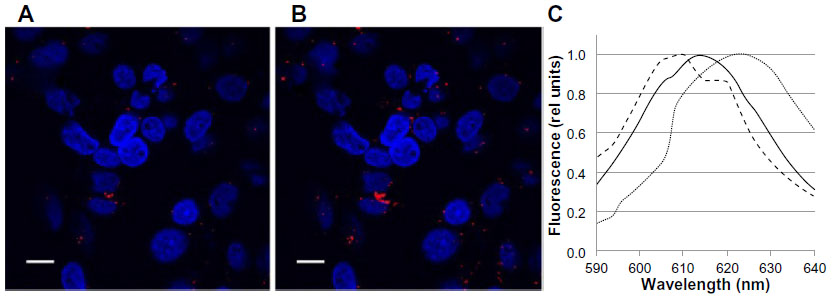 | Figure 6 Fluorescence activities of QDs loaded into Ps under intracellular conditions. |
In living cells, photoactivation of QDs is caused by the generation of reactive oxygen species (ROS) within the target cell.43 In view of the pronounced intracellular stability of Ps, the question arises how oxidation of QDs within Ps can be induced by cellular ROS. It was recently proposed that the membranes of Ps are permeable to ROS, such as superoxide or singlet oxygen, which are major contributors to the degradation of the QD surface.43,44
For a similar type of Ps made of PMOXA-PDMS-PMOXA, ROS were reported to permeate the polymer membrane. Ps remained stable inside cells after having escaped from endosomes without releasing the encapsulated compounds.24,25,45 Therefore, it is possible that in our experiments, QDs were partially degraded inside the Ps without being released. Due to the stability of Ps in cellular conditions, degradation of QDs and background signals were dramatically lower in Ps than in liposomes. Similarly, increased photo-enhancement of QDs embedded in silica colloids have been reported in living cells, due to partial degradation mediated by oxidation with minimal aggregation.46 Results suggested that Ps protect QDs from biological interactions in cell compartments, thus improving the quality of cellular imaging.
Conclusion
QDs are a promising tool for a variety of bio-imaging applications. However, their use in biological systems is limited by their chemical instability and toxicity. We demonstrated that loading of QDs into Ps made of the diblock copolymer PDMS-PMOXA may overcome these problems. In particular, Ps-containing QDs were stable for a prolonged time upon storage and had improved optical properties after cellular uptake.
The implications of these findings are two-fold. First, stabilization of QDs by a protective shell of diblock copolymers may facilitate their preparation, storage, and use in biological systems. Second, chemical modification of the Ps surface may improve their recognition and uptake by target cells. Therefore, design of such targeted Ps offers the possibility to deliver QDs to specific cellular targets within the organism for diagnostic purposes or imaging applications.
Acknowledgments
We would like to thank Professor Dr Wolfgang Meier for providing the PDMS-PMOXA diblock copolymers. We thank Dr Silvia Rogers for editorial assistance.
Disclosure
The authors report no conflicts of interest in this work.
References
Bruchez M, Moronne M, Gin P, Weiss S, Alivisatos AP. Semiconductor nanocrystals as fluorescent biological labels. Science. 1998;281(5385):2013–2016. | |
Chan WC. Quantum dot bioconjugates for ultrasensitive nonisotopic detection. Science. 1998;281(5385):2016–2018. | |
Resch-Genger U, Grabolle M, Cavaliere-Jaricot S, Nitschke R, Nann T. Quantum dots versus organic dyes as fluorescent labels. Nat Methods. 2008;5(9):763–775. | |
Alivisatos AP, Gu W, Larabell C. Quantum dots as cellular probes. Annu Rev Biomed Eng. 2005;7:55–76. | |
Derfus AM, Chan WCW, Bhatia SN. Probing the cytotoxicity of semiconductor quantum dots. Nano Lett. 2004;4(1):11–18. | |
Michalet X, Pinaud FF, Bentolila LA, et al. Quantum dots for live cells, in vivo imaging, and diagnostics. Science. 2005;307(5709):538–544. | |
Hardman R. A toxicologic review of quantum dots: toxicity depends on physicochemical and environmental factors. Environ Health Perspect. 2006;114(2):165–172. | |
Hu X, Gao X. Silica-polymer dual layer-encapsulated quantum dots with remarkable stability. ACS Nano. 2010;4(10):6080–6086. | |
Zhang H, Zeng X, Li Q, Gaillard-Kelly M, Wagner CR, Yee D. Fluorescent tumour imaging of type I IGF receptor in vivo: comparison of antibody-conjugated quantum dots and small-molecule fluorophore. Br J Cancer. 2009;101(1):71–79. | |
Selvan ST, Tan TTY, Yi DK, Jana NR. Functional and multifunctional nanoparticles for bioimaging and biosensing. Langmuir. 2010;26(14):11631–11641. | |
Derfus AM, Chan WCW, Bhatia SN. Intracellular delivery of quantum dots for live cell labeling and organelle tracking. Adv Mater. 2004;16(12):961–966. | |
Jańczewski D, Tomczak N, Han MY, Vancso GJ. Synthesis of functionalized amphiphilic polymers for coating quantum dots. Nat Protoc. 2011;6(10):1546–1553. | |
Gao X, Cui Y, Levenson RM, Chung LWK, Nie S. In vivo cancer targeting and imaging with semiconductor quantum dots. Nat Biotechnol. 2004;22(8):969–976. | |
Gerion D, Pinaud F, Williams SC, et al. Synthesis and properties of biocompatible water-soluble silica-coated CdSe/ZnS semiconductor quantum dots. J Phys Chem B. 2001;105(37):8861–8871. | |
Bayles AR, Chahal HS, Chahal DS, Goldbeck CP, Cohen BE, Helms BA. Rapid cytosolic delivery of luminescent nanocrystals in live cells with endosome-disrupting polymer colloids. Nano Lett. 2010;10(10):4086–4092. | |
Kong L, Zhang T, Tang M, Pu Y. Apoptosis induced by cadmium selenide quantum dots in JB6 cells. J Nanosci Nanotechnol. 2012;12(11):8258–8265. | |
Chen H, Zou P, Connarn J, Paholak H, Sun D. Intracellular dissociation of a polymer coating from nanoparticles. Nano Res. 2012;5(11):815–825.v | |
Balasubramanian V, Onaca O, Enea R, Hughes DW, Palivan CG. Protein delivery: from conventional drug delivery carriers to polymeric nanoreactors. Expert Opin Drug Deliv. 2010;7(1):63–78. | |
Battaglia G. Polymersomes and Their Biomedical Applications. In: Nanotechnologies for the Life Sciences. Weinheim, Germany: Wiley-VCH Verlag; 2007. Available at: http://onlinelibrary.wiley.com/doi/10.1002/9783527610419.ntls0250/abstract. Accessed June 3, 2013. | |
Lee JS, Feijen J. Polymersomes for drug delivery: design, formation and characterization. J Controlled Release. 2012;161(2):473–483. | |
Ahmed F, Pakunlu RI, Brannan A, Bates F, Minko T, Discher DE. Biodegradable polymersomes loaded with both paclitaxel and doxorubicin permeate and shrink tumors, inducing apoptosis in proportion to accumulated drug. J Controlled Release. 2006;116(2):150–158. | |
Sanson C, Schatz C, Le Meins J-F, et al. A simple method to achieve high doxorubicin loading in biodegradable polymersomes. J Controlled Release. 2010;147(3):428–435. | |
Lomas H, Canton I, MacNeil S, et al. Biomimetic pH sensitive polymersomes for efficient DNA encapsulation and delivery. Adv Mater. 2007;19(23):4238–4243. | |
Balasubramanian V, Onaca O, Ezhevskaya M, Doorslaer SV, Sivasankaran B, Palivan CG. A surprising system: polymeric nanoreactors containing a mimic with dual-enzyme activity. Soft Matter. 2011;7(12):5595–5603. | |
Tanner P, Onaca O, Balasubramanian V, Meier W, Palivan CG. Enzymatic cascade reactions inside polymeric nanocontainers: a means to combat oxidative stress. Chemistry. 2011;17(16):4552–4560. | |
Jaskiewicz K, Larsen A, Schaeffel D, et al. Incorporation of nanoparticles into polymersomes: size and concentration effects. ACS Nano. 2012;6(8):7254–7262. | |
Liu GY, Liu XS, Wang SS, Chen CJ, Ji J. Biomimetic polymersomes as carriers for hydrophilic quantum dots. Langmuir. 2012;28(1):557–562. | |
Egli S, Nussbaumer MG, Balasubramanian V, et al. Biocompatible functionalization of polymersome surfaces: a new approach to surface immobilization and cell targeting using polymersomes. J Am Chem Soc. 2011;133(12):4476–4483. | |
Mai Y, Eisenberg A. Self-assembly of block copolymers. Chem Soc Rev. 2012;41(18):5969. | |
De Vocht C, Ranquin A, Van Ginderachter J, et al. Polymeric nanoreactors for enzyme replacement therapy of MNGIE. J Control Release. 2010;148(1):e19–e20. | |
Nardin C, Hirt T, Leukel J, Meier W. Polymerized ABA triblock copolymer vesicles. Langmuir. 2000;16(3):1035–1041. | |
Lee JC-M, Bermudez H, Discher BM, et al. Preparation, stability, and in vitro performance of vesicles made with diblock copolymers. Biotechnol Bioeng. 2001;73(2):135–145. | |
Qu L, Peng X. Control of photoluminescence properties of CdSe nanocrystals in growth. J Am Chem Soc. 2002;124(9):2049–2055. | |
Williams G, Watts DC, Dev SB, North AM. Further considerations of non symmetrical dielectric relaxation behaviour arising from a simple empirical decay function. Trans Faraday Soc. 1971;67(0):1323–1335. | |
Rigler P, Meier W. Encapsulation of fluorescent molecules by functionalized polymeric nanocontainers: investigation by confocal fluorescence imaging and fluorescence correlation spectroscopy. J Am Chem Soc. 2006;128(1):367–373. | |
Seeland S, Török M, Kettiger H, Treiber A, Hafner M, Huwyler J. A cell-based, multiparametric sensor approach characterises drug-induced cytotoxicity in human liver HepG2 cells. Toxicol In Vitro. 2013;27(3):1109–1120. | |
CoolLED. LED Intensity – CoolLED. 2012. Available at: http://www.coolled.com/Life-Sciences-Analytical/Products/pE-2/. Accessed October 17, 2012. | |
Onaca O, Hughes DW, Balasubramanian V, Grzelakowski M, Meier W, Palivan CG. SOD antioxidant nanoreactors: influence of block copolymer composition on the nanoreactor efficiency. Macromol Biosci. 2010;10(5):531–538. | |
Sigot V, Arndt-Jovin DJ, Jovin TM. Targeted cellular delivery of quantum dots loaded on and in biotinylated liposomes. Bioconjug Chem. 2010;21(8):1465–1472. | |
Chen C-S, Yao J, Durst R. Liposome encapsulation of fluorescent nanoparticles: quantum dots and silica nanoparticles. J Nanoparticle Res. 2006;8(6):1033–1038. | |
Huwyler J, Drewe J, Krähenbuhl S. Tumor targeting using liposomal antineoplastic drugs. Int J Nanomedicine. 2008;3(1):21–29. | |
Kettiger H, Schipanski A, Wick P, Huwyler J. Engineered nanomaterial uptake and tissue distribution: from cell to organism. Int J Nanomedicine. 2013;8:3255–3269. | |
Zhang Y, He J, Wang P-N, et al. Time-dependent photoluminescence blue shift of the quantum dots in living cells: effect of oxidation by singlet oxygen. J Am Chem Soc. 2006;128(41):13396–13401. | |
Carrillo-Carrión C, Cárdenas S, Simonet BM, Valcárcel M. Quantum dots luminescence enhancement due to illumination with UV/Vis light. Chem Commun (Camb). 2009;(35):5214–5226. | |
Baumann P, Balasubramanian V, Onaca-Fischer O, Sienkiewicz A, Palivan CG. Light-responsive polymer nanoreactors: a source of reactive oxygen species on demand. Nanoscale. 2013;5(1):217–224. | |
Dembski S, Graf C, Krüger T, et al. Photoactivation of CdSe/ZnS quantum dots embedded in silica colloids. Small. 2008;4(9):1516–1526. |
Supplementary material
Materials and methods
Preparation of liposomes containing QDs
A mixture of lipids of disuccinatocisplatin (DSPC; 5.5 μmol), cholesterol (4.5 μmol), and 1,2-distearoyl-sn-glycero-3-phosphoethanolamine-N-poly(ethylene glycol) (DSPE-PEG; 0.27 μmol), were dissolved in chloroform/methanol (2:1, volume/volume). The solution was evaporated by vacuum in a water bath at 60°C for 1 hour to form a homogenous lipid film using a rotary evaporator (Rotavapor, BüCHI Labortechnik AG, Flawil, Switzerland). The lipid film was hydrated for 10 minutes in 1 mL in a 100 nM solution of QDs (Qdot® ITK™ carboxyl quantum dots; Invitrogen, Life Technologies, Lucerne, Switzerland) in 0.1 M phosphate buffer solution (PBS) containing 1 mM EDTA, pH 7.2; extrusion was performed five times through a polycarbonate filter with an average pore diameter of 0.2 μm, followed by nine extrusions through a filter with an average pore diameter of 0.08 μm (Nucleopores, Whatman, VWR International AG, Dietikon, Switzerland).
Liposomes containing QDs were purified by size exclusion chromatography using a Superose 6 prep column (1.6 × 20 cm), (GE Healthcare, Cleveland, OH, USA) eluting with 0.01 M PBS, pH 7.2.
Results
 | Figure S1 Size of Ps made of PDMS-PMOXA with 5% amine function (long-dashed lines), loaded with QDs. Average diameter of Ps was 210 nm. |
 | Figure S2 TEM morphology analysis of Ps made of PDMS-PMOXA with 5% amine function, loaded with QDs. |
 | Figure S3 Analysis of QDs loading efficacy by fluorescence spectroscopy. Emission fluorescence spectra of free QDs (dotted-lines), Ps with 5% amine function containing QDs (long-dashed lines), and empty Ps (dashed lines), excitation wavelength 405 nm. |
 | Figure S4 Analysis of QDs loading efficacy by FCS. FCS auto-correlation curves, experimental (solid lines) and fitted (dashed-lines) of free QDs (dotted-lines), Ps-containing QDs (dot-dashed lines), and Ps with 5% amine function containing QDs (long-dashed lines). |
 © 2014 The Author(s). This work is published and licensed by Dove Medical Press Limited. The
full terms of this license are available at https://www.dovepress.com/terms
and incorporate the Creative Commons Attribution
- Non Commercial (unported, 3.0) License.
By accessing the work you hereby accept the Terms. Non-commercial uses of the work are permitted
without any further permission from Dove Medical Press Limited, provided the work is properly
attributed. For permission for commercial use of this work, please see paragraphs 4.2 and 5 of our Terms.
© 2014 The Author(s). This work is published and licensed by Dove Medical Press Limited. The
full terms of this license are available at https://www.dovepress.com/terms
and incorporate the Creative Commons Attribution
- Non Commercial (unported, 3.0) License.
By accessing the work you hereby accept the Terms. Non-commercial uses of the work are permitted
without any further permission from Dove Medical Press Limited, provided the work is properly
attributed. For permission for commercial use of this work, please see paragraphs 4.2 and 5 of our Terms.