Back to Journals » Journal of Pain Research » Volume 12
PINK1 mediates spinal cord mitophagy in neuropathic pain
Authors Yi MH ![]() , Shin J
, Shin J ![]() , Shin N
, Shin N ![]() , Yin Y
, Yin Y ![]() , Lee SY
, Lee SY ![]() , Kim CS, Kim SR
, Kim CS, Kim SR ![]() , Zhang E, Kim DW
, Zhang E, Kim DW ![]()
Received 18 December 2018
Accepted for publication 24 April 2019
Published 28 May 2019 Volume 2019:12 Pages 1685—1699
DOI https://doi.org/10.2147/JPR.S198730
Checked for plagiarism Yes
Review by Single anonymous peer review
Peer reviewer comments 2
Editor who approved publication: Professor E Alfonso Romero-Sandoval
Min-Hee Yi,1 Juhee Shin,2,3 Nara Shin,2,3 Yuhua Yin,2,4 Sun Yeul Lee,4 Cuk-Seong Kim,3,5 Sang Ryong Kim,6 Enji Zhang,7 Dong Woon Kim2,3
1Department of Neurology, Mayo Clinic, Rochester, MN 55905, USA; 2Department of Anatomy, Brain Research Institute, Chungnam National University School of Medicine, Daejeon 301-747, Republic of Korea; 3Department of Medical Science, Chungnam National University School of Medicine, Daejeon 301-747, Republic of Korea; 4Department of Anesthesiology and Pain Medicine, Chungnam National University Hospital, Daejeon 301-747, South Korea; 5Department of Physiology, Chungnam National University School of Medicine, Daejeon 301-747, Republic of Korea; 6School of Life Sciences, BK21 Plus KNU Creative BioResearch Group, Institute of Life Science & Biotechnology, Brain Science and Engineering Institute, Kyungpook National University, Daegu 41566, Republic of Korea; 7Department of Anesthesia Medicine, Yanbian University Hospital, Yanbian 133000, People’s Republic of China
Background: Mitophagy is the selective engulfment of mitochondria by autophagosomes and the subsequent mitochondrial catabolism by lysosomes. Evidence has suggested an important role for mitochondrial dynamics and mitophagic flux in the development of many different neurodegenerative diseases.
Objectives: The potential role of the mechanism underlying mitochondrial dynamics and mitophagic flux as it may relate to neuropathic pain is not well understood. This is a disease that largely remains an area of mechanistic uncertainty. PINK1 is a PTEN-induced mitochondrial kinase that can be selectively activated under mitochondrial stress conditions and lead to the induction of mitophagy.
Materials and methods: A neuropathic pain rat model was established via spinal nerve ligation (SNL) and nociception was assayed via the von Frey filament method. Increased expression of PINK1 and the mechanism of mitophagy was detected in GABAergic interneurons of dorsal horn neurons of mice that underwent L5 SNL in comparison to control mice counterparts (n=8, P<0.001) by Western blotting, immunohistochemistry and double immunofluorescence staining.
Results: Elevated expression of PINK1 appeared to localize selectively to GABAergic interneurons, particularly within autophagic mitochondria as evidenced by co-localization studies of PINK1 with BECN1, LC3II and COX IV on immunofluorescent microscopy. Furthermore, we also detected a significant increase in autophagosomes in dorsal horn neurons of SNL mice and this was consistent with increased autophagic activity as measured by the p62 autophagic substrate.
Conclusion: These results demonstrate that neuropathic pain causes aberrant mitophagic flux selectively in GABAergic interneurons and provide evidence implicating mitophagy as an important area of future molecular studies to enhance our understanding of neuropathic pain.
Keywords: neuropathic pain, PINK1, mitophagy, GABAergic interneuron, autophagosome
Corrigendum for this paper has been published
Introduction
Complex chronic pain that usually accompanies tissue insult, whereby nerve fibers undergo cell damage and dysfunction injury,1 is known as neuropathic pain. Unchecked, the neuronal cells involved will eventually undergo cell death through a process that is likely to involve autophagy, as recent studies have now shown.2 Pain accompanies various neurodegenerative diseases, where autophagy plays an important role in the progression of the pathology and is also being studied as a possible therapeutic target.3,4 Autophagy is modulated differently in the spinal cord in several neuropathic pain models.5
However, the regulatory mechanisms involved in this process have not been fully elucidated. We have previously demonstrated that levels of autophagy markers LC3 and Beclin1 were higher in GABAergic interneurons of the spinal dorsal horn after spinal nerve ligation (SNL).6 Indeed, several lines of evidence have also implied a strong role for GABAergic dysregulation in other important aspects of neuropathic pain. In one study, Gwak et al reported that neuropathic pain induced by spinal cord injury (SCI) causes reduction of GAD65 expression, mechanical allodynia, and neuronal hyperexcitability in the spinal dorsal horn.7 Also, pharmacologically induced inhibition of spinal GABAA- and GABAB-receptor-mediated inhibitory transmission triggered neuropathic pain.8–10
Mitochondria, being the “powerhouses” of the cell, generate the adenosine triphosphate (ATP) required by virtually all cellular processes.11 The integrity of the mitochondrial pool is therefore essential to maintain a healthy neuronal environment. Many mitochondrial “quality-control” pathways are known that function in mediating degradation of misfolded mitochondrial proteins, mitochondrial fission/fusion, and the engulfment and degradation of damaged mitochondria (mitophagy).12 Autophagic removal of dysfunctional mitochondria is essential to prevent cellular oxidative stress, generate apoptotic signals, and induce cell death. Mitophagy and mitochondrial biogenesis may act in a coordinated manner to sustain cell survival and function,13 and has been shown to be important in various neurological disorders including Parkinson’s disease (PD) and Alzheimer’s disease. The mitochondrial contribution to sensory processing and pain generation remained relatively unexplored until about 10 years ago.14,15
PINK1 is a well-known critical marker in the pathway for regulation of mitophagy as well as mitochondrial dysfunction.16 This study aimed to investigate the role of PINK1 in mitochondrial damage in neuropathic pain. We found that SNL-induced neuropathic pain in mice caused increased mitophagic marker PINK1 expression in the spinal dorsal horn neuron, particularly within GABAergic interneurons. Moreover, we show that PINK1 knockout mice exhibited decreased neuropathic hypersensitivity. Here, we provide evidence that mitophagy plays a role in the reduction of GABAergic inhibition following SNL-mediated induction of neuropathic pain.
Materials and methods
Animals and surgery
Male Sprague–Dawley rats (180–200 g, Koatech, Pyungtaek City, Republic of Korea) and C57BL/6J were individually housed in cages under a standard 12:12-h light:dark cycle. Pink1 heterozygous was used as the wild-type control. Pink1 knockout mice were a gift of Dr Eun-Hye Joe.17 Water and food were available ad libitum until the rats were transported to the laboratory approximately 1 h prior to experiments. All experiments were approved by the Animal Care and Use Committee of Chungnam National University, and adhered to the ethical guidelines of the National Institutes of Health and the International Association for the Study of Pain. Surgery was performed under 2% isoflurane anesthesia. An incision was made along the mid-line of the lumbar spine. The left paraspinal muscles in front of the pelvic bone were separated to expose the transverse process. The L5 transverse process was removed to expose L4 and L5 spinal nerve. The left L5 spinal nerve was isolated and tightly ligated with 3–0 silk thread for SNL induced neuropathic pain model. To perform SNT neuropathic pain, mice were anesthetized with an intraperitoneal injection of Avertin (2,2,2-tribromoethanol, 50% in tertiary amyl alcohol, diluted 1:40 in H2O; 20 mL/kg, i.p.; Sigma-Aldrich Co., St Louis, MO, USA). The L5 transverse was exposed in the same way with SNL model and transected 1–1.5 mm from the end to DRG. Complete hemostasis was confirmed and the wound sutured with 3–0 silk sutures for the muscles and 5–0 silk sutures for the skin. The surgical procedure for the sham-treated group was identical to that described above, except that the spinal nerve was not ligated.
Behavioral measurement
Mechanical allodynia was assessed by measuring the paw withdraw threshold, with a set of von Frey filaments (0.007, 0.016, 0.4, 0.6, 1, 1.4, 2, 4, 6, 8, 10, and 15 g; grade 39337500, Touch Test™ Sensory Evaluator Kit 20). Rat and mice were placed on an elevated metal grid. The filament was applied to the plantar surface for up 4–6 s to the region between the footpads of the plantar aspect of the hind paw. Fifty percent withdraw threshold values were determined using the up-down method.18
Immunohistochemistry and double immunofluorescence staining
Immunohistochemical tests were performed 14 days after surgery. Rats were deeply anesthetized with sodium pentobarbital (50 mg/kg intraperitoneally), and transcardially perfused with heparinized phosphate-buffered saline (PBS, pH 7.4), followed by 4% (v/v) paraformaldehyde, for 15 min. The enlarged lumbar regions (L4–L6) of the spinal cords were immediately removed and immersed in the same fixative overnight at 4°C. The samples were then transferred to 30% sucrose in PBS overnight and then embedded in paraffin.
Sections of spinal cord tissue that were 15 µm thick were deparaffinized and rehydrated in a graded series of alcohol baths. Antigens were retrieved by heating in a microwave vacuum histoprocessor (RHS-1, Milestone, Bergamo, Italy) containing 0.01 M citrate buffer (pH 6.0) at 121°C for 15 min. Endogenous peroxidase activity was blocked using 0.3% (v/v) hydrogen peroxide. All sections were treated with Protein Block solution (Dako, Glostrup, Denmark) for 20 min and then incubated with polyclonal antisera against PINK1 (1:200, #genta-NBP1-39667, ACR) overnight in a humid chamber at 4°C. After washing with PBS, the tissues were exposed to biotinylated anti-rabbit IgG and a streptavidin–peroxidase complex (Vector Laboratories, Inc., Burlingame, CA, USA). Immunostaining was visualized with diaminobenzidine (DAB); all specimens were mounted with the aid of Polymount (Polysciences, Inc., Warrington, PA, USA).
The sections were blocked with 5% chicken serum and 0.3% Triton X-100 (9002-93-1) in PBS buffer for 1 h, and incubated overnight at 4°C with primary antibody for rabbit anti-PINK1 (#genta-NBP1-39667 1:200), LC3II 1:400, #AP1801a (Abgent, San Diego, CA, USA) anti-COX IV (1:50, #11967, Cell Signaling Technology, Danvers, MA, USA), anti-Cyto C (1:200, #4280, Cell Signaling Technology), anti-p62 (1:500, P0067, Sigma), or anti-BECN (1:200, AP1818a, Abgent). The sections were then incubated for 2 h at room temperature, and secondary antibody (Cy3-conjugated anti-rabbit secondary antibody) was then added (1:400, Jackson ImmunoResearch, West Grove, PA, USA); this was followed by Cy2-conjugated anti-mouse secondary antibody (1:400, Jackson ImmunoResearch) and counterstaining with DAPI. The doubly stained sections were examined under an Axiophot microscope (Carl Zeiss Meditech AG, Jena, Germany).
Western blot analysis
The lumbar enlargement (L4–L6) regions of the spinal cord from mice were dissected and homogenized in lysis buffer. The lysates of the spinal cord (20 μg) were separated by 12% or 15% sodium dodecyl sulfate-polyacrylamide gel electrophoresis (SDS-PAGE) and transferred to nitrocellulose membranes. The blots were probed with the following primary antibodies: primary antibody for rabbit anti-PINK1 (#genta-NBP1-39667 1:200), anti-Fis1 (1:500, #sc98900, Santa Cruz Biotechnology Inc., Dallas, TX, USA), anti-Parkin (1:100, #ab77924, Abcam, Cambridge, UK), anti-COX IV (1:50, #11967s, Cell Signaling Technologies), anti-Cyto C (1:200, #4280s, Cell Signaling Technologies), LC3 (1:1000; #4108s, Cell Signaling Technologies), p62 (1:1000; #P0067, Sigma-Aldrich Co.), VDAC (1:1000; #4866s, Cell Signaling Technologies), and β-actin (1:500; #2965, Cell Signaling Technologies). The immune complexes were identified using an enhanced chemiluminescence (ECL) detection system (Habersham, Little Chalfont, UK).
The isolation of mitochondria
The lumbar region (L4–L6) of the spinal cord was washed with PBS and suspended in mitochondrial fraction buffer (210 mM D-mannitol, 70 mM sucrose, 1 mM EDTA and 5 mM Hepes) for 15 min on ice and then homogenized via tissue grinder. The lysates of the spinal cord were pelleted by centrifugation at 700 g for 5 min at 4°C. The supernatant was centrifuged at equal condition again. The liquid was centrifuged at 15,000 g for 10 min at 4°C and was transferred to a new tube to be considered as a cytosolic fraction. The pellet was added to 300 μL of mitochondrial fraction buffer and used as an isolated mitochondrial fraction. The mitochondrial fraction was analyzed by Western blotting.
Image analysis
Tissue sections were examined via dark field microscopy (Zeiss Axioscope, Hallbergmoos, Germany) after identification of gray matter landmarks, as described earlier (Abbadie and Besson, 1994) to determine the segmental levels and define individual spinal cord laminae. For quantitative analysis of PINK1-stained cells, five sections from the enlarged spinal cord lumbar segments were randomly selected for each animal and then scanned. Individual sections were digitized at 4,096 by using an Axioscope A1 (Carl Zeiss Meditech AG) connected to a computer-assisted image analysis system (Image J, NIH, Bethesda, MD, USA). To ensure that the image thresholds were maintained at a constant level and to compensate for subtle variations in immunostaining, we counted only neurons that were at least 85% darker than the average gray level of each image after background subtraction and application of shading correction. The microscope illumination and data acquisition settings did not vary throughout the entire period of analysis. We calculated the average numbers of PINK1-stained cells per section from each animal, and averaged these numbers from at least five rats per group, to obtain group data. PINK1-positive cells were counted in various regions of the superficial dorsal horn and in laminae I and II. We identified these regions using the cytoarchitectonic criteria of Abbadie and Besson, 1994. All data are expressed as the number of PINK1-positive cells per unit area. All analyses were performed in a blinded manner.
Statistical analysis
All the data are presented as the mean ± standard error of the mean. Quantitative analysis of immunostaining was performed using ImageJ as previously.19 Statistical analyses were performed using the statistical software Prism 6.0 program (Graph Pad Software, San Diego, CA, USA), and repeated measurements from behavioral studies were analyzed by two-way analysis of variance. The results were considered significant at *P < 0.05, **P < 0.01, and ***P < 0.001.
Results
SNL-induced mechanical hypersensitivity in rats
To assess the development of mechanical hypersensitivity following SNL, we measured the mechanical threshold which gradually developed from POD1-3 and was fully established after POD7 compared to baseline; the differences were maintained for up to 14 days (Figure 1A). Sham surgery did not trigger either ipsilateral mechanical hypersensitivity. At postoperative POD3, we examined the CNS microglia by immunostaining for Iba1 (Figure 1B) to support whether these animal models could successfully be used in this study. SNL markedly increased the number of microglia in the ipsilateral dorsal horn at POD3 (Figure 1B). Together, these results indicate that our SNL induced neuropathic pain model is appropriate for the present study.
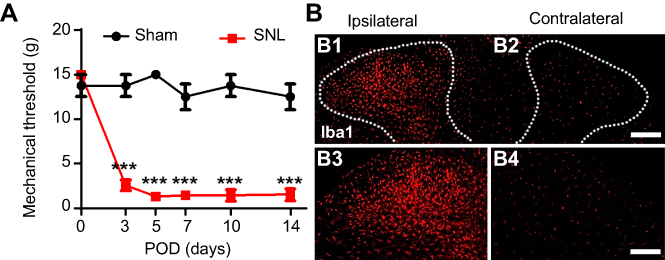 | Figure 1 L5 spinal nerve ligation-induced neuropathic pain model. (A) The paw mechanical threshold (g) was measured on day 0 (baseline) and on days 3, 7, 10, and 14 after surgery. SNL-induced mechanical hypersensitivity was assessed using the von Frey test. Two-way analysis of variance (ANOVA); all the data are shown as mean ± standard error of the mean (SEM), where ***P<0.001, n=8 compared with the sham group. (B) The expression of microglia in the spinal dorsal horn was measured by immunochemical staining with Iba1 antibody. The numbers of microglia were significantly higher in ipsilateral (B1, B3). Scale bar =25 μm in B1 and B2. Scale bar =50 μm in B3 and B4. |
PINK1 expression increased in the ipsilateral spinal dorsal horn following SNL
We performed an immunohistochemical assessment of PINK1 expression levels in the spinal dorsal horn at POD14 after L5 SNL; PINK1 expression was upregulated in the ipsilateral spinal cord (Figure 2A), especially in the superficial lumbar dorsal horn (Figure 2A and C) compared with the contralateral spinal L4-L5 dorsal horn (Figure 2A). PINK1 expression was significantly different in the spinal dorsal horn between the contralateral and ipsilateral side by postoperative day 14 (Figure 2B). PINK1 IR cells were counted in both the ipsilateral and contralateral sides of the spinal segments. A significant increase in the number of PINK1-positive cells was found in the ipsilateral (compared to the contralateral) spinal dorsal horn after SNL induction (Figure 2C). Therefore, these results suggest that SNL triggered mitophagy, contributing to spinal cell damage and death.
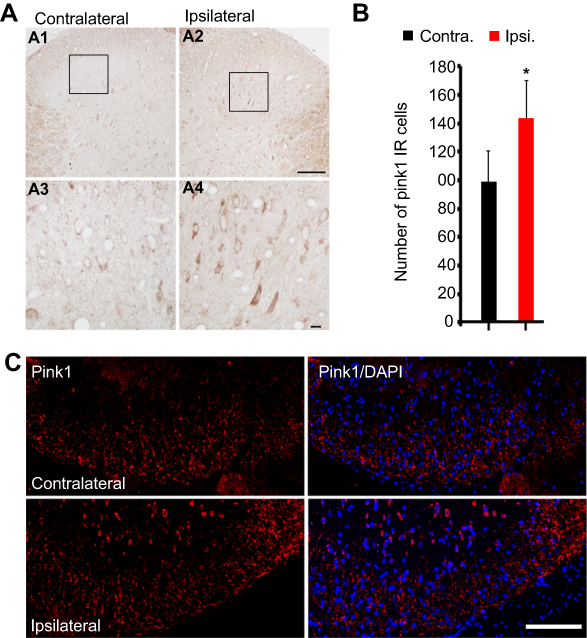 | Figure 2 SNL induced PINK1 upregulation in the spinal dorsal horn after spinal nerve ligation (SNL) POD 14. (A) The expression of PINK1 in the spinal dorsal horn was measured by immunohistochemistry (IHC) with PINK1 antibody in the SNL group performed 14 days after surgery. L5 SNL induced PINK1 upregulation in the ipsilateral superficial laminae of the dorsal horn (A2, A4) relative to that in the contralateral horn of the lumbar spinal cord (A1, A3). (B) The mean numbers of PINK1-immunoreactive (IR) cells in the ipsilateral superficial laminae of the sham-operated group (*P<0.05). Means ± SEMs, n=6. (C) Immunofluorescence staining for PINK1 in the ipsilateral and contralateral superficial dorsal horns. Scale bars: 50 μm in C, A1, and A2. Scale bar =20 μm in A3 and A4. |
After SNL, PINK1 was expressed by most neurons of the spinal dorsal horn
To identify cell type specificity expressing PINK1, we performed double immunostaining using antibodies against PINK1, and either the neuronal marker NeuN or the astrocytic marker GFAP against PINK1. PINK1-positive cells colocalized principally with NeuN-stained cells of the superficial dorsal horn of L4–L5 cord segment (Figure 3A). PINK1 protein expression was confirmed by immunoblotting. Double bands on Western blots corresponding to PINK1 were detected in the spinal cord of both Sham and SNL-induced mice. PINK1 expression was increased in spinal cord POD14 after SNL (Figure 3B and C). GFAP-stained cells did not express PINK1 (Figure S1). Thus, these data suggest that PINK1 was expressed by most neuronal cells and mitophagy causes damage to spinal neuronal cells.
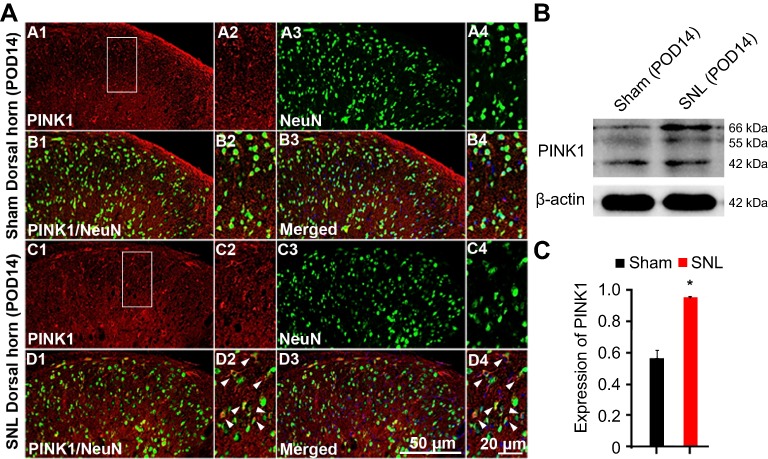 | Figure 3 PINK1 is expressed in neurons of the ipsilateral spinal dorsal horn after spinal nerve ligation (SNL) POD 14. (A) PINK1-immunoreactive (IR) cells usually co-stained with NeuN. Compared with the sham dorsal horn (A1-4, B1-4), an increase was shown in the ipsilateral side (arrows) (C1-4, D1-4). A-D2 and A-D4 are rectangular magnifications. Scale bars =50 μm in A-D1 and A-D3. Scale bar =20 μm in A-D2 and A-D4. (B) The protein levels of PINK1 were detected with immunoblotting. (C) Levels of β-actin were used as the loading control Western blot analysis revealed that the levels of PINK1 showed a significant change in SNL mice. *P<0.05. The bars indicate mean ± SEM. |
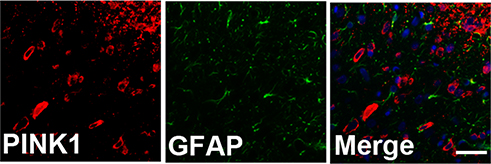 | Figure S1 PINK1 was not expressed in GFAP positive cells of the spinal dorsal horn after spinal nerve ligation (SNL) POD 14. PINK1-immunoreactive (IR) cells did not co-stain with GFAP. |
Following SNL, PINK1 expression was upregulated in COX IV- and LC3II-positive cells of the spinal dorsal horn
Next, we asked whether PINK1 is responsible for mitochondrial autophagy in the maintaining of neuropathic hypersensitivity. To explore mitochondrial autophagy, we performed double-immunofluorescence staining for PINK1, the autophagy-associated protein LC3II and BECN1, and the mitochondrial marker COX IV. PINK1 co-localized with COX IV and LC3II (Figure 4A) as well as BECN1 (Figure S2). These results suggest that spinal nerve injury triggered mitophagy in the spinal L4-L5 dorsal horn. In addition, COX IV and LC3 II protein expression was increased in spinal cord POD14 after SNL (Figure 4B and C). Taken together these data suggest that PINK1 positive cells participate in the development of pain following mitochondrial autophagy.
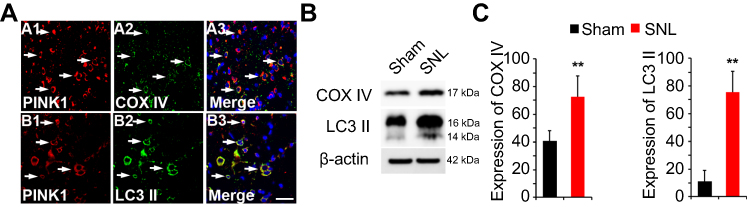 | Figure 4 Expression of autophagic marker microtubule-associated protein 1 light chain 3 (LC3) and mitochondria marker mitochondrial cytochrome c oxidase subunit IV (COX IV) in PINK1 immunoreactive (IR) cells following SNL POD14. (A) PINK1-immunoreactive (IR) cells usually co-stained with COX IV (arrows) (A1-3) or LC3 II (arrows) (B1-3) increase was shown in the ipsilateral side of SNL mice. Scale bars =50 μm in A-D1 and A-D3. Scale bar =20 μm in A1-3, B1-3 (B) The protein levels of COX IV and LC3 II were detected with immunoblotting. (C) Levels of β-actin were used as the loading control Western blot analysis revealed that the levels of COX IV and LC3 II showed a significant change in SNL mice. **P<0.01. The bars indicate mean ± SEM. |
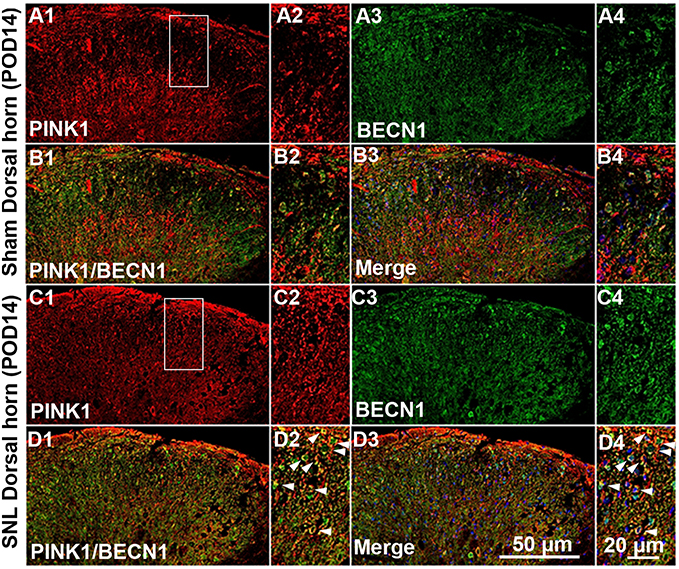 | Figure S2 Double immunofluorescence staining for PINK1 and autophagy marker BECN1 in cells of the ipsilateral spinal dorsal horn after spinal nerve ligation (SNL) POD 14. PINK1-immunoreactive (IR) cells usually co-stained with BECN. Compared with the sham dorsal horn (A1-4, B1-4), an increase was shown in the ipsilateral side (arrows) (C1-4, D1-4). A-D2 and A-D4 are rectangular magnifications. Scale bars =50 μm in A-D1 and A-D3. Scale bar =20 μm in A-D2 and A-D4. |
Autophagosome in the mitochondria of dorsal horn neurons increased following SNL
Eukaryotic cell death and apoptosis are associated with autophagy.20 To confirm whether mitochondrial autophagy occurred in neuronal cells, we performed double-immunofluorescence staining for cytochrome C (Cyto C) because it is well known that mitochondria have a central role in cell death through release of Cyto C and activation of caspases.21 In particular, cell death is preceded by an increase in Cyto C and subunit IV of Cyto C oxidase (COX IV) levels in mitochondria.21 Cyto C co-localized with NeuN positive cells (Figure 5A) and GFAP positive cells did not express Cyto C (Figure S3). We observed Cyto C protein expression by Western blotting using mitochondrial fractions from spinal L4-L5 dorsal horn tissue (Figure 5C and D). Cyto C protein expression was increased in mitochondria of the spinal cord POD14 after SNL (Figure 5C and D). Dying cells usually display large-scale accumulation of autophagosomes and adopt a morphology called autophagic cell death.22 Accordingly, to explore whether there is a structural change in mitochondria we used electron microscopy to observe ultrastructural mitochondrial changes of POD14 after SNL. The neurons of sham-operated spinal cords appeared normal, with relatively healthy mitochondria and nuclei (Figure 5B) and no appreciable pathological changes (arrows). However, several autophagosomes were evident in mitochondria of the SNL spinal L4–L5 dorsal horns, as were a few protein aggregates (arrowheads) (Figure 5B). Next, in order to demonstrate that increased PINK1 expression is due to increased mitophagy, we examined the subcellular expression status of PNK1. After mitochondrial and cytosolic fractions were isolated, we examined the mitochondrial dynamics, fis1, which are a marker of mitochondrial fission. The Fis1 expression was increased in the spinal cord POD14 after SNL (Figure 5E). In addition, we found Parkin and PINK1 were increased in the mitochondrial fraction of spinal cord POD14 (Figure 5F). All together results suggest that mitophagy damaged mitochondria of the ipsilateral spinal dorsal horns after SNL.
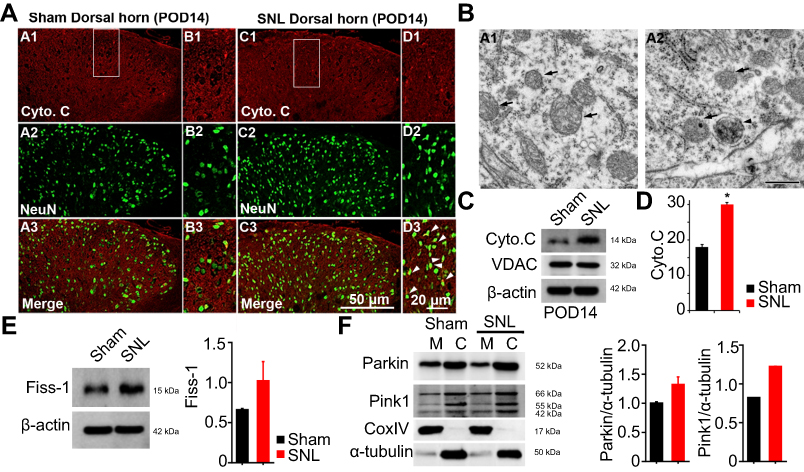 | Figure 5 Expression of mitochondrial autophagy marker cytochrome C (Cyto C) and autophagosomy in neurons of the lumbar dorsal horn POD 14. (A) Cyto C-immunoreactive (IR) cells usually co-stained with NeuN; a significant increase was shown in the ipsilateral side of SNL mice (A1-3 and B1-3) compared with the ipsilateral side of sham mice (C1-3 and D1-3). B1-3 and D1-3 is rectangular magnification. Scale bars=50 μm in A1-3 and C1-3. Scale bar=20 μm in B1-3 and D1-3. (B) Electron microscopy of neurons of the dorsal spinal cord revealed mitochondrial autophagosomy in adjacent cells (arrowheads in A2), compared to the absence of autophagosomy in healthy mitochondria of the ipsilateral spinal dorsal cells in the sham-operated control (arrows in A1). Scale bar: 500 nm. (C) The protein levels of Cyto C were detected with immunoblotting. (D) Levels of β-actin were used as the loading control and VDAC is positive control for successful mitochondria fraction. (E) The protein levels of Fiss-1 were detected with immunoblotting after mitochondria fraction. The level of β-actin was used as the loading control. (F) The protein levels of Parkin, Pink1, and CoxIV were detected with immunoblotting after mitochondria fraction. The level of α-tubulin was used as the loading control. Western blot analysis revealed that the levels of Cyto C showed a significant change in SNL mice. The bars indicate mean ± SEM, where *P<0.05, n=8 compared with the sham group. |
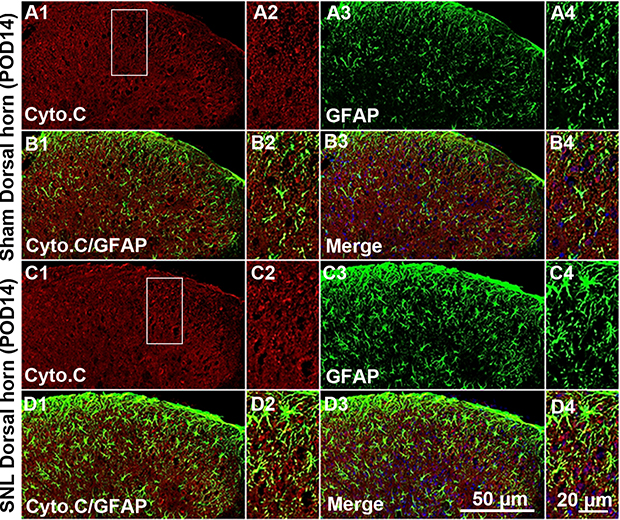 | Figure S3 Double immunofluorescence staining for Cyto C and GFAP in cells of the ipsilateral spinal dorsal horn after spinal nerve ligation (SNL) POD 14. Cyto C-immunoreactive (IR) cells did not co-stain with GFAP. Compared with the sham dorsal horn (A1-4, B1-4), there was no change in the ipsilateral side (arrows) (C1-4, D1-4). A-D2 and A-D4 are rectangular magnifications. Scale bars =50 μm in A-D1 and A-D3. Scale bar =20 μm in A-D2 and A-D4. |
After SNL, PINK1 expression was upregulated in GABAergic interneurons of the spinal dorsal horn
Although neuronal cell death is caused by mitophagy of the ipsilateral spinal dorsal horn after SNL (Figure 4), there is a considerable pain consequence. On the other hand, if the stimulation mode is processing excessively in the spinal cord, it will be good evidence that inhibitory postsynaptic neurons are diminished after SNL. In particular, the GABAergic inhibitory interneurons of spinal laminae I–III play pivotal roles in countering nociceptive activation of pain-signaling neurons.23 Therefore, we explored whether the GABAergic cells were PINK1 positive. Double immunohistochemical staining confirmed that after SNL, PINK1 co-localized with calretinin, a marker of the lumbar subpopulation of GABAergic interneurons (Figure 6A and B). We counted PINK1- and calretinin-positive cells and calculated the mean ratios in the ipsilateral and contralateral spinal dorsal horns 14 days after SNL. Over 50% of calretinin-positive GABAergic interneurons of the ipsilateral spinal dorsal horn expressed PINK1, compared to about 20% of their contralateral counterparts (Figure 6A and B). Accordingly, these results indicate that, after SNL, the level of the mitophagy was increased in GABAergic interneurons of the spinal L4–L5 dorsal horn.
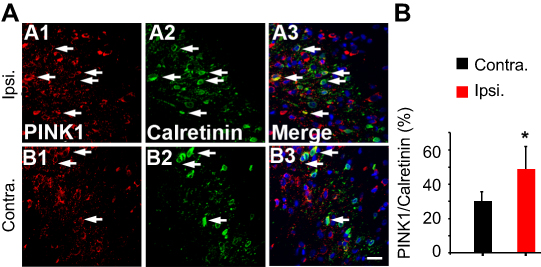 | Figure 6 Double immunofluorescence staining for PINK1 and calretinin positivity in cells of the ipsilateral spinal dorsal horn after spinal nerve ligation (SNL) POD 14. (A) PINK1-immunoreactive (IR) cells usually co-stained with GABAergic marker Calretinin; a significant increase was shown in the ipsilateral side of SNL mice (A1-3) compared with the ipsilateral side of sham mice (B1-3). Scale bars =20 μm. (B) The mean numbers of PINK1-immunoreactive (IR) cells in GABAergic neuron in the ipsilateral superficial laminae of the sham-operated group. The bars indicate mean ± SEM, where *P<0.05, n=6 compared with the sham group. |
P62 levels in the spinal dorsal horn neurons following SNL
We suggested that mitophagic dysfunction damages GABAergic interneurons following SNL. p62/SQSTM1 is a well-known autophagy substrate;24 p62 binds directly to LC3 in autophagosomes, is degraded in functional autolysosomes,25,26 and is involved in the autophagy-dependent elimination of many different cargos including ubiquitinated protein aggregates and bacteria.27 Therefore, we evaluated p62 expression by immunostaining and Western blot analysis. In the spinal cord dorsal horn following SNL, p62 was upregulated significantly (Figure 7A and B), and also we confirmed that p62 was expressed in neuronal cells with the help of double immunofluorescence staining (Figure 7C). In particular, p62 was expressed in GABAergic interneuron (Figure 8), but not astrocytes in the spinal dorsal horn (Figure S4). Accordingly, these results indicate that after SNL, the autophagic flux was increased in GABAergic interneurons of the spinal L4-L5 dorsal horn.
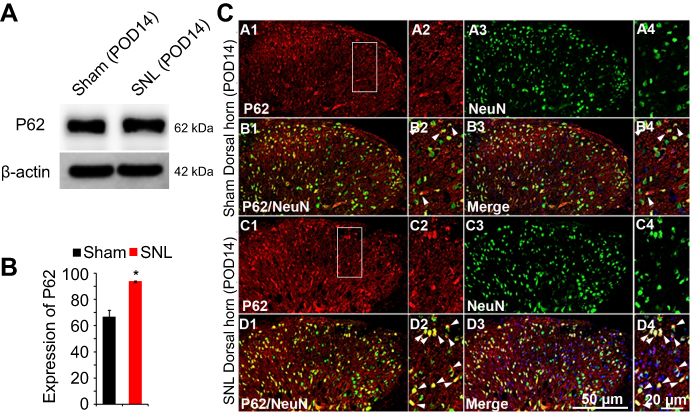 | Figure 7 The activation of p62 in neurons of the spinal dorsal horn after spinal nerve ligation (SNL) POD 14. (A) The protein levels of p62 were detected with immunoblotting. (B) Levels of β-actin were used as the loading control. Western blot analysis revealed that the levels of Cyto C showed a significant change in SNL mice. The bars indicate mean ± SEM, where *P<0.05, n=6 compared with the sham group. (C) p62-immunoreactive (IR) cells usually co-stained with NeuN. Compared with the sham dorsal horn (A1-4, B1-4), an increase was shown in the ipsilateral side (arrows) (C1-4, D1-4). A-D2 and A-D4 are rectangular magnifications. Scale bars =50 μm in A-D1 and A-D3. Scale bar =20 μm in A-D2 and A-D4. |
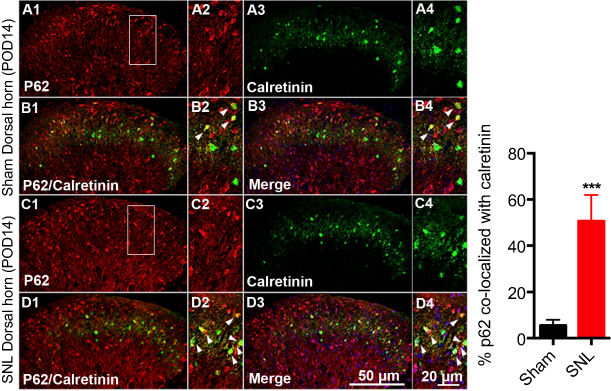 | Figure 8 Double immunofluorescence staining for p62 and calretinin positivity in cells of the ipsilateral spinal dorsal horn after spinal nerve ligation (SNL) POD 14. (A) p62-immunoreactive (IR) cells usually co-stained with calretinin. Compared with the sham dorsal horn (A1-4, B1-4), an increase was shown in the ipsilateral side (arrow) (C1-4, D1-4). A-D2 and A-D4 are rectangular magnifications. ***P<0.001. Scale bars =50 μm in A-D1 and A-D3. Scale bar =20 μm in A-D2 and A-D4. |
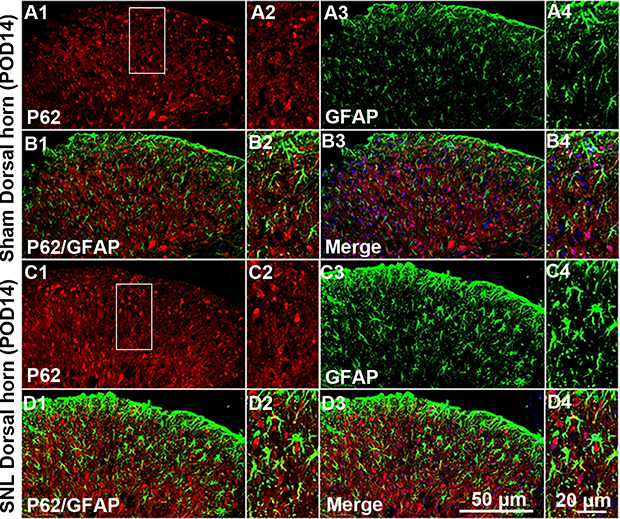 | Figure S4 Double immunofluorescence staining for p62 and GFAP in cells of the ipsilateral spinal dorsal horn after spinal nerve ligation (SNL) POD 14. P62-immunoreactive (IR) cells did not co-stain with GFAP. Compared with the sham dorsal horn (A1-4, B1-4), there was no change in the ipsilateral side (arrows) (C1-4, D1-4). A-D2 and A-D4 are rectangular magnifications. Scale bars =50 μm in A-D1 and A-D3. Scale bar =20 μm in A-D2 and A-D4. |
SNT-induced neuropathic pain did not alter hypersensitivity in PINK1 knockout mice
These results demonstrated the pivotal function of PINK1 in SNL-induced neuropathic pain. To explore the role of PINK1 in the development of neuropathic pain, we next examined pain behaviors in PINK1 knockout mice. Accordingly, we found that SNT-induced mechanical allodynia caused a significant increase in PWF on the ipsilateral side from POD1 and this was maintained for up to POD14 in the PINK1 heterozygous group. A mechanical threshold on the ipsilateral side was also found in the PINK1 knockout group but was not significantly developed compared with the PINK1 heterozygous group 1 day after surgery (Figure 9).
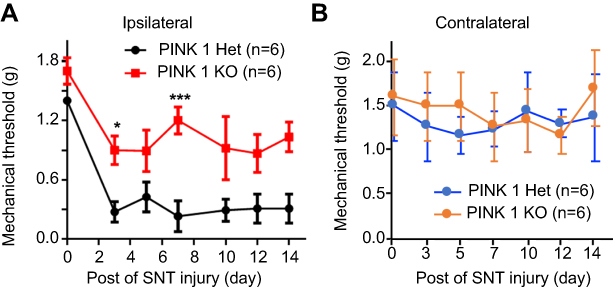 | Figure 9 Depletion of PINK1 did not alter hypersensitivity following SNT-induced neuropathic pain. (A and B) The paw mechanical thresholds (g) were measured in ipsilateral (A) and contralateral (B) side of hindpaw at days 0 (baseline), 3, 5, 7, 10, and 14 after surgery. Two-way analysis of variance (ANOVA); all the data are shown as mean ± standard error of the mean (SEM), where *P<0.05, ***P<0.001, and n=6 compared with the ipsilateral side of PINK1 heterozygous after SNT. |
Discussion
The available treatments for chronic neuropathic pain typically show limited efficacy in a majority of patients.28 Therefore, detailed studies of chronic pain pathogenesis are required to recognize novel therapeutic targets and develop a better treatment for neuropathic pain. This study is the first to explore mitophagy in the effect of nerve injury (SNL) on the spinal cord. Moreover, our understanding of the role of PINK1 mediated mitophagy following SNL is expected to contribute to the target protein for the treatment of neuropathic pain.
PINK1 levels were significantly increased in the L4–5 spinal cord segments ipsilateral to the injury in rats following SNL (Figure 2). In addition, no prior report has evaluated mitophagy in the neurons and astrocytes of the spinal dorsal horn following SNL-mediated induction of neuropathic pain. In our results, no such changes were noted in the sham-operated group. After SNL, PINK-1 was expressed by most neurons of the spinal dorsal horn (Figure 3), whereas GFAP-stained cells did not express PINK1 (Figure S1). In this study, we first discovered that PINK1 positive cells participate in development of pain following mitochondrial autophagy (Figure 4). These results provide direct evidence showing that mitophagy does damage to the most spinal neuronal cells. In particular, mitophagy is important in terms of neuronal survival and health; in the progression of several neurodegenerative diseases, including Parkinson disease, Alzheimer’s disease (AD), and aging,29 mitophagic compromise has been implicated. The maintenance of a healthy mitochondrial pool is essential for neuronal health.30 Many mitochondrial quality-control pathways are known; these include degradation of misfolded mitochondrial proteins, mitochondrial fission and fusion, and engulfment and degradation of damaged mitochondria (mitophagy).30 Dysfunctional mitochondria produce reactive oxygen species (ROS) that in turn promote inflammation and shift the mitochondrial dynamic toward fission.31 Mitochondrial dysfunction has been linked to cancer, neurodegeneration, microbial infection, and aging.30,32,33 Mitochondrial dysfunction promotes Aβ protein synthesis in AD patients. Mitochondrial function is impaired prior to the accumulation of Aβ deposits in the brains of AD mouse models.34 Experimental compromise of mitochondrial functioning (via toxin administration or deletion of a gene encoding a mitochondrial protein suppressing ROS production) accelerates Aβ-associated pathology.35,36 Induction of mitochondrial dysfunction in cultured neurons promotes amyloid production mediated by oxidative stress.37 It is well known that mitochondria plays a role in cell maintenance and survival, including calcium signaling and storage, metabolite synthesis, and apoptosis,38 Inhibition of mitophagy-induced neuronal death is expected to serve as an effective novel treatment for neuropathic pain.
The biogenesis of functional mitochondria and the elimination of dysfunctional mitochondria must be both tightly regulated and efficient. Autophagic mitochondrial removal is called mitophagy and features the formation of double-membrane vesicles (autophagosomes) that engulf mitochondria marked for degradation and then delivery of such mitochondria to lysosomes.38 Although mitochondrial autophagosome formation was found to be enhanced in earlier studies, cellular damage caused by mitophagy after peripheral nerve injury remains controversial. In addition, it is unclear whether the accumulation of mitophagic markers is indicative of cell death or enhanced survival. So, in our current study, we explored whether mitophagy protected against or triggered cell death after damage.
Mitochondria continuously undergo fusion and fission events and form a dynamic network throughout the cell. Depolarized/damaged mitochondria undergo fission from the mitochondria network and rapidly ubiquitinated in a PINK1- and Parkin-dependent manner (Gegg and Schapira, Autophagy 2011). In this study, we found Fis1, Pink1, and Parkin were increased in the cytosolic fraction of spinal cord POD14 after SNL. These data suggested that autophagy is induced for the ubiquitination of mitochondrial proteins following Parkin translocation to mitochondria POD14 after SNL. However, since p62 levels increased when autophagy is impaired,39 the increased p62 levels in neuronal cell of the dorsal horn after SNL implies direct autophagic flux impairment (Figure 7). p62 is involved in autophagy-dependent elimination of many different cargos including ubiquitinated protein aggregates and bacteria. Because of its interaction with LC3, p62 is constantly degraded via autophagy. In other words, autophagy inhibition leads to the accumulation of p62 positive aggregates (Komatsu, M. & Ichimura, Y. Physiological significance of selective degradation of p62 by autophagy. FEBS Lett). Therefore, the accumulation of p62 observed after SNL suggests that PINK1/Parkin-dependent mitophagic flux impaired. Moreover, recent studies have revealed the significance of ER-mitochondrial crosstalk in pathophysiological situations.40 In addition, ER stress is involved in the induction and maintenance of neuropathic pain.19
In our results, although neuronal cell death is caused by mitophagy of the ipsilateral spinal dorsal horn after SNL (Figure 4) there is considerable development of neuropathic pain. These results are good evidence that inhibitory postsynaptic neurons are diminished after SNL. In particular, the GABAergic inhibitory interneurons of spinal laminae I–III play pivotal roles in countering nociceptive activation of pain-signaling neurons.23 Accordingly, we found that the levels of mitophagy markers such as PINK1 were elevated after SNL in the GABAergic interneurons of the spinal dorsal horn. Marsh et al found that cell death, and a subsequent decrease in GABAergic interneuron numbers in the superficial dorsal horn, played significant roles in the reduction in GABAergic tone and the increase in neuropathic pain evident after spinal cord injury (SCI).23 The gal1:GFP GABAergic interneuronal status in the dorsal horns of animals was studied to determine whether SCI reduced the numbers of cells expressing the transgenic marker. SCI significantly reduced the numbers of such cells; moreover, the nuclear level of active caspase-3 increased. However, the numbers of GABAergic interneurons did not change. Accordingly, we assessed the p62 level by monitoring the GABAergic interneurons of the dorsal horn after SNL (Figure 8). We found that the p62 level was increased after SNL. Therefore, GABAergic interneurons in the spinal dorsal horn are impaired in terms of autophagic mitochondrial flux, triggering cell death after SNL. Together, these results suggest that accumulation of mitophagic markers is involved in both the induction and maintenance of neuropathic pain caused by cell death. In addition, as one of the best ways for observation of involvement in neuropathic pain development of PINK1, we used PINK knockout mice following conventional depletion of PINK. We found the development of PWF on the ipsilateral side in the PINK1 knockout group was significantly decreased compared with the PINK1 heterozygous group in the days following SNT (Figure 9).
The conclusion of the present study is that PINK1 participates in the development of pain following mitochondrial autophagy. In addition, we found that levels of mitophagy markers such as PINK1 were elevated after SNL in the GABAergic interneurons of the spinal dorsal horn. Consequently, this study improves our understanding of PINK1 mitophagy-induced neuropathic pain and provides the scientific basis for the use of PINK1 and mitophagy as potential therapeutic targets in the clinical management of neuropathic pain.
Abbreviation list
PINK1, PTEN-induced putative kinase 1; SNL, spinal nerve ligation; GFAP, glial fibrillary acidic protein; NeuN, neuronal nuclei.
Acknowledgments
We thank all members of the Kim Lab for critical discussions of the manuscript and especially Dr Sang Ryong Kim for help with discussion of mitophagy function. This research was supported by the Brain Research Program through the National Research Foundation of Korea (NRF) funded by the Ministry of Science, ICT & Future Planning (NRF-2016M3C7A1905074), and by the Korea government (MSIP)(2016R1A2B4009409).
Author contributions
M-HY, EZ and DWK designed the study and wrote the manuscript. JS and M-HY performed the experiments of pain behavior, immunoblotting, immunostaining, and the data analysis. JS, M-HY and EZ performed the preparation of drafted manuscript. M-HY, JS and NS performed PCR and data analysis. All authors contributed to data analysis, drafting and revising the article, gave final approval of the version to be published, and agree to be accountable for all aspects of the work.
Disclosure
The authors report no conflicts of interest in this work.
References
1. Basbaum AI, Bautista DM, Scherrer G, Julius D. Cellular and molecular mechanisms of pain. Cell. 2009;139(2):267–284. doi:10.1016/j.cell.2009.09.028
2. Yorimitsu T, Klionsky DJ. Autophagy: molecular machinery for self-eating. Cell Death Differ. 2005;12 Suppl 2:1542–1552. doi:10.1038/sj.cdd.4401765
3. Rubinsztein DC, Gestwicki JE, Murphy LO, Klionsky DJ. Potential therapeutic applications of autophagy. Nat Rev Drug Discovery. 2007;6(4):304–312. doi:10.1038/nrd2272
4. Raudino F. Non-cognitive symptoms and related conditions in the Alzheimer‘s disease: a literature review. Neurol Sci. 2013;34(8):1275–1282. doi:10.1007/s10072-013-1424-7
5. Berliocchi L, Maiaru M, Varano GP, et al. Spinal autophagy is differently modulated in distinct mouse models of neuropathic pain. Mol Pain. 2015;11:3. doi:10.1186/1744-8069-11-3
6. Zhang E, Yi MH, Ko Y, et al. Expression of LC3 and Beclin 1 in the spinal dorsal horn following spinal nerve ligation-induced neuropathic pain. Brain Res. 2013;1519:31–39. doi:10.1016/j.brainres.2013.04.055
7. Gwak YS, Crown ED, Unabia GC, Hulsebosch CE. Propentofylline attenuates allodynia, glial activation and modulates GABAergic tone after spinal cord injury in the rat. Pain. 2008;138(2):410–422. doi:10.1016/j.pain.2008.01.021
8. Janssen SP, Truin M, Van Kleef M, Joosten EA. Differential GABAergic disinhibition during the development of painful peripheral neuropathy. Neuroscience. 2011;184:183–194. doi:10.1016/j.neuroscience.2011.03.060
9. Lee J, Back SK, Lim EJ, et al. Are spinal GABAergic elements related to the manifestation of neuropathic pain in rat? Korean J Physiol Pharmacol. 2010;14(2):59–69. doi:10.4196/kjpp.2010.14.2.59
10. Malan TP, Mata HP, Porreca F. Spinal GABA(A) and GABA(B) receptor pharmacology in a rat model of neuropathic pain. Anesthesiology. 2002;96(5):1161–1167.
11. Mattson MP, Gleichmann M, Cheng A. Mitochondria in neuroplasticity and neurological disorders. Neuron. 2008;60(5):748–766. doi:10.1016/j.neuron.2008.10.010
12. Menzies FM, Fleming A, Rubinsztein DC. Compromised autophagy and neurodegenerative diseases. Nat Rev Neurosci. 2015;16(6):345–357. doi:10.1038/nrn3961
13. Michel S, Wanet A, De Pauw A, Rommelaere G, Arnould T, Renard P. Crosstalk between mitochondrial (dys)function and mitochondrial abundance. J Cell Physiol. 2012;227(6):2297–2310. doi:10.1002/jcp.23021
14. Bennett GJ, Doyle T, Salvemini D. Mitotoxicity in distal symmetrical sensory peripheral neuropathies. Nat Rev Neurol. 2014;10(6):326–336. doi:10.1038/nrneurol.2014.77
15. Flatters SJ. The contribution of mitochondria to sensory processing and pain. Prog Mol Biol Transl Sci. 2015;131:119–146. doi:10.1016/bs.pmbts.2014.12.004
16. Dagda RK, Cherra SJ
17. Choi I, Kim J, Jeong HK, et al. PINK1 deficiency attenuates astrocyte proliferation through mitochondrial dysfunction, reduced AKT and increased p38 MAPK activation, and downregulation of EGFR. Glia. 2013;61(5):800–812. doi:10.1002/glia.22475
18. Chaplan SR, Bach FW, Pogrel JW, Chung JM, Yaksh TL. Quantitative assessment of tactile allodynia in the rat paw. J Neurosci Methods. 1994;53(1):55–63.
19. Zhang E, Yi MH, Shin N, et al. Endoplasmic reticulum stress impairment in the spinal dorsal horn of a neuropathic pain model. Sci Rep. 2015;5:11555. doi:10.1038/srep11555
20. Yonekawa T, Thorburn A. Autophagy and cell death. Essays Biochem. 2013;55:105–117. doi:10.1042/bse0550105
21. Sanchez-Alcazar JA, Khodjakov A, Schneider E. Anticancer drugs induce increased mitochondrial cytochrome c expression that precedes cell death. Cancer Res. 2001;61(3):1038–1044.
22. Kroemer G, Levine B. Autophagic cell death: the story of a misnomer. Nat Rev Mol Cell Biol. 2008;9(12):1004–1010. doi:10.1038/nrm2529
23. Meisner JG, Marsh AD, Marsh DR. Loss of GABAergic interneurons in laminae I-III of the spinal cord dorsal horn contributes to reduced GABAergic tone and neuropathic pain after spinal cord injury. J Neurotrauma. 2010;27(4):729–737. doi:10.1089/neu.2009.1166
24. Mizushima N, Komatsu M. Autophagy: renovation of cells and tissues. Cell. 2011;147(4):728–741. doi:10.1016/j.cell.2011.10.026
25. Johansen T, Lamark T. Selective autophagy mediated by autophagic adapter proteins. Autophagy. 2011;7(3):279–296.
26. Bjorkoy G, Lamark T, Brech A, et al. p62/SQSTM1 forms protein aggregates degraded by autophagy and has a protective effect on huntingtin-induced cell death. J Cell Biol. 2005;171(4):603–614. doi:10.1083/jcb.200507002
27. Komatsu M, Ichimura Y. Physiological significance of selective degradation of p62 by autophagy. FEBS Lett. 2010;584(7):1374–1378. doi:10.1016/j.febslet.2010.02.017
28. Finnerup NB, Sindrup SH, Jensen TS. The evidence for pharmacological treatment of neuropathic pain. Pain. 2010;150(3):573–581. doi:10.1016/j.pain.2010.06.019
29. Fang W, Chen J, Rossi M, Feng Y, Li XZ, Michaelides A. Inverse temperature dependence of nuclear quantum effects in DNA base Pairs. J Phys Chem Lett. 2016;7(11):2125–2131. doi:10.1021/acs.jpclett.6b00777
30. Cai Q, Tammineni P. Alterations in mitochondrial quality control in Alzheimer‘s disease. Front Cell Neurosci. 2016;10:24. doi:10.3389/fncel.2016.00018
31. Wang X, Jiang W, Yan Y, et al. RNA viruses promote activation of the NLRP3 inflammasome through a RIP1-RIP3-DRP1 signaling pathway. Nat Immunol. 2014;15(12):1126–1133. doi:10.1038/ni.3015
32. Yao J, Irwin RW, Zhao L, Nilsen J, Hamilton RT, Brinton RD. Mitochondrial bioenergetic deficit precedes Alzheimer‘s pathology in female mouse model of Alzheimer‘s disease. Proc Natl Acad Sci U S A. 2009;106(34):14670–14675. doi:10.1073/pnas.0903563106
33. Leuner K, Schulz K, Schutt T, et al. Peripheral mitochondrial dysfunction in Alzheimer‘s disease: focus on lymphocytes. Mol Neurobiol. 2012;46(1):194–204. doi:10.1007/s12035-012-8300-y
34. Mao P, Manczak M, Calkins MJ, et al. Mitochondria-targeted catalase reduces abnormal APP processing, amyloid beta production and BACE1 in a mouse model of Alzheimer‘s disease: implications for neuroprotection and lifespan extension. Hum Mol Genet. 2012;21(13):2973–2990. doi:10.1093/hmg/dds128
35. Esposito L, Raber J, Kekonius L, et al. Reduction in mitochondrial superoxide dismutase modulates Alzheimer‘s disease-like pathology and accelerates the onset of behavioral changes in human amyloid precursor protein transgenic mice. J Neurosci. 2006;26(19):5167–5179. doi:10.1523/JNEUROSCI.0482-06.2006
36. Chen L, Na R, Boldt E, Ran Q. NLRP3 inflammasome activation by mitochondrial reactive oxygen species plays a key role in long-term cognitive impairment induced by paraquat exposure. Neurobiol Aging. 2015;36(9):2533–2543. doi:10.1016/j.neurobiolaging.2015.05.018
37. Gwon AR, Park JS, Arumugam TV, et al. Oxidative lipid modification of nicastrin enhances amyloidogenic gamma-secretase activity in Alzheimer‘s disease. Aging Cell. 2012;11(4):559–568. doi:10.1111/j.1474-9726.2012.00817.x
38. Kroemer G, Galluzzi L, Brenner C. Mitochondrial membrane permeabilization in cell death. Physiol Rev. 2007;87(1):99–163. doi:10.1152/physrev.00013.2006
39. Komatsu M, Waguri S, Koike M, et al. Homeostatic levels of p62 control cytoplasmic inclusion body formation in autophagy-deficient mice. Cell. 2007;131(6):1149–1163. doi:10.1016/j.cell.2007.10.035
40. Giacomello M, Pellegrini L. The coming of age of the mitochondria-ER contact: a matter of thickness. Cell Death Differ. 2016;23(9):1417–1427. doi:10.1038/cdd.2016.52
Supplementary materials
 © 2019 The Author(s). This work is published and licensed by Dove Medical Press Limited. The
full terms of this license are available at https://www.dovepress.com/terms
and incorporate the Creative Commons Attribution
- Non Commercial (unported, 3.0) License.
By accessing the work you hereby accept the Terms. Non-commercial uses of the work are permitted
without any further permission from Dove Medical Press Limited, provided the work is properly
attributed. For permission for commercial use of this work, please see paragraphs 4.2 and 5 of our Terms.
© 2019 The Author(s). This work is published and licensed by Dove Medical Press Limited. The
full terms of this license are available at https://www.dovepress.com/terms
and incorporate the Creative Commons Attribution
- Non Commercial (unported, 3.0) License.
By accessing the work you hereby accept the Terms. Non-commercial uses of the work are permitted
without any further permission from Dove Medical Press Limited, provided the work is properly
attributed. For permission for commercial use of this work, please see paragraphs 4.2 and 5 of our Terms.