Back to Journals » Journal of Asthma and Allergy » Volume 12
Pilot-Scale Study Of Human Plasma Proteomics Identifies ApoE And IL33 As Markers In Atopic Asthma
Authors Bhowmik M, Majumdar S, Dasgupta A, Gupta Bhattacharya S, Saha S ![]()
Received 8 April 2019
Accepted for publication 12 August 2019
Published 20 September 2019 Volume 2019:12 Pages 273—283
DOI https://doi.org/10.2147/JAA.S211569
Checked for plagiarism Yes
Review by Single anonymous peer review
Peer reviewer comments 3
Editor who approved publication: Dr Amrita Dosanjh
Moumita Bhowmik,1,* Sreyashi Majumdar,2,* Angira Dasgupta,3 Swati Gupta Bhattacharya,1 Sudipto Saha2
1Division of Plant Biology, Bose Institute, Kolkata, West Bengal, India; 2Division of Bioinformatics, Bose Institute, Kolkata, West Bengal, India; 3BR Singh Hospital and Centre for Medical Education and Research, Kolkata, West Bengal, India
*These authors contributed equally to this work
Correspondence: Swati Gupta Bhattacharya
Division of Plant Biology, Main Campus, Bose Institute, 93/1 APC Road, Kolkata 700009, India
Tel +91 33 2303 1129
Email [email protected]
Sudipto Saha
Division of Bioinformatics, Centenary Campus, Bose Institute, P-1/12 CIT Scheme VII-M, Kolkata 700054, India
Tel +91 33 2569 3333
Email [email protected]
Background: The pathobiology of atopic asthma is complex and the symptoms similar to other respiratory diseases. As such, identification of biomarkers of atopic asthma is of prime importance for better diagnosis and control of the disease.
Objectives: We sought to study the changes in plasma proteome and cytokine-expression profile across healthy and atopic asthmatics for identifying biomarkers and exploring aberrant pathways for atopic asthma.
Methods: A pilot-scale study in humans was performed to identify differentially expressed proteins in blood plasma of healthy controls (n=5) and treatment-naïve atopic asthma patients (n=5) using quantitative label-free liquid chromatography–tandem mass spectrometry proteomics and ELISA.
Results: Mass spectrometry–based proteomic analysis revealed ApoE to be significantly downregulated in atopic asthmatics compared to healthy volunteers. Decreased expression of ApoE in atopic asthmatics was validated by immunoblotting (50.74% decrease). Comparison with atopic asthmatics and COPD patients showed that ApoE was decreased (36.33%) in atopic asthma compared to COPD. IL33 was significantly upregulated in atopic asthmatics compared to healthy subjects (3.84-fold).
Conclusion: ApoE was downregulated and IL33 upregulated in atopic asthma patients compared to healthy volunteers. These two proteins’ profiles were distinct in atopic asthma from healthy and COPD plasma samples. Differential expression of these proteins could serve as a probable candidate for a two-protein classifier–based prognostic biomarker of atopic asthma.
Keywords: atopic asthma, LC-MS/MS, apolipoprotein E, ApoE, interleukin 33, IL33, biomarkers
Introduction
Asthma is a chronic inflammatory disease of the airways which has recently been recognized as heterogeneous in nature. Other general features of this complex disease are reversible airflow obstruction, airway hyperresponsiveness, wheezing, shortness of breath, and chest tightness.1,2 International guidelines define asthma by the presence of reversible airflow obstruction on spirometry. Asthma is considered severe when high-dose inhaled corticosteroids and other additional controllers, such as long-acting inhaled β2 agonists, montelukast, and/or theophylline or prolonged oral corticosteroid therapy, fail to control asthma symptoms or exacerbation rates.3 Apart from stratification of asthma based on severity of the disease, it can also be broadly classified as atopic and nonatopic asthma.4 Atopic or allergic asthma is generally triggered by extrinsic allergens, whereas specific external trigger factors are not usually associated with nonatopic asthma. The prevalence of atopic asthma was found to be much higher than nonatopic asthma in a population-based study.5,6 The complexity and heterogeneity of asthma has made its diagnosis and treatment difficult. Th2 and Th1 inflammatory response have both been associated with asthma pathogenesis.7 The Th1/Th2 paradigm of asthma further complicates the overall scenario.8 Besides this, the striking similarity of symptoms (such as cough, shortness of breath, airflow obstruction, and sputum production) between asthma and COPD may further mislead proper diagnosis.9–11 Therefore, asthma and COPD have emerged as major health concerns in both developed and developing countries. In such circumstances, recent asthma research has focused on discovering asthma biomarkers, pathways, and novel targets for drug discovery.
Biomarkers serve as dynamic tools for understanding pathogenesis and prognosis of a wide variety of diseases, including neurological diseases, cancers, cardiovascular diseases, and genetic, allergic, and immunological disorders.12,13 Biomarkers are measurable characteristics that act as indicators of biological and pathogenic processes and response to therapeutics.14 In closely related diseases like leiomyosarcoma and gastrointestinal stromal tumour, diagnostic biomarkers based on relative expression of two genes often yield better accuracy as biomarkers than expression profile of a single gene.15 Different omics approaches, including liquid chromatography–tandem mass spectrometry (LC-MS/MS)-based proteomics, are widely employed for identification of biomarkers.16 The Database of Allergy and Asthma Biomarkers, a manually curated repository, enlists differentially expressed genes/proteins in different allergic diseases like asthma and allergic rhinitis.17 These molecules can serve as potential candidates for allergy and asthma biomarkers.
The present study focuses on quantitative LC-MS/MS-based proteomic study of human plasma samples from healthy volunteers and adult atopic asthma patients from the Indian subcontinent to identify biomarkers. Cytokine profiling for IL33, the alarmin cytokine, and other Th2 cytokines like IL4, IL5 and IL13 was performed to assess the pattern of expression of these cytokines in atopic asthma. The outcome of high-throughput proteomic data finding of differential expression of ApoE was validated by immunoblotting. Cytokine profiling and Western blotting was also performed with plasma samples from COPD patients to study the expression patterns of our findings in symptomatically similar respiratory disease. The overall goal of this study was to identify probable biomarker candidates, explore pathways, obtain mechanistic insight, and find therapeutic targets for atopic asthma with a view to differentiate asthma from other overlapping airway diseases based on these identified biomarkers.
Methods
Sample Collection
Venous blood samples (10 mL) were collected from healthy subjects (n=5), atopic asthma patients (n=5), and COPD patients (n=5) of east Indian origin. Asthma was defined by the presence of history of such symptoms as wheeze, shortness of breath, chest tightness, and cough that varied over time and in intensity, together with the presence of reversible airflow obstruction on spirometry.18 COPD was diagnosed by the presence of cough with expectoration, breathlessness, exposure to risk factors (eg, tobacco smoke, biomass fuels, occupational dust) along with irreversible airflow obstruction on spirometry.19 Reversible airflow obstruction on spirometry was defined as the presence of airflow obstruction (FEV1/FVC <0.7) associated with an improvement in FEV1 by at least >200 mL and >12% 15–20 minutes after inhalation of 200 µg of salbutamol. Spirometry was done according to the American Thoracic Society–European Respiratory Society Task Force guidelines.20 Patient samples were obtained from the Department of Pulmonary Medicine, BR Singh Hospital, Kolkata, India with prior consent following all ethical issues. In order to work with human blood samples, Human Ethics Committee clearance (BIHEC/2014-15/4) from Bose Institute, Kolkata was also obtained. We included adult atopic asthma patients who were treatment-naïve. Total IgE levels, allergen-specific IgE profiling (for common ragweed, molds, and house dust mites) and spirometry (% predicted FEV1) for patients were conducted at BR Singh Hospital. Allergenicity of atopic asthma patients toward common pollen allergens like Helianthus annuus and Cocos nucifera were assessed by dot-blot assays. Total IgE counts and spirometry (% predicted FEV1) for healthy volunteers were evaluated at a local pathology laboratory.
Isolation Of Blood Plasma
Blood samples were collected in K2-EDTA tubes (BD vacutainers). Blood samples were centrifuged immediately after collection at 350 g for 15 minutes at 4°C for plasma separation. Plasma samples were further subjected to centrifugation at 15,000 rpm for 15 minutes at 4°C for lipid removal. On centrifugation, the lipid scum generated on top was removed by gentle pipetting. Lipid-free plasma samples were then stored at −20°C until use.
Dot-Blot Assays
Dot blot is a method widely used to detect allergenicity of samples to specific allergens. Antigen (pollen allergen, namely H. annuus and C. nucifera) extracts (1 µg) were dotted on polyvinylidene difluoride (PVDF) membranes (GE Life Sciences). Membranes were then blocked with 0.5% BSA in TBS-T buffer for 3 hours at room temperature. Patients’ sera were then added in 1:5 ratios in TBS-T buffer and membrane pieces incubated overnight at 4°C. Unbound IgE was removed by washing the membrane twice. Membranes were then incubated with secondary antibody in 1:1,000 dilution (Mouse monoclonal antihuman IgE–AP conjugate; Sigma-Aldrich) at 4°C for 3 hours. Washing was performed thrice with TBS-T. Dots were developed with nitro-blue-tetrazolium-5-bromo-4-chloro-3ʹ-indolyphosphate (Abcam). Dot-blot assays were performed for atopic asthma patients and just one healthy subject. They were not done for any other healthy subjects, since the IgE observed for healthy individuals was low and within normal range. The immunodot blot was performed by spotting 10 µL antigenic extract right at the center of the circular disks of PVDF membranes. In cases of positive IgE binding, the substrate reaction occurs in the antigenic spots and the colored spots quickly develop at the center of the membrane disks. The appearance of prominent colored spots at the center of the disks denotes sensitivity to allergens. No sensitivity to allergens is denoted by lack of spot development at the center of the disk. In turn, the entire disk turns purplish, owing to prolonged exposure to photosensitive substrate solution.
Depletion Of High-Abundance Proteins From Blood-Plasma Samples
Six high-abundance proteins (albumin, transferrin, IgG, IgA, haptoglobin, and antitrypsin) were removed from the collected human plasma samples (healthy subjects, n=5; atopic asthma patients, n=5; COPD patients, n=5) using an Agilent Multiple Affinity Removal System following the manufacturer’s protocol. A snapshot of unidimensional SDS-PAGE of depleted and undepleted plasma samples is shown in Figure S1.
Unidimensional Gel Electrophoresis And Sample Processing For LC-MS/MS Analysis
Each of the depleted plasma samples (50 µg) of healthy subjects (n=5) and atopic asthma patients (n=5) were fractionated by unidimensional 12% SDS-PAGE. The gel was stained with Coomassie brilliant blue. Pieces of equal size were excised from each lane of the gel and outsourced to C-CAMP for subsequent LC-MS/MS run.
LC-MS/MS
In-gel digestion was performed using trypsin in C-CAMP using the standard protocol.21 Trypsin-digested peptides were vacuum-dried and reconstituted with 0.1% formic acid and then vortexed for 1 hour, followed by centrifugation at 10,000 rpm for 5 minutes. The supernatant containing the digested peptide mix was then collected and separated using Agilent Nano 1200 high-performance liquid chromatography, present in C-CAMP. An Advion NanoMate Triversa (automated nano–electrospray ionization tool) was then used to generate ions for subsequent MS analysis. An LTQ Orbitrap Discovery was used for accurate determination of m/z ratios and data acquisition.
LC-MS/MS Data Analysis
Proteins were identified by the Mascot search engine after LC-MS/MS runs. The raw data files in .dat file format were uploaded to Scaffold software for protein quantification. Protein identification was accepted at a 5% false-dicovery rate and contained at least two identified peptides. Total unique peptides and total spectral count for each protein across the different healthy and patient samples were obtained. Run-to-run variation was normalized using the normalized spectral abundance factor (NSAF). The NSAF of a protein (p) was calculated:

where the spectral count (SpC) identified for protein p by the protein length (Length) is divided by the sum of SpC/Length for all proteins in the experiment to obtain the NSAF.22,23 Heat maps were constructed using Morpheus software (Broad Institute).24 Box plots were constructed using R packages for visual representation of the differential expression of target proteins across healthy and clinical samples.
Western Blot For Validation Of LC-MS/MS Results
Western blotting was performed to validate the outcome of LC-MS/MS using depleted blood-plasma samples from healthy subjects (n=5) and atopic asthma patients (n=5). Immunoblotting was also done with plasma samples from COPD patients (n=5). An equal amount of protein (150 μg) was loaded on each lane followed by separation using SDS-PAGE and then transferred onto PVDF membrane (Merck Millipore). The membrane was blocked for 1 hour at 37°C with 5% BSA solution. Then, the membrane was incubated with anti-ApoE mouse monoclonal antibody (ab1907, 1:1,000; Abcam) overnight at 4°C, followed by incubation with horseradish peroxide–conjugated antimouse secondary antibody (ab205719, 1:3,000; Abcam) for 1 hour. After washing, the membrane was developed using an electrochemiluminescentWestern blotting detection buffer and detected with Chemidoc (GE Amersham Imager 600). β-Actin (1:5000, Abcam, ab8226) was used as a loading control. Band intensity was quantified using ImageJ 1.51j8.
Cytokine Profiling
Quantification of Th2 cytokines IL4, IL5, and IL13 in healthy subject (n=5) and atopic asthmatic (n=5) plasma samples was conducted using ELISA kits (RayBio) following the manufacturer’s protocol. Cytokine profiling of IL33 was performed thrice for freshly collected healthy volunteer (n=5), atopic asthmatic (n=5) and COPD (n=5) plasma samples with ELISA using a Quantikine ELISA kit for human IL33 (P118763 for healthy and asthma patient samples and P177042 for COPD samples; R&D systems) as per the manufacturer’s protocol. For each kit, a standard curve was generated separately and concentration of IL33 measured from the OD values at 450 nm using standard curve equations. OD values at 450 nm were obtained using an ELISA plate reader (Thermo Fisher Scientific).
Ingenuity Pathway Analysis Of Proteomic Data And Cytokine Profiling
Pathway analyses were done using ingenuity pathway analysis (IPA) after merging the different apolipoproteins from LC-MS/MS data and IL33 cytokine profiling. The other proteins identified by LC-MS/MS did not show significant variation in expression patterns and hence were not included in the IPA to reduce signal:noise ratio.
Statistical Analysis
Student’s t-test was used for experiments conducted, including LC-MS/MS, Western blot, and cytokine profiling.
Results
Baseline Study-Population Characteristics
Five atopic asthma patients, five COPD patients, and five healthy volunteers of east Indian origin were studied. Table 1 presents the baseline clinical characteristics of the asthmatics, COPD patients, and healthy volunteers from whom blood samples were collected. Of the five atopic asthma patients, two were male and three female. All asthma patients were sensitive to the two pollens — H. annuus and C. nucifera — as evident in Figure 1. The asthmatics were also allergic to other common environmental allergens like molds and house dust mites (Table 1 and Table S1). All five COPD patients were male. Neither patients nor the healthy cohort had any other major health complications as per individual health record.
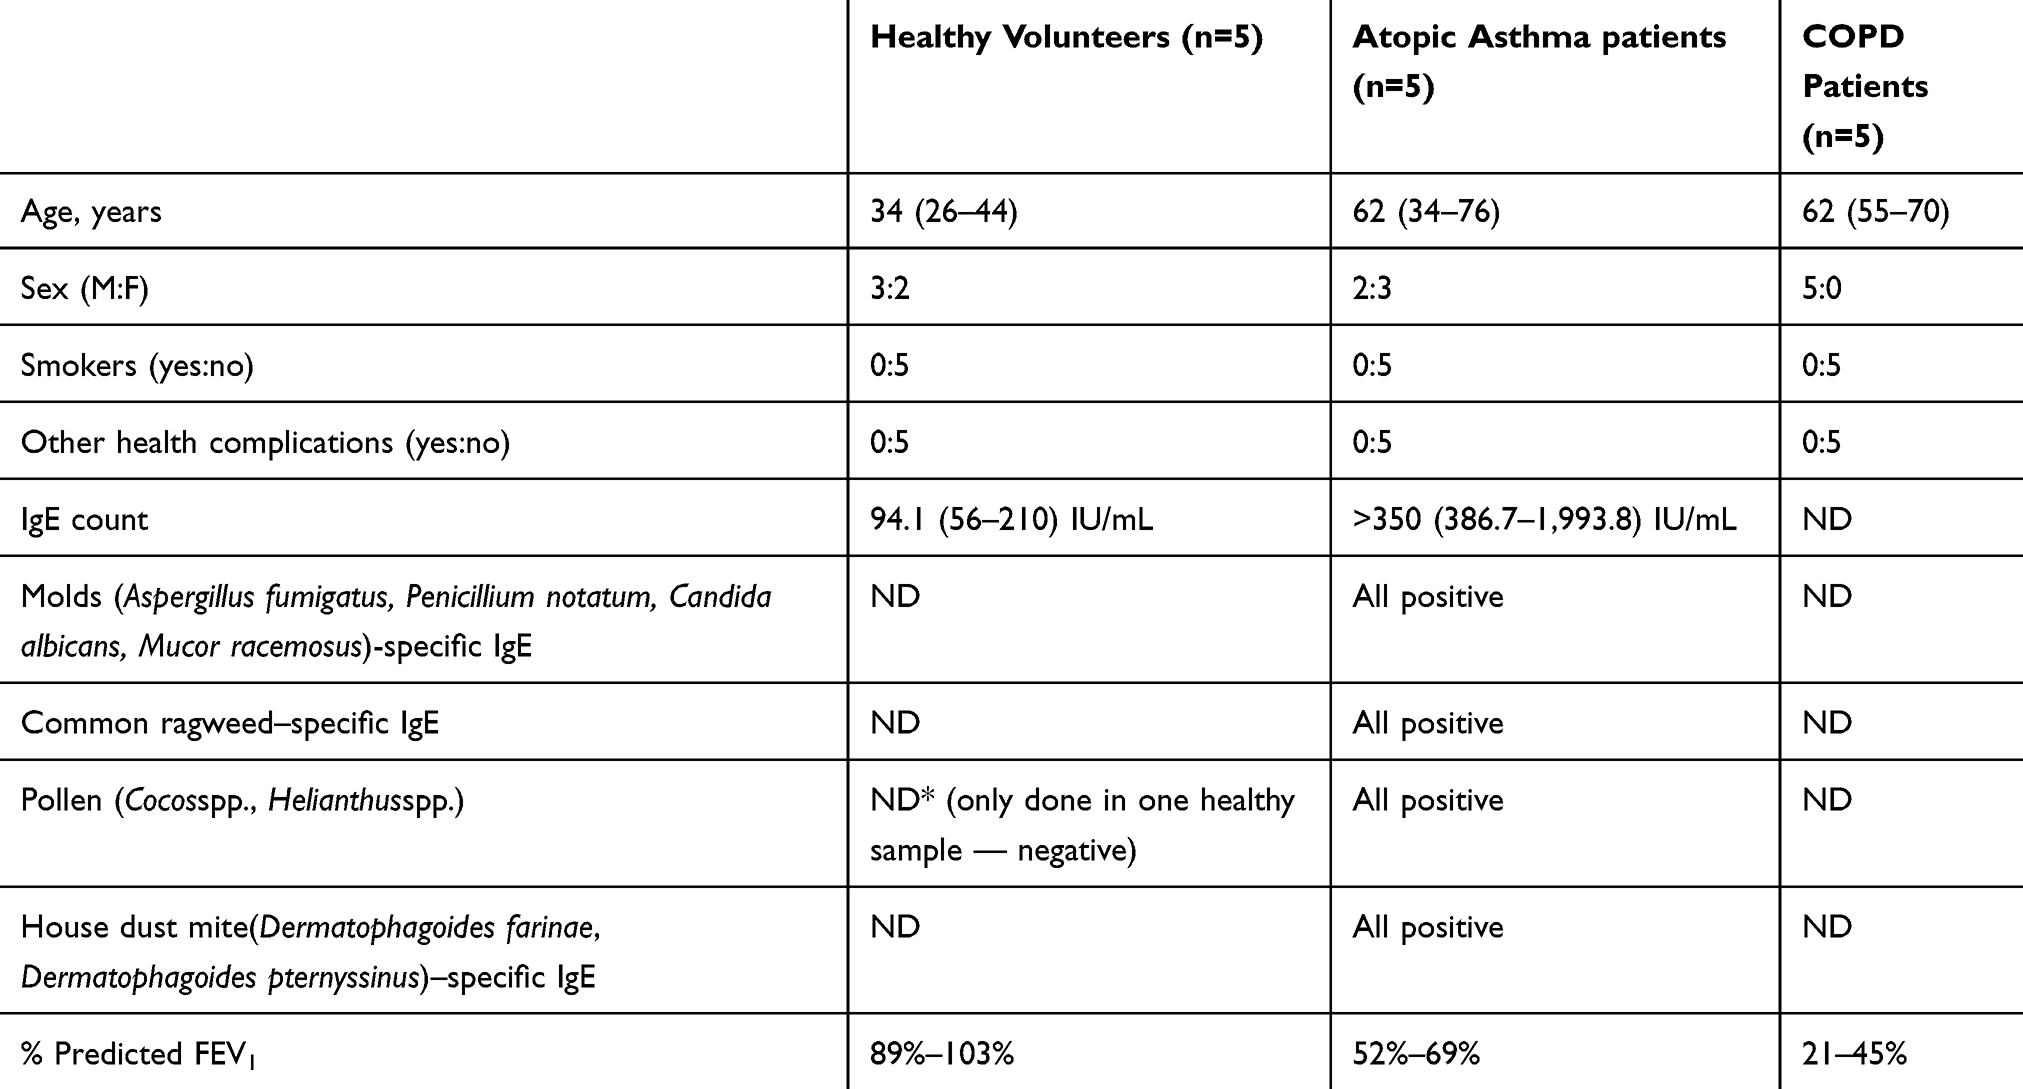 |
Table 1 Details And Clinical Characteristics Of Atopic Asthma Patients, COPD Patients, And Healthy Volunteers |
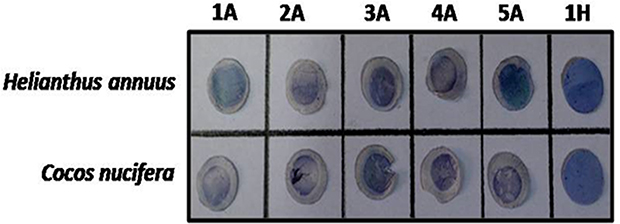 |
Figure 1 Dot blots showing sensitivity of atopic asthma patients to common pollen allergens.Notes: IgE immunoblots shows IgE reactivity of patient sera to Helianthus spp. and Cocosspp. 1A to 5A represents atopic asthma patients. 1H denotes the healthy sample. Atopic asthma samples (n=5) showed positive results (sensitivity to the allergens) and the healthy sample (n=1) showed negative results (unreactive to the allergens). |
Association Between Apolipoproteins And Atopic Asthma
Plasma levels of some apolipoproteins has been found to be altered in patient samples in comparison with healthy individuals. LC-MS/MS data obtained were analyzed by Scaffold version 4.8.7 using the XTandem search engine for protein quantification. The 167 different protein hits (Table S2) obtained from Scaffold were analyzed to study expression patterns. The proteins identified by LC-MS/MS can be classified into groups: blood-clotting factors, proteases, apolipoproteins, complement factors, and serum amyloid proteins. Since apolipoproteins have been linked with lung health and diseases, further study was focused on apolipoproteins.25,26 A total of 14 apolipoproteins, including ApoA1), ApoB, ApoE, ApoD, and ApoA4, were identified from LC-MS/MS across control and atopic asthma patient samples (Figure 2A and Table S3, A–C). ApoA4 was downregulated in atopic asthmatics (34.99% decrease, P<0.05), as shown in Figure 2B. Significant downregulated expression of ApoE (26.14% decrease, P<0.01) was also observed in atopic asthma patients (n=4) when compared with healthy controls (n=4) in terms of NSAF (Table S4). One healthy sample and one asthma patient sample in assessing the decreased expression of ApoE were ignored, because they appeared to be outliers in terms of computed NSAF values, as evident from the box plot in Figure 2C. As per the Human Protein Atlas, ApoA4 is not expressed in airway and lung tissue, but rather produced largely by the gastrointestinal tract.27 Since asthma primarily affects the airway tract, validation studies by Western blotting were not conducted for ApoA4. However, ApoE mRNA is expressed in lung tissue, so we validated the reduction in ApoE in allergic asthma patients by Western blotting (Figure S2).
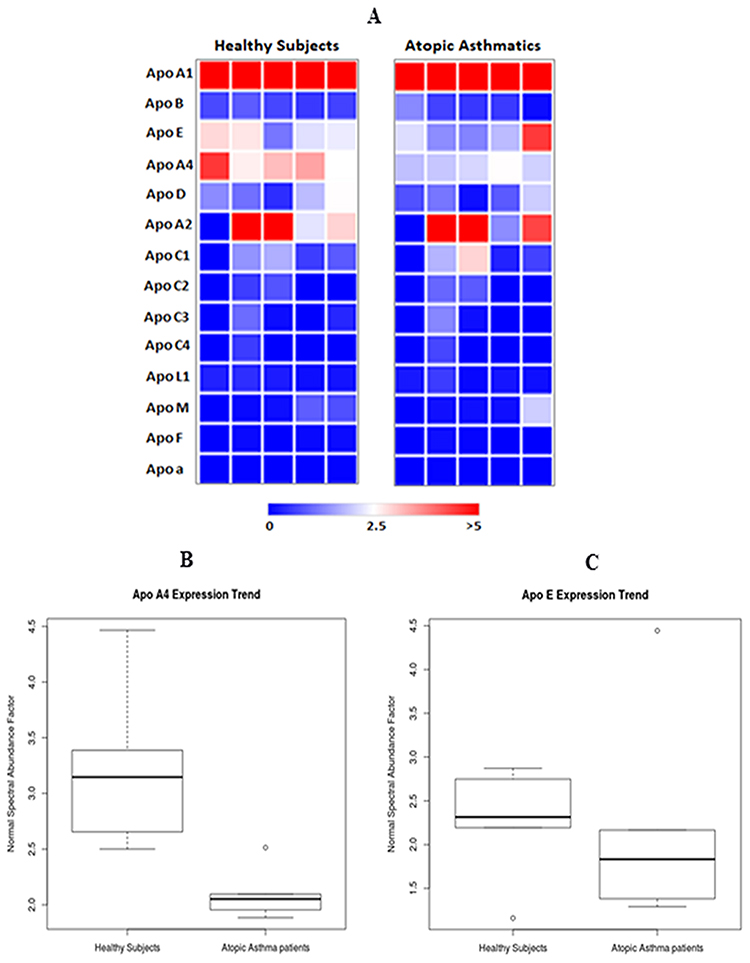 |
Figure 2 Apolipoproteins involved in atopic asthma.Notes: (A) Heat map showing expression patterns of the 14 apolipoproteins across healthy subjects and atopic asthmatics. Only ApoA4 and ApoE expression were altered significantly among the healthy volunteers and atopic asthmatics. The heat map was generated using Morpheus software. (B) ApoA4 was reduced in atopic asthmatics. The box plot (generated using R packages) shows the expression trend of ApoA4 in blood plasma of healthy volunteers (n=5) and atopic asthma patients (n=5) obtained from liquid chromatography–tandem mass spectrometry (LC-MS/MS) in terms of normal spectral abundance factor (NSAF). (C) ApoE may render protection in atopic asthmatics. The box plot (generated using R packages) shows the expression trend of ApoE in blood plasma of healthy volunteers (n=5) and atopic asthma patients (n=5) obtained from LC-MS/MS based proteomics study in terms of NSAF. |
Runs that appeared as outliers in LC-MS/MS analysis did not get reflected in low-throughput study performed with Western blot. Densitometric analysis of immunoblot data (Table S5) showed significant reduction in the expression of ApoE in atopic asthma patients (50.74% decrease, P<0.05; Figure 3, A and B). In COPD patients, ApoE showed reduction (22.63% decrease, P=0.12). The reduced expression of ApoE in COPD patients was not as marked as in atopic asthma patients. The expression pattern of ApoE in atopic asthmatics was also significantly reduced (36.33% decrease, P<0.05) compared to COPD patients.
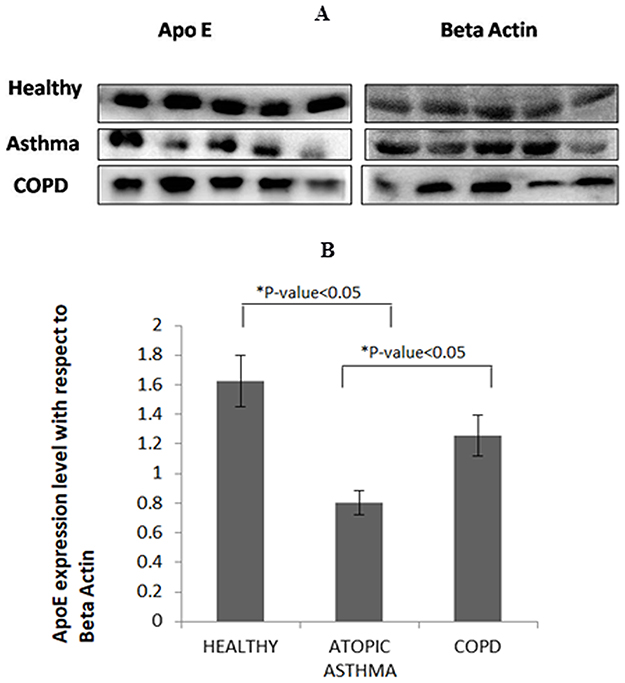 |
Figure 3 ApoE was significantly reduced in atopic asthma patients compared to healthy subjects and COPD patients.Notes: (A) The blots show a representative of the expression pattern of ApoE across healthy and clinical plasma samples, with β-actin was used as loading control. Snapshots of the blots were obtained at an exposure time of 30 seconds using Chemidoc (GE Amersham Imager 600). Snapshots of ApoE and β-actin for each category, like all healthy subjects, were obtained from the same blot. Similar blots were also generated for asthmatics and COPD patients. Full blot imagesare provided in Figure S2. (B) Densitometric analysis of Western blots performed thrice using ImageJ 1.51j8. ApoE exhibited 50.74% decreased expression (P<0.05) in atopic asthmatics compared to healthy subjects. COPD patients showed 22.63% decrease (P=0.12) in ApoE expression in comparison to healthy controls. Atopic asthmatics exhibited 36.33% lower ApoE expression compared to COPD patients (P<0.05). |
Plasma IL33 Concentration Is Increased In Atopic Asthma Patients
IL33 concentration was significantly higher (3.84-fold, P<0.01) in atopic asthma patients’ plasma samples in comparison to healthy individuals (Figure 4). For IL33, the minimum detectable dose of the kit was 0.519 pg/mL. The plasma-expression levels of IL33 in healthy subjects (n=5) and atopic asthmatics (n=5) were 2.35±0.308 pg/mL and 9.033±0.585 pg/mL, respectively (Table S7A). IL33 levels were also assessed in COPD patients. The plasma concentration of IL33 in COPD patients was found to be 5.92±0.089 pg/mL (Table S7B). Concentrations of the other cytokines studied (IL4, IL5, and IL13) were below the detection limit for both healthy and patient plasma samples (Table S6).
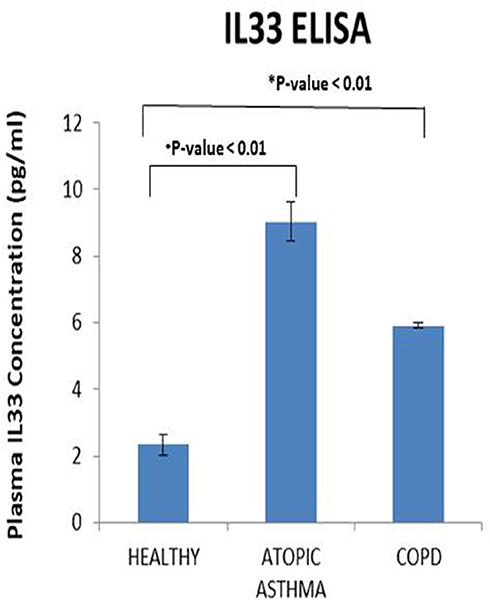 |
Figure 4 Probable role of IL33 in inflammatory response in atopic asthma.Notes: The bar graph represents comparison of plasma levels of IL33 between healthy controls (n=5), atopic asthmatics (n=5), and COPD patients (n=5). IL33 was significantly upregulated in atopic asthma patients (3.84-fold, P<0.01) compared to healthy subjects. The mean plasma level of IL33 in the control group was 2.35±0.308 pg/mL, and in allergic asthma patients the mean IL33 concentration was 9.033±0.585 pg/mL. Plasma concentration of IL33 in COPD patients was 5.92±0.089 pg/mL. Concentrations were computed using OD values at 450 nm obtained using an ELISA plate reader. |
Pathway Analysis Reveals Involvement Of Immunopathways
Pathway analysis was performed by IPA after merging the five most predominantly observed apolipoproteins (ApoA1, Apo B, ApoD, ApoE, and ApoA4) and IL33. Figure 5 reveals the different probable pathway hits obtained. Most of the pathways with ApoE as a component were found to be involved in human immunoresponse, ie, acute-phase response signaling, IL12 signaling and production in macrophages, clathrin-mediated endocytosis signaling, and production of nitric oxide and reactive oxygen species in macrophages. ApoE and IL33 were both found to be involved in several pathways, such as LXR–RXR activation, FXR–RXR activation, atherosclerosis signaling, and LPS/IL1-mediated inhibition of RXR function. These pathways are involved in lipid metabolism and inflammatory response.
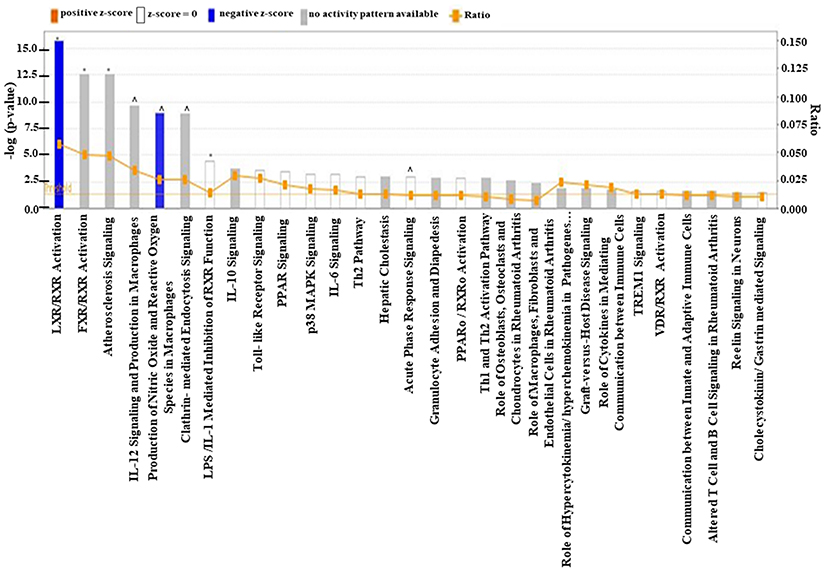 |
Figure 5 Involvement of pathways with ApoE and IL33 in human immunoresponse.Notes: Pathways obtained from ingenuity pathway analysis (IPA) of the ApoA1, ApoB, ApoE, ApoA4, ApoD, and IL-IL33. *Pathways with both ApoE and IL33. ^Pathways with ApoE. Blue bars represent negative z-scores, white bars denote z=0, and gray bars denote lack of available activity pattern. The majority of the probable pathways identified by IPA are involved in human immunity. |
Discussion
All the atopic asthma patients used in this pilot study were found to be sensitive to almost all or a majority of the most common allergens, ie, pollens (H. annuus, C. nucifera [common ragweed]), house dust mites (Dermatophagoides farinae, Dermatophagoides pternyssinus) and molds (Aspergillus fumigatus, Penicillium notatum, Candida albicans, Mucor racemosus). Blood-plasma samples obtained from the patients and healthy subjects were used for the study. Modern clinical proteomics suggests the use of plasma for identification of diagnostic and therapeutic biomarkers, as the circulating bloodstream harbors tissue-leakage proteins and inflammatory proteins that may serve as biomarker candidates.28,29 Here, we showed that plasma levels of ApoE were significantly downregulated in atopic asthmatics compared to healthy volunteers and COPD patients. ApoE is a 34 kDa protein that plays a crucial role in cholesterol transport and lipid metabolism. It is expressed by several organs, including the lungs. In the airways, ApoE is expressed primarily by CD68+ alveolar macrophages. Apart from its role in cholesterol metabolism, ApoE is known to modulate normal lung health.25 Circulating ApoA1 levels have been implicated to play a protective role in lungs.25 In our study, high abundance of ApoA1 was observed in both healthy subjects and asthmatics, but significant differences in expression profiles were not noted. However, the level of ApoE was found to be reduced in cases of atopic asthmatics, suggesting a probable protective role of ApoE in asthma. Other studies have shown that ApoE functions as a negative regulator of airway hyperresponsiveness and goblet-cell hyperplasia, features commonly noted in asthma.30 In COPD patients, there was a reduction in expression of ApoE with respect to healthy subjects, but the reduction was not as marked as in atopic asthmatics. ApoM has been reported to be significantly overexpressed in COPD.31 ApoM levels were not significantly altered in atopic asthma patients, as evident from LC-MS/MS data (Table S3). ApoA4 was significantly downregulated in atopic asthmatics (34.99% decrease, P<0.05) in our study. Apolipoproteins are released as tissue-leakage products into the bloodstream. However, ApoA4 mRNA is not expressed in the lungs, but rather produced primarily in the gastrointestinal tract.32 As such, further validation study was not conducted for ApoA4 in atopic asthmatics using Western blotting.
Apart from label-free plasma proteomics, cytokine profiling was done for IL4, IL5, IL13, and IL33 from blood-plasma samples. Concentrations of IL4, IL5, and IL13 were below the detection limits of the ELISA kits. Similar ELISA-based study of these cytokines has reported a lack of detection in plasma.33 However, IL4, IL5, and IL13 have been noted to be upregulated in sputum, bronchoalveolar lavage fluid, and peripheral blood lymphocytes of allergic asthma patients.34–36 For IL33, plasma levels of the cytokine were found to be significantly upregulated in atopic asthma patients compared to healthy individuals in this study. Similar trends in IL33 expression have been noted in bronchoalveolar lavage fluid and lungs of asthma patients in other studies, pointing toward its significant role in asthma pathogenesis.37–39 IL33 belongs to the IL1 family of cytokines, and is expressed by a variety of cells, including epithelial cells, endothelial cells, and fibroblasts.40–42 It promotes Th2-type immunoresponse by inducing the expression of inflammatory cytokines like IL4, IL5, IL13, IL1β, IL6, and TNFα.43,44 It has been noted that IL33 is associated with different types of inflammatory disease, such as rheumatoid arthritis, atopic allergy, asthma, and cardiovascular diseases, and can be targeted for therapeutic purposes.42,45 In this study, the increased levels of IL33 support its possible role in promoting systemic inflammation in asthma. IL33 levels were found to increase significantly in COPD patients; however, the rise was not as marked as in atopic asthmatics. Similar trends in IL33 expression have also been noted in exhaled breath condensate from COPD and asthma patients.46
An indirect interaction between ApoE and IL33 was observed through IPA of proteomics and cytokine data sets. IL33 is known to regulate expression of genes involved in cholesterol metabolism.47 However, the exact connection of ApoE and IL33 is not clearly known for asthma. Further experiments are required to study the role of ApoE in asthma and to understand the actual regulatory mechanisms between ApoE and IL33 involved in asthma pathogenesis. ApoE and IL33 were both found to be involved in several pathways from IPA:, LXR–RXR activation, FXR–RXR activation, atherosclerosis signaling, and LPS/IL1-mediated inhibition of RXR function. Pathway analysis in IPA also showed ApoE to be involved in immunopathways: acute-phase response signaling, IL12 signaling and production in macrophages, clathrin-mediated endocytosis signaling, and production of nitric oxide and reactive oxygen species in macrophages. This suggests that apart from its role in lipid metabolism, ApoE has significant roles in immunity.
The upregulation of IL33 and the simultaneous downregulation of ApoE serve as marker pairs, which mimics the two-gene relative expression–based biomarker or classifier system. Such two gene–based classifier systems have been highly successful in accurate distinction of clinically distinct but symptomatically similar diseases like leiomyosarcoma and gastrointestinal stromal tumors. As such, the identified ApoE and IL33 pair could serve as probable candidates for distinguishing atopic asthma from similar airway inflammatory disorders like COPD. The two-protein biomarker concept based on ApoE and IL33 and the ratio of these protein biomarkers can be implemented for testing asthma patients in future studies.
Despite interesting findings, the main limitation of our study was its relatively small sample and inclusion of atopic asthmatics only. Since the study participants were treatment-naïve asthmatics and COPD patients without any other health complications, recruitment was very difficult. Another limitation of this study was that the IgE count of the atopic asthmatics was highly variable, ranging from 385 to 1,993 IU/mL. Also, the study was not extended to nonatopic asthmatics, due to the unavailability of an adequate number of patients in the clinics during the study. Also, the study did not include nonatopic asthma patients, which is another limitation. Another important limitation was the depletion of six high-abundance proteins from blood plasma, which might have resulted in the removal of several other plasma proteins that form complexes with those six highly abundant plasma proteins. We considered ApoE as a tissue-leakage product in blood from lungs, but apolipoproteins are also secreted by other organs like the liver and intestine. However, the human lung is also known to release huge amounts of cholesterol and apolipoproteins in the bloodstream.26,48
Conclusion
In this study, a subset of patients was chosen based on their history, spirometry, and total blood-IgE levels. It can be concluded that in spite of the diversity among patients, distinct trends were found in expression levels of ApoE and IL33 in asthma patients’ samples compared to healthy subjects and COPD patients. Expression levels of ApoE were downregulated, whereas IL33 was highly expressed in asthmatics. Therefore, simultaneous downregulation of ApoE and upregulation of IL33 identified from blood plasma may serve as probable candidates for a two protein–based diagnostic and prognostic biomarker of atopic asthma and can be explored for therapeutic purposes.
Abbreviations
COPD, chronic obstructive pulmonary disorder; FEV1, forced expiratory volume in 1 second; ApoE, apolipoprotein E; IL33, interleukin 33; LC-MS/MS, liquid chromatography–tandem mass spectrometry; NSAF, normalized spectral abundance factor; IPA, ingenuity pathway analysis.
Ethics Approval And Informed Consent
Human Ethics Committee clearance (BIHEC/2014-15/4) from Bose Institute, Kolkata was obtained to work with human blood samples. All human blood samples were collected with written informed consent from patients and healthy subjects. The methods used were in accordance with relevant guidelines and regulations. All the experimental protocols were approved by the aforementioned committee.
Availability Of Data And Materials
Supporting figures and tables are included in the Supplementary file and Table S2.
Acknowledgments
The authors are grateful to the Centre for Cellular and Molecular Platforms (C-CAMP) for performing the LC-MS/MS run. The authors are also thankful to Dr Parthasarathi Bhattacharyya for critically reviewing the manuscript.
Funding
This work was supported by a grant from the Indian Council of Medical Research ICMR (BIC/12[28]/2012). Author Moumita Bhowmik is grateful to the CSIR, Government of India for the CSIR-SRF Fellowship. Author Sreyashi Majumdar is grateful to the Department of Science and Technology, Government of India for the DST-Inspire Fellowship.
Author Contributions
SS, SGB, and AD conceptualized and designed the study. MB, SM, and AD were involved in acquisition of data. SM, MB, SGB, and SS were involved in data analysis. All authors contributed toward drafting and critically revising the paper, gave final approval of the version to be published, and agree to be accountable for all aspects of the work.
Disclosure
The authors report no conflicts of interest in this work.
References
1. Gauthier M, Ray A, Wenzel SE. Evolving concepts of asthma. Am J Respir Crit Care Med. 2015;192(6):660–668. doi:10.1164/rccm.201504-0763PP
2. Salter BM, Oliveria JP, Nusca G, et al. IL-25 and IL-33 induce Type 2 inflammation in basophils from subjects with allergic asthma. Respir Res. 2016;17:5. doi:10.1186/s12931-016-0321-z
3. Lommatzsch M, Virchow JC. Severe asthma: definition, diagnosis and treatment. Dtsch Arztebl Int. 2014;111(50):847–855. doi:10.3238/arztebl.2014.0847
4. Pillai P, Corrigan CJ, Ying S. Airway epithelium in atopic and non atopic asthma: similarities and differences. ISRN Allergy. 2011. doi:10.5402/2011/195846
5. Knudsen TB, Thomsen SF, Nolte H, Backer V. A population-based clinical study of allergic and non-allergic asthma. J Asthma. 2009;46(1):91–94. doi:10.1080/02770900802524657
6. Backman H, Raisanen P, Hedman L, et al. Increased prevalence of allergic asthma from 1996 to 2006 and further to 2016-results from three population surveys. Clin Exp Allergy. 2017;47(11):1426–1435. doi:10.1111/cea.12963
7. Ray A, Oriss TB, Wenzel SE. Emerging molecular phenotypes of asthma. Am J Physiol Lung Cell Mol Physiol. 2015;308(2):L130–L140. doi:10.1152/ajplung.00070.2014
8. Ray A, Raundhal M, Oriss TB, Ray P, Wenzel SE. Current concepts of severe asthma. J Clin Invest. 2016;126(7):2394–2403. doi:10.1172/JCI84144
9. Fromer L. Diagnosing and treating COPD: understanding the challenges and finding solutions. Int J Gen Med. 2011;4:729–739. doi:10.2147/IJGM.S21387
10. Griffiths C, Feder G, Wedzicha J, Foster G, Livingstone A, Marlowe GS. Feasibility of spirometry and reversibility testing for the identification of patients with chronic obstructive pulmonary disease on asthma registers in general practice. Respir Med. 1999;93(12):903–908. doi:10.1016/s0954-6111(99)90057-4
11. Tinkelman DG, Price DB, Nordyke RJ, Halbert RJ. Misdiagnosis of COPD and asthma in primary care patients 40 years of age and over. J Asthma. 2006;43(1):75–80. doi:10.1080/02770900500448738
12. Mayeux R. Biomarkers: potential uses and limitations. NeuroRx. 2004;1(2):182–188. doi:10.1602/neurorx.1.2.182
13. Perera FP, Weinstein IB. Molecular epidemiology: recent advances and future directions. Carcinogenesis. 2000;21(3):517–524. doi:10.1093/carcin/21.3.517
14. Murugan A, Prys-Picard C, Calhoun WJ. Biomarkers in asthma. Curr Opin Pulm Med. 2009;15(1):12–18. doi:10.1097/MCP.0b013e32831de235
15. Price ND, Trent J, El-Naggar AK, et al. Highly accurate two-gene classifier for differentiating gastrointestinal stromal tumors and leiomyosarcomas. Proc Natl Acad Sci U S A. 2007;104(9):3414–3419. doi:10.1073/pnas.0611373104
16. Sircar G, Saha B, Bhattacharya SG, Saha S. Allergic asthma biomarkers using systems approaches. Front Genet. 2014;4:308. doi:10.3389/fgene.2013.00308
17. Sircar G, Saha B, Jana T, Dasgupta A, Gupta Bhattacharya S, Saha S. DAAB: a manually curated database of allergy and asthma biomarkers. Clin Exp Allergy. 2015;45(7):1259–1261. doi:10.1111/cea.12569
18. 2019 GINA Report, Global Strategy for Asthma Management and Prevention. Available from: https://ginasthma.org/gina-reports/.
19. 2019 GOLD Reports. Global Strategy for Prevention, Diagnosis and Management of COPD. Available from: https://goldcopd.org/gold-reports/.
20. Miller MR, Hankinson J, Brusasco V, et al. Standardisation of spirometry. Eur Respir J. 2005;26(2):319–338. doi:10.1183/09031936.05.00034805
21. Shevchenko A, Tomas H, Havlis J, Olsen JV, Mann M. In-gel digestion for mass spectrometric characterization of proteins and proteomes. Nat Protoc. 2006;1(6):2856–2860. doi:10.1038/nprot.2006.468
22. Zybailov BL, Florens L, Washburn MP. Quantitative shotgun proteomics using a protease with broad specificity and normalized spectral abundance factors. Mol Biosyst. 2007;3(5):354–360. doi:10.1039/b701483j
23. Madeira JP, Alpha-Bazin B, Armengaud J, Omer H, Duport C. Proteome data to explore the impact of pBClin15 on bacillus cereus ATCC 14579. Data Brief. 2016;8:1243–1246. doi:10.1016/j.dib.2016.07.042
24. Morpheus. Available from: https://software.broadinstitute.org/morpheus.
25. Gordon EM, Figueroa DM, Barochia AV, Yao X, Levine SJ. High-density lipoproteins and apolipoprotein A-I: potential new players in the prevention and treatment of lung disease. Front Pharmacol. 2016;7:323. doi:10.3389/fphar.2016.00323
26. Fessler MB. A new frontier in Immunometabolism. Cholesterol in lung health and disease. Ann Am Thorac Soc. 2017;14(Supplement_5):S399–S405. doi:10.1513/AnnalsATS.201702-136AW
27. Uhlen M, Fagerberg L, Hallstrom BM, et al. Proteomics. Tissue-based map of the human proteome. Science. 2015;347(6220):1260419. doi:10.1126/science.1260419
28. Saha S, Harrison SH, Chen JY. Dissecting the human plasma proteome and inflammatory response biomarkers. Proteomics. 2009;9(2):470–484. doi:10.1002/pmic.200800507
29. Saha S, Harrison SH, Shen C, et al. HIP2: an online database of human plasma proteins from healthy individuals. BMC Med Genomics. 2008;1:12. doi:10.1186/1755-8794-1-12
30. Yao X, Fredriksson K, Yu ZX, et al. Apolipoprotein E negatively regulates house dust mite-induced asthma via a low-density lipoprotein receptor-mediated pathway. Am J Respir Crit Care Med. 2010;182(10):1228–1238. doi:10.1164/rccm.201002-0308OC
31. Li H, Liu Y, Wang L, et al. High apolipoprotein M serum levels correlate with chronic obstructive pulmonary disease. Lipids Health Dis. 2016;15:59. doi:10.1186/s12944-016-0228-1
32. Carriere V, Vidal R, Lazou K, et al. HNF-4-dependent induction of apolipoprotein A-IV gene transcription by an apical supply of lipid micelles in intestinal cells. J Biol Chem. 2005;280(7):5406–5413. doi:10.1074/jbc.M408002200
33. Martin K, Viera K, Petr C, Marie N, Eva T. Simultaneous analysis of cytokines and costimulatory molecules concentrations by ELISA technique and of probabilities of measurable concentrations of interleukins IL-2, IL-4, IL-5, IL-6, CXCL8 (IL-8), IL-10, IL-13 occurring in plasma of healthy blood donors. Mediat Inflamm. 2006;2006(5):65237.
34. Peters MC, Mekonnen ZK, Yuan S, Bhakta NR, Woodruff PG, Fahy JV. Measures of gene expression in sputum cells can identify TH2-high and TH2-low subtypes of asthma. J Allergy Clin Immunol. 2014;133(2):388–394. doi:10.1016/j.jaci.2013.07.036
35. Tsukamoto N, Takahashi N, Itoh H, Pouliquen I. Pharmacokinetics and pharmacodynamics of mepolizumab, an anti-interleukin 5 monoclonal antibody, in healthy Japanese male subjects. Clin Pharmacol Drug Dev. 2016;5(2):102–108. doi:10.1002/cpdd.205
36. Antczak A, Domanska-Senderowska D, Gorski P, et al. Analysis of changes in expression of IL-4/IL-13/STAT6 pathway and correlation with the selected clinical parameters in patients with atopic asthma. Int J Immunopathol Pharmacol. 2016;29(2):195–204. doi:10.1177/0394632015623794
37. Momen T, Ahanchian H, Reisi M, Shamsdin SA, Shahsanai A, Keivanfar M. Comparison of interleukin-33 serum levels in asthmatic patients with a control group and relation with the severity of the disease. Int J Prev Med. 2017;8:65. doi:10.4103/ijpvm.IJPVM_324_16
38. Li Y, Wang W, Lv Z, et al. Elevated expression of IL-33 and TSLP in the airways of human asthmatics in vivo: a potential biomarker of severe refractory disease. J Immunol. 2018;200(7):2253–2262. doi:10.4049/jimmunol.1701455
39. Gluck J, Rymarczyk B, Kasprzak M, Rogala B. Increased levels of interleukin-33 and thymic stromal lymphopoietin in exhaled breath condensate in chronic bronchial asthma. Int Arch Allergy Immunol. 2016;169(1):51–56. doi:10.1159/000444017
40. Xia J, Zhao JL, Shang J, et al. Increased IL-33 expression in chronic obstructive pulmonary disease. Am J Physiol Lung C. 2015;308(7):L619–L627. doi:10.1152/ajplung.00305.2014
41. Liew FY, Girard JP, Turnquist HR. Interleukin-33 in health and disease. Nat Rev Immunol. 2016;16(11):676–689. doi:10.1038/nri.2016.95
42. Nabe T. Interleukin (IL)-33: new therapeutic target for atopic diseases. J Pharmacol Sci. 2014;126(2):85–91.
43. Kim SW, Rhee CK, Kim KU, et al. Factors associated with plasma IL-33 levels in patients with chronic obstructive pulmonary disease. Int J Chronic Obstr. 2017;12:395–402. doi:10.2147/COPD.S120445
44. Raeiszadeh Jahromi S, Mahesh PA, Jayaraj BS, et al. Serum levels of IL-10, IL-17F and IL-33 in patients with asthma: a case control study. J Asthma. 2014;51(10):1004–1013. doi:10.3109/02770903.2014.938353
45. Liew FY, Pitman NI, McInnes IB. Disease-associated functions of IL-33: the new kid in the IL-1 family. Nat Rev Immunol. 2010;10(2):103–110. doi:10.1038/nri2692
46. Tworek D, Majewski S, Szewczyk K, et al. The association between airway eosinophilic inflammation and IL-33 in stable non-atopic COPD. Respir Res. 2018;19(1):108.
47. McLaren JE, Michael DR, Salter RC, et al. IL-33 reduces macrophage foam cell formation. J Immunol. 2010;185(2):1222–1229. doi:10.4049/jimmunol.1000520
48. Gowdy KM, Fessler MB. Emerging roles for cholesterol and lipoproteins in lung disease. Pulm Pharmacol Ther. 2013;26(4):430–437. doi:10.1016/j.pupt.2012.06.002
 © 2019 The Author(s). This work is published and licensed by Dove Medical Press Limited. The
full terms of this license are available at https://www.dovepress.com/terms
and incorporate the Creative Commons Attribution
- Non Commercial (unported, 3.0) License.
By accessing the work you hereby accept the Terms. Non-commercial uses of the work are permitted
without any further permission from Dove Medical Press Limited, provided the work is properly
attributed. For permission for commercial use of this work, please see paragraphs 4.2 and 5 of our Terms.
© 2019 The Author(s). This work is published and licensed by Dove Medical Press Limited. The
full terms of this license are available at https://www.dovepress.com/terms
and incorporate the Creative Commons Attribution
- Non Commercial (unported, 3.0) License.
By accessing the work you hereby accept the Terms. Non-commercial uses of the work are permitted
without any further permission from Dove Medical Press Limited, provided the work is properly
attributed. For permission for commercial use of this work, please see paragraphs 4.2 and 5 of our Terms.