Back to Archived Journals » Open Access Journal of Sports Medicine » Volume 8
Physiological and training characteristics of recreational marathon runners
Authors Gordon D, Wightman S, Basevitch I, Johnstone J, Espejo-Sanchez C, Beckford C, Boal M ![]() , Scruton A, Ferrandino M, Merzbach V
, Scruton A, Ferrandino M, Merzbach V ![]()
Received 12 May 2017
Accepted for publication 2 August 2017
Published 24 November 2017 Volume 2017:8 Pages 231—241
DOI https://doi.org/10.2147/OAJSM.S141657
Checked for plagiarism Yes
Review by Single anonymous peer review
Peer reviewer comments 3
Editor who approved publication: Prof. Dr. Andreas Imhoff
Video abstract presented by Dan Gordon.
Views: 717
Dan Gordon,1 Sarah Wightman,2 Itay Basevitch,1 James Johnstone,1 Carolina Espejo-Sanchez,1 Chelsea Beckford,1 Mariette Boal,1 Adrian Scruton,1 Mike Ferrandino,1 Viviane Merzbach1
1Cambridge Centre for Sport and Exercise Sciences, Anglia Ruskin University, 2The Flying Runner, Cambridge, UK
Purpose: The aim of this study was to examine the physical and training characteristics of recreational marathon runners within finish time bandings (2.5–3 h, 3–3.5 h, 3.5–4 h, 4–4.5 h and >4.5 h).
Materials and methods: A total of 97 recreational marathon runners (age 42.4 ± 9.9 years; mass 69.2 ± 11.3 kg; stature 172.8 ± 9.1 cm), with a marathon finish time of 229.1 ± 48.7 min, of whom n = 34 were female and n = 63 were male, completed an incremental treadmill test for the determination of lactate threshold (LT1), lactate turn point (LT2) and running economy (RE). Following a 7-min recovery, they completed a test to volitional exhaustion starting at LT2 for the assessment of VO2max. In addition, all participants completed a questionnaire gathering information on their current training regimes exploring weekly distances, training frequencies, types of sessions, longest run in a week, with estimations of training speed, and load and volume derived from these data.
Results: Training frequency was shown to be significantly greater for the 2.5–3 h group compared to the 3.5–4 h runners (P < 0.001) and >4.5 h group (P = 0.004), while distance per session (km⋅session–1) was significantly greater for the 2.5–3 h group (16.1 ± 4.2) compared to the 3.5–4 h group (15.5 ± 5.2; P = 0.01) and >4.5 h group (10.3 ± 2.6; P = 0.001). Race speed correlated with LT1 (r = 0.791), LT2 (r = 0.721) and distance per session (r = 0.563).
Conclusion: The data highlight profound differences for key components of marathon running (VO2max, LT1, LT2, RE and % VO2max) within a group of recreational runners with the discriminating training variables being training frequency and the absolute training speed.
Keywords: endurance running, nonelite, workout structures, maximal oxygen uptake, running economy, aerobic capacity
Introduction
Marathon running is one of the largest mass participation sports offering opportunities in big city races for elite, nonelite and recreational runners to pit themselves over the 42.195 km distance. Concerning marathon performance, it is well recognized that running speed is regulated through aerobic metabolic pathways in the engaged muscle mass and economic conversion of the derived energy to muscle actions.1 Indeed, the ability to sustain race speed across the marathon is dependent on running economy (RE) reflecting the O2 cost of running at submaximal speeds,2,3 maximal oxygen uptake ( 2max),2,4 fractional utilization of 2max,2,5,6 the size of the aerobic capacity as reflected by the submaximal blood lactate response to exercise and the speed associated with lactate threshold (LT1) and lactate turn point (LT2).2,5,7
2max is an oft-cited variable in relation to the marathon; the relevance is exemplified by the notion that 2max represents the integration of the cardiovascular, respiratory and muscular systems to utilize O2 and is reflected through the Fick principle, where 2max = maximal cardiac output (Qmax)⋅maximal arteriovenous oxygen difference (a-vO2difmax). Typical 2max values for elite male and female runners have been reported in the order of 67–85 mL⋅kg–1⋅min–1 with runners referred to as “good” (finishing times of 150–180 min) exhibiting a value of 65.5 ± 1.2 mL⋅kg–1⋅min–1, while those classified as “slow runners,” that is finishing time >180 min, showing a 2max of 58.7 ± 1.9 mL⋅kg–1⋅min–1.1,2,6,7 Of significance to the marathon runner is the fractional utilization of 2max (%2max) that can be sustained as reflected by the manifestation of the LT2 response, reflecting the inability of fatty acid metabolism to sustain oxidative phosphorylation to meet the requisite exercise intensity.5 Indeed, it has been reported that, in elite marathon runners, this point occurs between 85% and 90% 2max,2,6,7 while for “slower” runners with finishing time >180 min LT2 has also been reported to occur at 85% 2max.6 Associated with this point is the fractional utilization at LT1 representing the balance between lactate efflux from the muscle and disappearance from the blood2,8 characteristically occurring at 50–80% 2max, although in highly trained marathon runners (<150 min for the marathon) it has been shown to occur at 65–80% 2max. The submaximal cost of running (RE) reflects the VO2 for any given speed and has previously been shown to account for significant variations in distance running performance among athletes with a similar 2max,5,9 with RE being shown to be influenced by a myriad of factors including 2max, training volume and training history.9
There is little doubt that the nature and accumulation of training play a pivotal role in developing the underlying physiological characteristics and thus race speed. Indeed, across a series of works,6,7,10,11 training compositions of marathon runners have been cataloged highlighting typical distances covered per week of 50.5 ± 9.1 km for runners with a marathon time ~204 min, coupled with an average training speed of 11.0 ± 1.4 km⋅h–1. Furthermore, in the elite runner with marathon times of 129 ± 2 min and 149 ± 3 min for males and females, respectively, training histories showed weekly distances of 206 ± 26 km and 166 ± 11 km coupled with a training frequency of 13.0 ± 0.7 session⋅week–1 and 12.2 ± 0.4 session⋅week–1. However, when reflecting on average finish times in mass participation marathons, the data reported for both training and underlying system physiology seem at odds, with a recent study.4 This study showcased in a sample of 91,929 that the greatest proportion of male runners (66.6%) had a finish time of >240 min and >270 min (51.1%) for females, with data from the 2015 edition of the London marathon, excluding the registered elite runners who showed a finish time of 262 ± 53 min ranging from 138 min to 459 min. Therefore, given the apparent disparities between reported training and physiological characteristics of marathon runners and typical finish times for the majority of runners, this study explores the physical and training-orientated characteristics of nonelite marathon runners with an average finish time of ~3.5 h.
Materials and methods
Following local institutional ethics approval (Faculty Research and Ethics Panel, Anglia Ruskin University) and having provided written informed consent, n = 97 marathon runners volunteered and agreed to participate (age 42.4 ± 9.9 years; mass 69.2 ± 11.3 kg; stature 172.8 ± 9.1 cm; body mass index [BMI] 20.2 ± 2.5 kg⋅m2), with a marathon finish time of 229.1 ± 48.7 min, of whom n = 34 were female and n = 63 were male. Participants were recruited through an online UK-based running website and word of mouth, with the primary inclusion criteria being that they must be completing an International Athletics Federation (IAAF) or UK Athletics (UKA) sanctioned marathon between March and May 2016. All laboratory testing was completed at least 8 weeks prior to the subsequent spring marathon, and all training data were collected at this same time point.
Submaximal treadmill test
For the determination of LT1, LT2 and RE, each participant completed an incremental test, where running speed was increased 1 kph⋅3 min–1 until LT2 was reached, upon which the test was terminated; throughout all stages the treadmill gradient was held at 1%.12 During all trials, gas exchange responses were ascertained on a breath-by-breath basis via a pre-calibrated metabolic cart (Metalyzer 3B; Cortex, Leipzig, Germany). Upon the completion of each 3-min stage, the participant stood astride of the treadmill to facilitate the collection of capillary blood sample (20 µL) for the determination of blood lactate. Each stage was separated by 1-min recovery. The initial running speed was selected to coincide with that which the athlete’s normally warm-up at, so as to enable them to ease into the protocol.
For each participant, the blood lactate responses (mM) were plotted against exercise intensity (km⋅h–1), with LT2 being determined through a visual inspection of the curve and validated independently by two physiologists. Quantification of LT1 was based on the criteria of the first initial rise beyond baseline, and again this was verified by two physiologists.
2max
Following a 7-min active recovery, upon completion of the submaximal treadmill component, treadmill speed was adjusted to that which coincided with LT2, with speed remaining constant and gradient increasing by 1%⋅min–1 until volitional exhaustion, or when the participant could not maintain a predetermined position at the front of the treadmill. Again, expired air was recorded on a breath-by-breath basis, and cardiovascular responses were determined. Upon completion of the test, a capillary blood sample (20 µL) was attained for immediate determination of postexercise blood lactate and glucose concentration. 2max was confirmed according to previously established criteria.
Pulmonary gas exchange responses
Using a low-resistance mouthpiece and turbine, assembly volumes and flow rate were determined. For the determination of expired gas concentration, O2 and CO2 were analyzed at a rate of 60 mL⋅min–1 while being drawn off directly from the mouthpiece. Using custom metabolic cart software, the gas concentrations and respiratory responses were aligned to reflect breath-by-breath gas exchange variables (2, VCO2 [VCO2= volume of carbon dioxide], minute ventilation [VE] and respiratory exchange ratio [RER]). Prior to all trials, the metabolic cart was calibrated for both volume/flow and gas concentration according to the manufacturer’s specifications.
Cardiovascular responses
During both the submaximal stages and the 2max trial, heart rate (HR) responses were recorded with a 5 s sampling frequency using a Polar 810s telemetric system (Polar, Kempele, Finland).
Blood chemistry
Prior to the commencement of all trials, baseline capillary blood samples (150 µL) were collected for the automated analysis of key hematological and biochemical markers (Opti CCA-TS; Una Health, Cardiff, UK). A resting blood lactate/glucose sample (20 µL) was also recorded (Biosen C; EKF, Stoke on Trent, UK). All equipment was calibrated as per the manufacturer’s instructions.
Training characteristics and history
All participants completed the training history questionnaire post laboratory testing. The questionnaire was designed in collaboration with physiologists, psychologists and running coaches as well as taking into account work that had been conducted previously in this field. The questionnaire included questions pertaining to the athletes’ age, racing experience, predicted finish time for the marathon, race number, use of pacing devices and personal best times across different race distances. Questions regarding training focused on the number of sessions per week (defined as the typical training week), days training per week, weekly distance covered and longest run in a week and long runs per week (>10 km), with weekly distance defined as the typical distance completed in the preparation for the marathon. From these data, the following computations were possible: average training speed (km⋅h–1), average training duration per session (h⋅session–1), training volume and training load (AU).
Statistical analyses
Analysis of the data was completed using Statistical Package for Social Sciences (SPSS, v.21; IBM Corporation, Armonk, NY, USA) for Windows and Graphpad Prism v.7 (GraphPad Software, Inc., La Jolla, CA, USA). All data are expressed as mean ± SD. Data were screened for normality of distribution and homogeneity of variance through a Shapiro–Wilk normality test. One-way analysis of variance (ANOVA) was performed to compare the physical and training characteristics between each of the groups, while post hoc pairwise comparisons were made using Tukey’s adjustment. Additional analysis of association between training and physical characteristics was made using a Pearson product-moment correlation. Statistical significance was set at P < 0.05.
Results
Group characteristics
Of the original n = 97 athletes, only 82 completed a spring marathon; thus, all data are presented on these n = 82 runners. The runners were subdivided, based on their performance in a sanctioned spring marathon, into five groups of which the basic anthropometric and physiological data are presented in Table 1, and the training characteristics in Table 2. Those in the >4.5 h group (274.7–409.4 min) had a mean completion time of 305.0 ± 39.2 min (n = 17) of whom n = 12 were female and n = 5 were male. The 4–4.5 h group had a finish time of 253.9 ± 9.1 min (n = 7) with n = 2 females and n = 5 males (240.6–263.4 min), while the 3.5–4 h group had a marathon completion time of 225.3 ± 9.2 min (210.4–239.0; n = 24) with n = 9 females and n = 15 males. The 3–3.5 h group (n = 23), n = 3 females and n = 12 males, exhibited a mean completion time of 197.6 ± 6.9 min (186.5–209.5 min). The fastest group of runners (2.5–3 h; n = 11) had a completion time of 170.6 ± 7.0 min (158.9–179.8 min) of whom there was n = 1 female and n = 10 males.
 | Table 1 Physiological characteristics of the n = 97 marathon runners Notes: Data presented as mean ± standard deviation. LT1, lactate threshold; LT2, lactate turn point; HR1, HR at LT1; HR2, HR at LT2; PBLa, peak blood lactate concentration. aSignificant difference to the 2.5–3 h group. bSignificant difference to the 3–3.5 h group. cSignificant difference to the 3.5–4 h group. dSignificant difference to the 4–4.5 h group. Abbreviations: BMI, body mass index; HR, heart rate; PBLa, peak blood lactate concentration; VE, minute ventilation. |
 | Table 2 Training and racing characteristics of the n = 82 marathon runners Notes: Data presented as mean ± standard deviation. *Aggregated scores: h⋅session–1 = h⋅week–1/sessions⋅week–1, km⋅session–1 = km⋅week–1/sessions⋅week–1; speed = km⋅session–1/h⋅session–1; volume = sessions⋅week–1 × km⋅week–1; load = % |
 2max × volume. aSignificant difference to the 2.5–3 h group. bSignificant difference to the 3–3.5 h group. cSignificant difference to the 3.5–4 h group. dSignificant difference to the 4–4.5 h group.
 2max
2max
Significant differences were observed for 2max between the 2.5–3 h group and 3–3.5 h group (P = 0.004), 3.5–4 h group (P < 0.001), 4–4.5 h runners (P = 0.01) and with the >4.5 h runners (P < 0.001), with further differences observed between 4–4.5 h and >4.5 h finishers (P = 0.000) and between the 3–3.5 h and >4.5 h groups (P < 0.001). These findings were coupled with those for VEmax which showed significant differences between the 2.5–3 h and 3–3.5 h groups (P = 0.03) and against the >4.5 h group (P < 0.001), while additional differences were observed between the 3–3.5 h and >4.5 h groups (P < 0.001) with the >4.5 h group also showing a significant difference when compared to 3.5–4 h runners (P = 0.02). There were no significant differences for HRmax, or peak blood lactate concentration (PBLa) (P > 0.05) between any of the groups.
Blood lactate responses
When considering the blood lactate responses to exercise as shown in Figure 1, significant differences were observed for the appearance of LT2 when expressed as running speed (km⋅h–1) between the 2.5–3 h, 3–3.5 h, 3.5–4 h, 4–4.5 h, and >4.5 h groups (P < 0.001, P < 0.001, P = 0.005, P < 0.001 and P < 0.001, respectively). Further differences were highlighted between the 3–3.5 h and 3.5–4 h groups (P = 0.002) and against the >4.5 h group (P < 0.001). For LT1, the >4.5 h runners were shown to be significantly different to the 4–4.5 h runners (P = 0.01), 3.5–4 h group (P = 0.000), 3–3.5 h runners (P < 0.001) and with the 2.5–3 h group (P < 0.001). The 4–4.5 h group was only shown to be significantly different to the 2.5–3 h runners (P = 0.002). Those in the 3.5–4 h group showed a significant difference of 0.8 km⋅h–1 against the 3–3.5 h group (P = 0.005) with a difference of 2.1 km⋅h–1 (P < 0.001) against the 2.5–3 h group. Those in the 3–3.5 h group showed a significantly slower running speed for LT1 of 2.3 km⋅h–1 (P < 0.001) compared to the 2.5–3 h runners. There were no significant differences (P > 0.05) for LT1 and LT2 as % 2max or for the HR (b⋅min–1) associated with LT1 or LT2 between groups. Regarding the lactate concentrations (mM) associated with LT1 and LT2, differences were observed for LT1 between the 2.5–3 h group and the 3–3.5 h runners (P < 0.001), 3.5–4 h group (P < 0.001), 4–4.5 h group (P = 0.002) and against the >4.5 h runners (P < 0.001). Additional significant differences were observed between the 3–3.5 h group and the 3.5–4 h (P = 0.005) and >4.5 h groups (P < 0.001), while for LT2 no differences were observed between any of the groups (P > 0.05).
 | Figure 1 Blood lactate responses to incremental treadmill exercise. Note: ●, >4.5 h group; ▲, 4–4.5 h group; ■, 3.5–4 h group; ♦, 3–3.5 h group; X, 2.5–3 h group. |
Running Economy
Group-based RE responses are shown in Figure 2 and reflect the relative % 2max across the range of running speeds employed during the treadmill test. Four running speeds were completed by runners from all five of the groups, which were then compared as a function of % 2max. At 10 km⋅h–1, mean responses were 75.3 ± 6.9%, 75.7 ± 6.7%, 68.9 ± 6.3%, 66.9 ± 6.4% and 61.1 ± 7.5% for the >4.5 h, 4–4.5 h, 3.5–4 h, 3–3.5 h and 2.5–3 h groups, respectively. Significant differences were observed between the 2.5–3 h group and 4–4.5 h group (P = 0.01) and >4.5 h group (P = 0.003). Responses at 11 km⋅h–1 were 80.4 ± 7.0% (>4.5 h), 76.9 ± 12.3% (4–4.5 h), 74.6 ± 7.2% (3.5–4 h), 71.7 ± 8.9% (3–3.5 h) and 63.1 ± 6.5% (3–2.5 h). Significant differences were observed between the 2.5–3 h group and the 3–3.5 h group (P = 0.003), 3.5–4 h group (P < 0.001), 4–4.5 h runners (P = 0.05) and the >4.5 h grouping (P < 0.001). In addition, significant differences were observed between the 3–3.5 h runners and the >4.5 h runners (P = 0.002), 3.5–4 h group and >4.5 h group (P = 0.01). At 12 km⋅h–1, >4.5 h runners had a response of 84.8 ± 5.7% compared to 81.4 ± 13.7% (4–4.5 h), 79.0 ± 6.3% (3.5–4 h), 76.0 ± 6.0% (3–3.5 h) and 67.2 ± 7.0% (2.5–3 h). Once again, significant differences were observed between the 2.5–3 h and the 3–3.5 h runners (P = 0.001), 3.5–4 h group (P < 0.001), 4–4.5 h runners (P = 0.03) and >4.5 runners (P < 0.001). There were also significant differences between the 3–3.5 h and >4.5 h runners (P < 0.001) and between the 3.5–4 h and >4.5 h groups (P = 0.009). At 13 km⋅h–1, responses of 87.0 ± 3.1%, 79.4 ± 16.3%, 84.2 ± 6.3%, 80.2 ± 6.0% and 72.1 ± 9.3% were observed for >4.5 h, 4–4.5 h, 3.5–4 h, 3–3.5 h and 2.5–3 h, respectively. At this running speed, significant differences were highlighted between the 2.5–3 h group and the 3–3.5 h group (P = 0.01), 3.5–4 h group (P < 0.001) and >4.5 h runners (P < 0.001). The 3–3.5 h runners were significantly more economical than the 3.5–4 h runners (P = 0.01) and >4.5 h runners (P < 0.001).
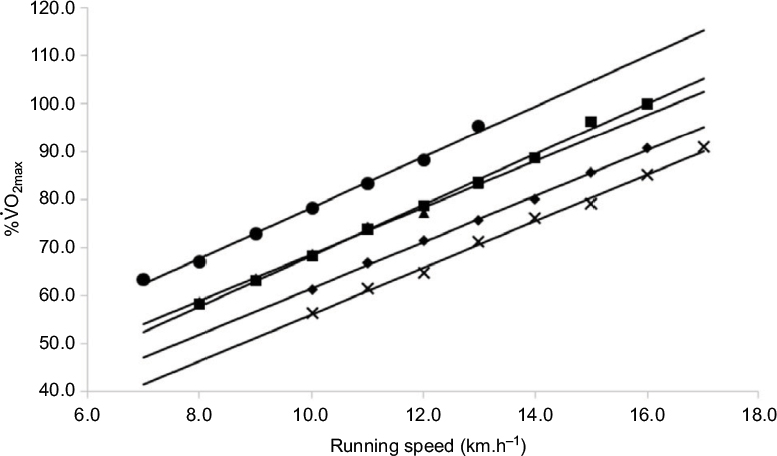 | Figure 2 RE expressed as % Note: ●, >4.5 h group; ▲, 4–4.5 h group; ■, 3.5–4 h group; ♦, 3–3.5 h group; X, 2.5–3 h group. Abbreviation: RE, running economy. |
 2max during incremental treadmill exercise.
Blood chemistry
The results of blood-based variables are presented in Table 3 for which no significant differences were observed (P > 0.05) between any of the groups.
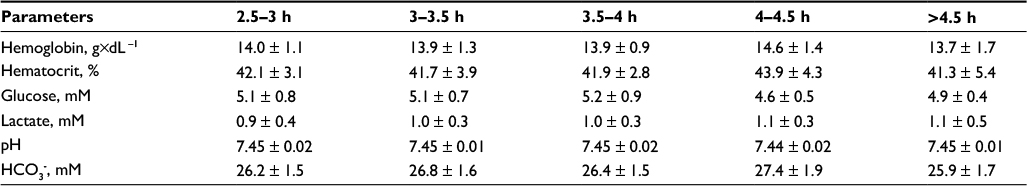 | Table 3 Resting blood-based parameters of the n = 82 participants Note: Data presented as mean ± standard deviation. Abbreviation: HCO3-, bicarbonate |
Training characteristics
The training indices for the athletes are presented in Table 2 reflecting the outcomes of intensity, frequency and duration of training. Significant differences were observed for training runs per week between the fastest runners, the 2.5–3 h group, and those in the 3.5–4 h group (P < 0.001) and those with the slowest finish time (>4.5 h; P = 0.007). Those in the 3–3.5 h group showed a significantly greater training frequency than the 3.5–4 h group (P = 0.004), with those in the 3.5–4 h group accumulating significantly fewer runs than the 4–4.5 h group (P = 0.046). No other differences were observed for training frequency. Training distance per week was shown to be significantly greater in the 2.5–3 h group when compared to the 3.5–4 h group (P = 0.01) and also on comparison to both the 4–4.5 h (P = 0.006) and >4.5 h groups (P < 0.001). Those in the 3–3.5 h group accrued significantly greater training distance per week than the runners in the 3.5–4 h group (P = 0.009) as well as those in the 4–4.5 h (P = 0.004) and >4.5 h groups (P < 0.001). Further significant differences were also evident between the 3.5–4 h runners and those in the >4.5 h group (P = 0.001), while the latter were shown to accumulate significantly less weekly training than the 4–4.5 h group (P = 0.04). The average distance completed per session was calculated as a function of d⋅week–1 and km⋅week–1 and was shown to be significantly greater for the 2.5–3 h group compared to the 3.5–4 h (P = 0.01) and >4.5 h groups (P = 0.001), while the 3–3.5 h runners completed a greater distance per session than those in the 4–4.5 h (P < 0.001) and >4.5 h groups (P < 0.001). Additional differences were observed between the 3.5–4 h group and those in the 4–4.5 h (P = 0.009) and >4.5 h groups (P < 0.001).
Average running speed during training was calculated from h⋅session–1 and distance⋅session–1 and highlighted a significantly faster estimated average training speed for those in the 2.5–3 h group compared to the 4–4.5 h group (P = 0.002) and >4.5 h runners (P = 0.005). In addition, those athletes in the 3–3.5 h pool of runners exhibited significantly faster average speeds during training than the 4–4.5 h group (P = 0.004). Training volume was significantly lower for the >4.5 h runners than the 3–3.5 h group (P < 0.001) and the 2.5–3 h athletes (P < 0.001), while additional differences were observed between the 3–3.5 h runners (P = 0.005) and the 3.5–4 h group and against the >4.5 h group (P < 0.001). Training load was shown to be significantly higher for the 2.5–3 h group compared to the 3.5–4 h group (P = 0.002) and the >4.5 h runners (P = 0.001). Meanwhile, those in the 3.5–4 h (P = 0.004) and >4.5 h groups (P < 0.001) exhibited significantly lower training loads in comparison to the 3–3.5 h runners.
When considering training speeds (average), these were compared to the speed associated with both LT1 and LT2 derived from the treadmill test. For LT1, the 4–4.5 h group showed a significant difference of –1.0 ± 2.0 km⋅h–1 (P = 0.02). For LT2, significant differences were encountered for the 2.5–3 h group (P < 0.001), 3–3.5 h runners (P = 0.001), 3.5–4 h group (P < 0.001), 4–4.5 h group (P < 0.001) and for the >4.5 h runners (P = 0.008) with differences of –4.2 ± 2.4 km⋅h–1, –3.7 ± 4.4 km⋅h–1, –2.9 ± 4.1 km⋅h–1, –3.6 ± 2.2 km⋅h–1 and –3.8 ± 3.5 km⋅h–1, respectively. Training speeds were also compared to the average speed during the marathon indicating significant differences for the 2.5–3 h group (P < 0.001) of -3.4 ± 2.1 km⋅h–1, 3–3.5 h runners of -2.3 ± 8.3 (P = 0.02) and the 4–4.5 h group (P = 0.01) of -3.0 ± 3.3 km⋅h–1. From the blood lactate data, a series of training zones were discerned of which the steady zone, denoted as the difference between LT1 and LT2, was of interest. Speed ranges were calculated for this zone for each group and were shown to be 3.4 ± 0.7 km⋅h–1 (2.5–3 h), 2.7 ± 0.8 km⋅h–1 (3–3.5 h), 2.6 ± 0.9 km⋅h–1 (3.5–4 h), 2.6 ± 0.9 (4–4.5 h) and 2.2 ± 0.8 km⋅h–1 (>4.5 h), with significant differences observed between 2.5–3 h and 3–3.5 h (P = 0.01), 2.5–3 h and 3.5–4 h (P = 0.002), 2.5–3 h and 4–4.5 h (P = 0.04) and 2.5–3 h and >4.5 h (P = 0.000) groups. Additional differences were also observed between the 3–3.5 h and >4.5 h groups (P = 0.03).
Association between training characteristics and physiological variables
Race speed was shown to be related to both LT1 (r = 0.791) and LT2 (r = 0.721) as well as the O2 cost (mL⋅kg–1⋅min–1) at LT1 (r = 0.701), while the 2 (mL⋅kg–1⋅min–1) at LT2 was also significantly related to race speed (r = 0.719). However, 2max showed a weaker but still significant association with race speed (r = 0.535). When considering the training characteristics, weekly training distance was shown to be significantly correlated with race speed (r = 0.494) as well as being correlated with both 2max (r = 0.453) and LT2 (r = 0.510). Distance completed per session was shown to be significantly related to race speed (r = 0.563), LT1 (r = 0.479) and LT2 (r = 0.531) but not with 2max. Meanwhile, training load (r = 0.525) but not training volume was correlated with race speed, while load was shown to be associated with 2max (r = 0.468) and LT2 (r = 0.486), but not with LT1.
Discussion
The purpose of this study was to provide insight into the physical and training characteristics of recreational marathon runners, with a completion time of 229.1 ± 48.7 min. Previous works have alluded to the importance of physical characteristics,6,7 training volume,10 training intensity,13 anthropometry,14 age15 and sex4 to distance running success, but to date very little data are available for the recreational runner.
VO2max
The mean score for maximal oxygen uptake across all participants was 53.9 ± 7.4 mL⋅kg–1⋅min–1 with a range of 39.4–79.7 mL⋅kg–1⋅min–1, in broad agreement with previous works where runners with a reported finish time of >180 min exhibited a value of 58.7 ± 1.9 mL⋅kg–1⋅min–1.6 However, of significance within this study is the data showing a profound difference between groups based on finishing times, indicating that as race speed increases and by association finish time decreases there is a concomitant increase in 2max. Although the significance of 2max to marathon performance has been debated,2,16 it is apparent that a well-developed oxygen delivery system is fundamental to marathon performance where it has been estimated that elite runners operate at ~65–85% 2max1 utilizing as much as 92% of their maximal stroke volume.17 Indeed, a significant correlation was shown between 2max and race speed in this group of recreational runners, again in broad agreement with that reported previously of r = 0.68 for runners of a similar ability (139–298 min).15,18 Thus, the data suggest that as with elite runners, 2max is important to recreational marathon performance but is not pivotal once a threshold of 53.0 mL⋅kg–1⋅min–1 is exceeded as reflected in Table 1.
Previous works7,19,20 have suggested that 2max is sensitive to training intensity, assuming an adequate training volume is undertaken, with intensities of 80–100% 2max being most closely associated with its development. Such training has been associated with increased mitochondrial density and enhanced lactate removal which have been shown as a function of the imposed lactate concentration.7,21 Interestingly, in the current study, training load, which is a function of intensity, frequency and duration rather than training volume, a composite of duration and frequency was shown to be positively correlated with 2max, thus implying that the discriminating variable as previously reported is the intensity of work. The positive correlation between 2max and distance completed per training session and distance per week reinforces the notion of a minimum training volume for the development of 2max, suggesting that a minimum training distance per session is ~15 km with a minimum training distance of 56.2 ± 14.8 km per week. This finding is supported by earlier works,6 where training distance per week for the slower runners (>180 min) was 57 km which was associated with a 2max of 58.7 mL⋅kg–1⋅min–1. The 2max for the fastest runners (2.5–3 h) of 63.3 ± 7.7 mL⋅kg–1⋅min–1 was in agreement with previous works 65.6 ± 1.2 mL⋅kg–1⋅min–1 and 60.6 ± 9.7 mL⋅kg–1⋅min–1,16,33 with similar marathon race times to those reported in this study. Although it has previously been argued that the 2max is not pivotal to marathon success, this and previous studies lend support to the notion that marathon race speed is partly dependent on 2max. This is highlighted by the observed significant relationship, which was reported in previous studies of elite and nonelite marathoners.7,16
Running economy
Running economy, defined as the O2 cost22 showed no significant difference across running speeds from 10 kph to 13 kph, equating to treadmill speeds where participants from all group bandings registered a score. As would be anticipated irrespective of race speed, there was a linear response between the O2 cost of running and treadmill speed, with the slope of the regression line for all groups being in broad agreement with that reported previously for athletes of a similar race speed.15 However, when expressed as fractional utilization (%2max), notable differences were observed, with those in the 2.5–3 h group utilizing 63.5 ± 6.1% compared to those in the >4.5 h group of 86.2 ± 7.2% across running speeds of 10–13 km⋅h–1, with those in the 3–3.5 h group utilizing 68.8 ± 6.1% and the 3.5–4 h group utilizing 76.1 ± 6.5%. These responses are closely aligned to those witnessed previously32 across similar running speeds; however, it should be noted that when comparing to elite athletes,2,7 these responses are significantly higher for the same running speeds. The implication of RE to marathon running speed is well established in elite populations suggesting that successful performances are associated with lower fractional utilization of 2max (%2max). Various postulations have been attributed to the development of RE, but a consistent component is training volume,2,23,24 indeed positive correlation (r = 0.62) between RE and the number of training years, taken as a proxy for volume.25 However, of note was the suggestion that athletes’ “most” economical training speeds are those which they regularly train at.26 In the current study, average training speed was for all groups at and around LT1 corresponding to the aerobic base training zone, with the racing speeds for all groups either being at LT1 or between LT1 and LT2. Despite the assignation of the association between training volume and RE in the literature, no such association was evident within our cohort. However, given the complex nature of RE, the lack of association with a single training component should not be surprising. Indeed, changes in RE have been attributed to nefarious variables, including lower limb flexibility, running mechanics, thermoregulation, running surface, muscle stiffness and limb morphology.9,27 Given the reported differences in these variables between trained and untrained runners groups homogeneous for such components as 2max or aerobic capacity, no such association was evident. Despite the lack of evidence to support an association between training characteristics and RE in this group of runners, it should be noted that RE was still of uppermost significance to marathon running success.
Blood lactate responses
The LT2 characterized by the systematic increase in the blood lactate concentration in response to exercise intensity and reflecting the inability of fatty acid metabolism to sustain oxidative phosphorylation has been previously cited as a potent predictor of endurance performance.28,29 A significant relationship has been shown between marathon race speed and LT2,2,6,10,15,21,30 in the range of 0.78–0.98, depending on the training/racing status of the athletes. These findings are in broad agreement with those reported in this study where a significant correlation of 0.72 was observed, despite proportionally slower race speeds compared to those reported previously. The significant differences observed for both the speed and associated lactate concentration at LT2 between each of the groups were coupled with this finding, conforming to previously established principles of a rightward and downward shift in the lactate–speed profile in response to endurance training.2,8,31,32 LT2 has been shown to be highly sensitive to both training intensity and volume as reflected by significant responses to both continuous and interval-based training in moderately trained individuals.33 Within this recreational group of marathon runners, training volumes as reflected by both distance per session and distance per week as opposed to training intensity were shown to be associated with the speed at LT2. Indeed, this finding is reinforced by the positive association between LT2 and training volume, despite the apparent lack of association with training intensity. As with the 2max responses, some caution should be applied to these findings given that we cannot discern from the data how much of the training was completed above and below LT2 and how intense the interval-based sessions were. However, what is fascinating is the average training speed in comparison to those associated with both LT2 and LT1; not surprisingly all groups were training at speeds which were significantly slower than that associated with LT2. Training below this point has been associated with the development of the aerobic base and associated physiological components including increased stroke volumes, capillarization, mitochondrial density and increased muscle glycogen content;33 however, as Midgley et al34 highlighted, there has to be a minimum intensity for this type of training below which the adaptive responses are not induced. The aerobic base range is denoted by the difference between LT1 and LT2 and of note within this group of runners was that a significant difference was evident between the 2.5–3 h group and all other groups highlighting a greater aerobic base range for these runners. Of interest was that all groups completed their training with an average speed ≥LT1. Previous works7,10,35,36 suggest that marathon runners typically apply the majority of their training (59.5–87.0% week–1) to what were termed long slow distance runs, below LT1. Furthermore, it has also been observed that, depending on the period of the training year, high-performance endurance athletes would typically devote 70–90% of their training to intensities to blood lactate concentrations of ≤2 mM, corresponding to LT1.7,11
Training characteristics
The most striking difference among the groups was the training distance completed per week with runners in the 3.5–4 h, 4–4.5 h and >4.5 h groups all covering significantly less distance than those in the faster 2.5–3 h and 3–3.5 h groups. However, in comparison to elite and nationally ranked runners with finish times of ~140 min, these distances are even for those in the fastest group substantially lower; ~145 km.10,11 Of note was the difference for training frequency, expressed as sessions⋅week–1 between elite/nationally ranked runners (8.1 ± 2.8)10 and the recreational runners in this work (4.6 ± 1.2). It would appear to be the difference in training frequency that distinguishes these athletes as exhibited by the similarity in km⋅session–1, 14.5 ± 23.6 compared to 17.9 ± 9.1 for the recreational and high-performance runners, respectively. In a comparable group of runners, with a finish time of 231.9 ± 31.7 min, a similar km⋅session–1 to those in the current study was observed (12.1 ± 15.4) suggesting that for the recreational runner the limiting factor for race speed progression is the amount of time per week that can be devoted to training. The longest run per week was shown to be similar for all groups apart from those in the 2.5–3 h (37.3 ± 5.8 km) group, with these runners completing a significantly longer training run, ~6 km further than those in the other groups; however, in comparison to elite runners (39.0 ± 1.6 km), little difference is evident.
Typically, a recreational runner completes ~3.7 ± 1.6 runs per week compared to elite and nationally ranked runners averaging ~14.1 ± 5.2 runs per week.10 It was observed in this group of recreational runners that the average number of training sessions completed was 4.6 ± 1.2, with a range of 2–7 sessions per week. Of note was the lowest frequency of sessions (4.1 ± 1.3) for the 3.5–4 h group when compared to the other groups. It appears that this relatively low training frequency was compensated for by a significantly higher training distance per week compared to the slower runners and a distance per session that was no different to those in the faster groups. Previous work for elite athletes has suggested that there is a consistency regarding training frequency with ranges of 10–14 sessions per week being reported for endurance runners across an array of distances and disciplines,38 suggesting that the discriminating variables for performance are duration and intensity.34 There was no difference for either LT1 or LT2 when expressed as %2max between the five groups of runners; however, absolute training speed was shown to be significantly faster for those in the faster groups 2.5–3 h and 3–3.5 h compared to those in the slower groups a difference of 3.4 km⋅h–1, equitable to the differences witnessed for LT1, 2.3 km⋅h–1 and LT2, 4.6 km⋅h–1. Training intensity has been highlighted as the predominant factor in the adaptive process, assuming a minimum training intensity is achieved,34 with the minimum being a function of the physiological status of the individual, coupled with the duration threshold to establish the adaptive threshold which, for any given physiological component, has to be surpassed to drive the physiological response.24,37
Conclusion
The data presented for a recreational-based group of marathon runners offer some insight into the nature of training and associated physiological status of these runners. Across the spectrum of race completion times, noticeable differences were observed for VO2max, RE (%2max), LT1 and LT2 (km⋅h–1 and mM). The data suggest that training frequency coupled with absolute training speed are the determinants of race speed progression and that for similar groups of marathon runners the emphasis in training should be to maximize running speed within the time available, while achieving a minimum training intensity and duration threshold.
Acknowledgment
There were no funding sources associated with this study.
Disclosure
The results of this study are presented in a clear, honest manner, with no falsification, fabrication or inappropriate data manipulation. There are no personal relationships to disclose with this study. The authors report no other conflicts of interest in this work.
References
Coyle EF. Physiological regulation of marathon performance. Sports Med. 2007;37(4):306–311. | ||
Jones AM. The physiology of the world record holder for the women’s marathon. Int J Sports Sci Coach. 2006;1(2):101–116. | ||
Weston AR, Mbambo Z, Myburgh KH. Running economy of African and Caucasian distance runners. Med Sci Sports Exerc. 2000;32(6):1130–1134. | ||
Deaner RO, Carter RE, Joyner MJ, Hunter SK. Men are more likely than women to slow in the marathon. Med Sci Sports Exerc. 2015;47(3):607–616. | ||
Joyner MJ, Coyle EF. Endurance exercise performance: the physiology of champions. J Physiol. 2008;586(1):35–44. | ||
Sjodin B, Svedenhag J. Applied physiology of marathon running. Sports Med. 1985;2(2):83–99. | ||
Billat VL, Dermarle A, Slawinski J, Paiva M, Koralsztein JP. Physical and training characteristics of top-class marathon runners. Med Sci Sports Exerc. 2001;33(12):2089–2097. | ||
Brooks GA. Current concepts in lactate exchange. Med Sci Sports Exerc. 1999;23(8):895–906. | ||
Saunders PU, Pyne DB, Telford RD, Hawley JA. Factors affecting running economy in trained distance runners. Sports Med. 2004;34(7):465–485. | ||
Karp JR. Training characteristics of qualifiers for the U.S. Olympic marathon trials. Int J Sports Physiol Perform. 2007;2(1):72–92. | ||
Seiler S. What is the best practice for training intensity and duration distributions in endurance athletes? Int J Sports Physiol Perform. 2010;5(3):276–285. | ||
Jones AM, Doust JH. A 1% treadmill grade most accurately reflects the energetic cost of outdoor running. J Sports Sci. 1996;14(4):321–327. | ||
Tanda G. Prediction of marathon performance time on the basis of training indices. J Hum Sport Exerc. 2011;6(3):511–520. | ||
Brandun U, Knechtle B, Knechtle P, et al. Running speed during training and percent body fat predict race time in recreational male marathoners. Open Access J Sports Med. 2012;3:51–55. | ||
Scrimgeour AG, Noakes TD, Adams B, Myburgh K. The influence of weekly training distance on fractional utilisation of maximum aerobic capacity in marathon and ultra-marathon runners. Eur J Appl Physiol. 1986;55(2):202–209. | ||
Maughan RJ, Leiper JB. Aerobic capacity and fractional utilisation of aerobic capacity in elite and non-elite male and female marathon runners. Eur J Appl Physiol. 1983;52(1):80–87. | ||
Billat VL, Petot H, Landrain M, Meilland R, Koralsztein JP, Hamard LM. Cardiac output and performance during a marathon race in middle aged recreational runner. ScientificWorldJournal. 2012;2012:810859. | ||
Hagan RD, Smith MG, Gettman LR. Marathon performance in relation to maximal aerobic power and training indices. Med Sci Sports Exerc. 1989;13(3):185–189. | ||
Tabata I, Irisama K, Kouzaki M. Metabolic profile of high intensity exercises. Med Sci Sports Exerc. 1997;29(3):380–395. | ||
Wenger HA, Bell GJ. The interactions of intensity, frequency and duration of exercise training in altering cardiorespiratory fitness. Sports Med. 1986;3(5):346–356. | ||
Yeo WK, Paton CC, Granham AP, Burke LM, Carey AL, Hawley JA. Skeletal muscle adaptation and performance responses to once a day versus twice every second day endurance training regimens. J Appl Physiol. 2008;105(5):1462–1470. | ||
Helgerud J, Storen O, Hoff J. Are there differences in running economy at different velocities for well-trained distance runners? Eur J Appl Physiol. 2010;108(6):1099–1104. | ||
Green MJ, Sapp AL, Pritchett RC, Bishop PA. Pacing accuracy in collegiate and recreational runners. Eur J Appl Physiol. 2010;108(3):567–572. | ||
Pate RR, Branch JD. Training for endurance sport. Med Sci Sports Exerc. 1992;24(9):340–343. | ||
Mayhew JL, Piper FC, Etheridge GL. Oxygen cost and energy requirement of running in trained and untrained males and females. J Sports Med Phys Fitness. 1979;19(1):39–44. | ||
Jones AM, Carter H. The effect of endurance training on parameters of aerobic fitness. Sports Med. 2000;29(6):373–386. | ||
Barnes KR, Kilding AE. Strategies to improve running economy. Sports Med. 2015;45(1):37–56. | ||
Farrell PE, JWilmore JH, Coyle EF, Billing JE, Costill DL. Plasma lactate accumulation and distance running performance. Med Sci Sports Exerc. 1979;11(4):338–344. | ||
Yoshida T, Udo M, Iwai K, Yamaguchi T. Physiological characteristics related to endurance running performance in female distance runners. J Sports Sci. 1993;11(1):57–62. | ||
Roecker K, Schotte O, Neiss A, Iess A, Horstmann T, Dickhuth HH. Predicting competition performance in long distance running by means of a treadmill test. Med Sci Sports Exerc. 1998;30(10):1552–1557. | ||
Poole DC, Gaesser G. Response of ventilatory and lactate thresholds to continuous and interval training. J Appl Physiol. 1985;58(4):1115–1121. | ||
Carter H, Jones A, Doust J. Effect of six weeks endurance training on the lactate minimum speed. J Sports Sci. 1999;17(12):957–967. | ||
Kubekeli ZN, Noakes TD, Dennis SC. Training techniques to improve endurance exercise performances. Sports Med. 2002;32(8):489–509. | ||
Midgley AW, McNaughton LC, Jones AM. Training to enhance the physiological determinants of long-distance running performance. Sports Med. 2007;37(10):857–880. | ||
Bale P, Rowell S, Colley E. Anthropometric and training characteristics of female marathon runners as determinants of distance running performance. J Sports Sci. 1095;3(2):115–126. | ||
Billat VL, Lepretre PM, Heugas AM, Laurence MH, Salim D, Koralsztein JP. Training and bioenergetic characteristics in elite male and female Kenyan runners. Med Sci Sports Exerc. 2003;35(2):297–304. | ||
Beneke R, Leithauser RM, Ochentel O. Blood lactate diagnostics in exercise testing and training. Int J Sports Physiol Perform. 2011;6(1):8–24. | ||
Tanaka K, Matsuura Y. Marathon performance, anaerobic threshold and onset of blood lactate accumulation. J Appl Physiol. 1984;57(3):640–643. |
 © 2017 The Author(s). This work is published and licensed by Dove Medical Press Limited. The
full terms of this license are available at https://www.dovepress.com/terms
and incorporate the Creative Commons Attribution
- Non Commercial (unported, 3.0) License.
By accessing the work you hereby accept the Terms. Non-commercial uses of the work are permitted
without any further permission from Dove Medical Press Limited, provided the work is properly
attributed. For permission for commercial use of this work, please see paragraphs 4.2 and 5 of our Terms.
© 2017 The Author(s). This work is published and licensed by Dove Medical Press Limited. The
full terms of this license are available at https://www.dovepress.com/terms
and incorporate the Creative Commons Attribution
- Non Commercial (unported, 3.0) License.
By accessing the work you hereby accept the Terms. Non-commercial uses of the work are permitted
without any further permission from Dove Medical Press Limited, provided the work is properly
attributed. For permission for commercial use of this work, please see paragraphs 4.2 and 5 of our Terms.