Back to Archived Journals » Biosimilars » Volume 6
Physicochemical and biological comparison of the first Brazilian biosimilar filgrastim with its reference product
Authors Mantovani M, Caruso C, Facchini F, Pascon R, Cagnacci P, Magalhaes V
Received 6 March 2016
Accepted for publication 28 April 2016
Published 30 August 2016 Volume 2016:6 Pages 45—60
DOI https://doi.org/10.2147/BS.S107898
Checked for plagiarism Yes
Review by Single anonymous peer review
Peer reviewer comments 4
Editor who approved publication: Dr Shein-Chung Chow
Monique Mantovani,1,2 Cecilia Sulzbacher Caruso,1 Fernanda Dell Antonio Facchini,1 Renata Pascon,1,3 Patrícia Ribeiro Vilaça Cagnacci,1 Vanda Dolabela de Magalhães1
1Department of Biotechnology, Eurofarma Laboratórios SA, São Paulo, SP, Brazil; 2Libbs Farmacêutica Ltda, Embu das Artes, SP, Brazil; 3Department of Biological Sciences, Federal University of São Paulo, Diadema, SP, Brazil
Abstract: The registration of biosimilars requires comparison studies to reference products to guarantee their safety, purity, efficacy, and potency. In this study, we demonstrate the similarity of a filgrastim produced by Eurofarma (Fiprima®) and one produced by Amgen Inc. (commercialized by Hoffman-La Roche Ltd, Granulokine®) in terms of drug identity, structure, purity, and bioactivity. The methods used to compare both products were the following: peptide mapping, bidimensional electrophoresis, reduced and nonreduced polyacrylamide electrophoresis, Western blotting, reverse-phase high-performance liquid chromatography, size-exclusion high-performance liquid chromatography, far and near circular dichroism, fluorescence emission, X-ray crystallography, liquid chromatography–tandem mass spectrometry, matrix-assisted laser desorption/ionization-time of flight, receptor binding, and potency by in vitro cell proliferation. Biosimilarity to Granulokine was demonstrated in terms of identity, structure, purity, and bioactivity.
Keywords: filgrastim, biosimilar, biopharmaceutical, G-CSF, comparability, neutropenia
Introduction
Biopharmaceuticals are large molecules that are considered more complex to characterize than standard small molecules.1,2 Following patent expiration, a number of so-called biosimilars have entered the market, and regulatory agencies around the world adopted guidelines to address comparison issues and guarantee the products’ quality, efficacy, and safety, starting with the European Medicines Agency.3,4 A biosimilar is defined as a biological product that is highly similar to the reference product but is not identical because their production processes, including the cell banks, are not the same. Nevertheless, no clinically meaningful differences between the evaluated product and its reference product are expected. Therefore, a biosimilar manufacturer must perform a comparability exercise to evaluate the impact of these differences on the structure and function of the protein. State-of-the-art analytical technology combined with the evaluation of biological activity is necessary for the comparison between two proteins. Moreover, toxicological assays, pharmacodynamics (PD) and pharmacokinetics (PK) attributes, and comparative clinical trials are also used to prove biosimilarity. In general, a stepwise approach is recommended, evaluating the extent of additional tests necessary to demonstrate biosimilarity based on the residual uncertainty of the already obtained data. After extensive structural and functional analysis with only minor or no differences detected among the evaluated product and the reference product, a reduced toxicological assessment may be proposed based on the scientific evidence. This reduction in assessment is especially significant in light of ethical issues concerning the use of animals in research.
Recombinant human granulocyte colony-stimulating factor (G-CSF), or filgrastim, has been used for the treatment of neutropenic patients since 1991. The reference recombinant protein has 175 amino acids, including an N-terminal methionine, which is produced in Escherichia coli by Amgen Inc. and commercialized by Hoffman-La Roche Ltd under the trade name Granulokine® in Brazil. The recombinant protein has a molecular weight of ~19 kDa and lacks glycosylation.
The European Medicines Agency approved five versions of filgrastim as biosimilars to treat neutropenia (from Ratiopharm, CT Arzneimittel, Teva, Hospira, and Sandoz), and all were compared to Neupogen® (European trade mark of the same Amgen’s product used in the comparability exercise presented by Eurofarma®), which reduced health care costs.5 Food and Drug Administration approved its first biosimilar in 2015 (Zarzio® from Sandoz). In this study, we describe an extensive comparability exercise that is used to assess the similarity between Eurofarma’s recombinant filgrastim Fiprima®, which is also produced in E. coli, and the reference product Granulokine in terms of identity, structure, purity, and bioactivity. Comparative nonclinical and clinical studies and a multivariate statistical analysis of the whole comparability study will be published elsewhere.
Materials and methods
In the comparability study, standard and advanced analytical and biological methods were used to compare Granulokine and Eurofarma’s (Itapevi, São Paulo, SP, Brazil) drug product and substance as described in Table 1. Standard methods were those used to approve drug substance, as the methods described in the monograph 2206 of European Pharmacopeia (EP), or those described in the Certificate of Analysis of the reference product.6 The acceptance criteria were based either on the filgrastim’s monograph for drug substance or on those of the reference product, since the aim was to develop a biosimilar. All standard tests except for contaminant DNA and biological activity (potency) were performed at Eurofarma Laboratórios SA. Althea (AltheaDx, Inc, San Diego, CA, USA) tested for contaminant DNA, and the bioassay was performed at Pasteur Institute (Instituto Pasteur de Montivideo Montevideo, Uruguay). All standard methods used for drug substance and drug product quality control were developed and validated by Eurofarma in accordance to Brazilian regulations7 and the International Conference on Harmonization guidelines (ICH Q2-R1)8 before the publication of the filgrastim’s monograph. After the monograph publication, Eurofarma adopted some of the methods described there, as size-exclusion high-performance liquid chromatography (SE-HPLC), sodium dodecyl sulfate–polyacrylamide gel electrophoresis (SDS-PAGE), peptide mapping, and potency. All advanced tests were also performed comparatively, and for some tests, different batches of both products were analyzed at different sites. Moreover, both products were submitted to stress conditions in order to evaluate their behavior under situations that might exhibit tiny differences among the molecules. In total, 20 batches of Eurofarma (drug substance and drug product) and 13 batches of Granulokine were enrolled in the comparability study. No drug substance from Amgen Inc. (Thousand Oaks, CA, USA) was available. The National Institute for Biological Standards and Control code 88/502 filgrastim reference substance 1920 was used in bioassays. All EP filgrastim standards were from batch 1, but it was not always available due to shortage of supply, as informed by EP. Therefore, even after the filgrastim’s monograph publication, Eurofarma produced its own standard that was extensively characterized and used throughout the analysis as an in-house filgrastim standard, internal or secondary standard. Reference standard CRS (Chemical Reference Substances) for filgrastim was also used in this exercise.
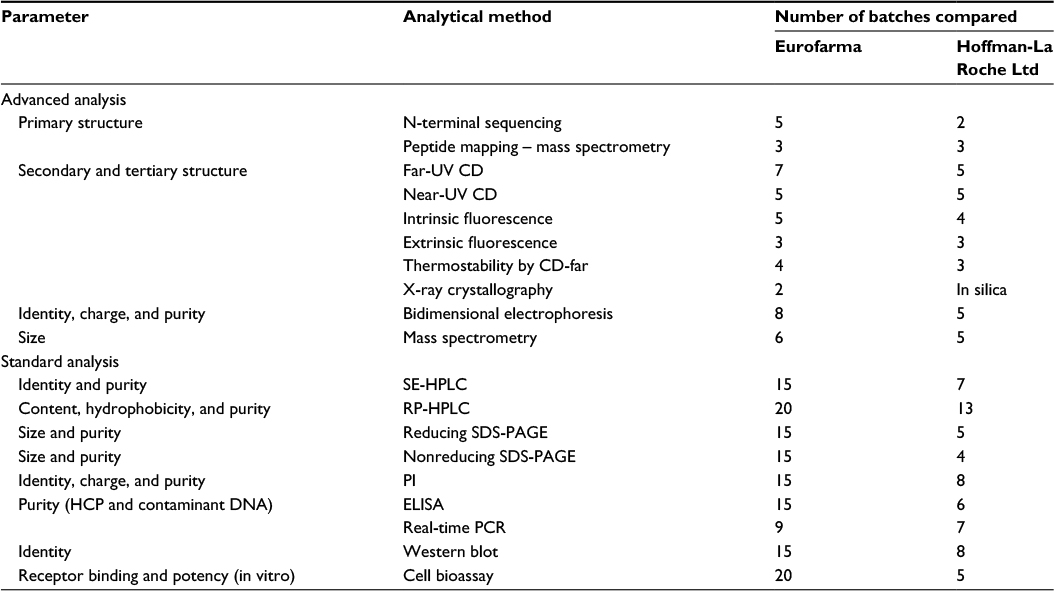 | Table 1 Analytical methods and batches used to compare Eurofarma’s Fiprima® and Hoffman-La Roche Ltd Granulokine® Abbreviations: UV, ultraviolet; CD, circular dichroism; SE-HPLC, size-exclusion high-performance liquid chromatography; RP-HPLC, reverse-phase high-performance liquid chromatography; SDS-PAGE, sodium dodecyl sulfate–polyacrylamide gel electrophoresis; PI, isoelectric point; ELISA, enzyme-linked immunosorbent assay; HCP, host cell protein; PCR, polymerase chain reaction. |
Primary structure
The primary structure of both products was analyzed using two approaches, N-terminal sequencing and peptide mapping (liquid chromatography–tandem mass spectrometry). In total, primary structure of eight batches of Eurofarma’s filgrastim was compared with five batches of Granulokine using either of these methods.
EMBRAPA Laboratories and the Biophysics Department of the Universidade Federal de São Paulo used the same approach and equipment for N-terminal sequencing. N-terminal sequencing used a PPSQ/23 sequencer (Shimadzu Co., Tokyo, Japan) connected to an isocratic HPLC system after the Edman degradation procedure (HCT Ultra EDT II; Bruker Corporation, Billerica, MA, USA) in standard positive electrospray ionization mode. The solvents were 50% acetonitrile (ACN) and 1% formic acid.
Centro de Espectrometria de Massas Aplicada Ltda used peptide mapping to analyze the amino acid sequence by liquid chromatography–tandem mass spectrometry and compared three batches of each product. The batches were different from those used for N-terminal sequencing. The samples were digested with endonuclease Glu-C, and a reverse-phase C4 column separated the peptides as described in the monograph of EP.6 The molecular masses of the peptides were determined by tandem electrospray ionization mass spectrometry (3200 QTRAP; AB Sciex, Framingham, MA, USA) and matrix-assisted laser desorption/ionization-time of flight (MALDI-TOF; UltraFlexXtreme; Bruker Corporation).
Secondary and tertiary structure
The Molecular Biophysics Group at Universidade Federal de São Carlos used far- and near-ultraviolet circular dichroism (far-UV CD and near-UV CD) and steady-state fluorescence spectroscopy to assess the secondary and tertiary structures of five batches of Eurofarma and two of Hoffman-La Roche Ltd in a head-to-head comparison.
The Laboratório Nacional de Biociências assessed these characteristics with another five batches of Eurofarma and three of Hoffman-La Roche Ltd using the same approaches.
Samples at 0.16 mg/mL and 3.0 mg/mL in acetate buffer were used when recording the far-UV CD spectra and near-UV CD spectra from 190 nm to 250 nm and 250–320 nm, respectively, on a JASCO J-815 spectropolarimeter (Jasco Instruments, Tokyo, Japan), as an average of three scans using a 1 mm path length cylindrical quartz cuvette at 25°C. The scanning speed was 100 nm/min with a spectral bandwidth of 1 nm and a response time of 0.5 second. The acetate buffer contribution was subtracted from all experiments to eliminate background effects. All spectra were smoothed with a fast Fourier transform filter. The estimation of secondary structure elements was performed by far-UV CD spectra deconvolution using the CDPro package in the CDSSTR program, which contains 43 references in the data bank, although Dicropt and K2D were also used in some of the analysis, depending on the laboratory where the test was performed.9,10
Fluorescence emission (FE) spectra of samples were obtained with an ISS K2 spectrofluorimeter (ISS Fluorescence, Analytical and Biomedical Instruments, Illinois, USA) at 25°C using a circulating water bath (Thermo Fisher Scientific, Waltham, MA, USA) and a 1 cm path length rectangular quartz cuvette. Samples (0.12 mg/mL in acetate buffer) were excited at 280 nm and 295 nm, and the emission spectra were recorded from 290 nm to 450 nm and 305–450 nm, respectively. Reference spectra were recorded and subtracted after each measurement.
Data on conformational stability and the melting temperature (Tm) of the samples were assessed by far-UV CD spectra obtained as temperature was raised. Urea (6 M) treated samples were also submitted to fluorescence in order to compare the spectra of denaturated protein.
X-ray crystallography
Eurofarma’s filgrastim drug substance was crystallized at the University of São Paulo (Ribeirão Preto), and its tertiary structure was confirmed by X-ray crystallography. Two batches of the active drug substance in 9 mM acetate buffer, pH 4.0, were crystallized at 9 mg/mL in acetate buffer, pH 5.0, containing 100–200 mM lithium chloride, 100–200 mM magnesium sulfate, and 2%–4% polyethylene glycol 4000. The structures were determined at 3.4 Å and 3.8 Å resolution, respectively. The data were collected in the Brookhaven National Laboratory and processed with X-ray Detector Software.11 The structure was solved by molecular substitution using Phaser from the PHENIX programs package.12 A comparison of the tertiary structure with other filgrastim structures deposited in the Protein Data Bank, including the one by Amgen, was performed.
High-performance liquid chromatography (size exclusion and reverse phase)
All chromatographic analyses were performed on an AKTA System (GE Healthcare Bio-Sciences Corp., Piscataway, NJ, USA) configured for this purpose. All drug substances and product batches produced by Eurofarma were comparatively evaluated by reverse-phase high-performance liquid chromatography (RP-HPLC) to determine their identity, content, and purity. The liquid chromatographic system was equipped with a UV detector in an oven holding a C4 column (5 µm, 300 Å, 4.6×250 mm; Jupiter C4; Phenomenex, Torrance, CA, USA); solutions A (10% ACN in 0.1% trifluoroacetic acid) and B (80% ACN in 0.1% trifluoroacetic acid) were used as mobile phases. Prior to sample injection (10 µL), the flow rate of the equilibrium buffer (66% solution B) was set to 0.5 mL/min and the oven temperature to 22°C. After stabilization and injection, the G-CSF was eluted using a gradient of 66%–85% solution B and 34%-15% solution A. The RP-HPLC method used to quantify G-CSF from products and active pharmaceutical ingredient was developed and validated in house before the publication of the filgrastim monograph in the EP.6 Validation of RP-HPLC method evaluated the following parameters: specificity, linearity, limits of detection, limits of quantitation, range, accuracy, precision, and robustness, following Brazilian regulation7 and international guides such as ICH Q2 (R1).8 Statistical analysis evaluated the obtained data. In brief, linearity was established using six different concentrations in triplicate and showed a correlation coefficient (R) >0.99. The linear range of the method was demonstrated between 80% and 120% of the target concentration (240–360 µg/mL). Limit of detection was 0.5%, and limit of quantification was 2%. The method showed accuracy, detecting between 97% and 103% of a standard of known concentration, and the variance was <2% as tested for precision. Robustness was tested with columns from different fabricants, different concentrations of the mobile phase, and by varying the temperature of the column. At temperatures of oven >24°C, the method showed an accuracy <97% and did not pass. The method mentions the need of controlling oven temperature. A system suitability was used to approve each run in order to ensure that equipment, mobile, and stationary phases were all correctly functioning. The RP-HPLC conditions described in the Pharmacopeia6 were also used to compare some batches of Eurofarma’s substance and the EP standard. For quantification, the peak area was integrated using either the EP filgrastim standard or an internal standard as reference. The impurity acceptance criterion was 2%. Identity was defined by the relative migration of the principal peak compared to a standard.
SE-HPLC was used to detect impurities in both Eurofarma’s drug substance and product and compare to Granulokine and standards. The method used for product analysis was developed and validated in house. A Tosoh Bioscience TSKgel G2000SW column (7.5×600 mm with 10 µm particle) was used in a 90-minute run using 50 mM phosphate buffer, pH 7.0, and 150 mM NaCl as the mobile phase. Thirty micrograms of protein was injected into the column. The method used to assess the drug substance was changed to comply with the filgrastim monograph, employing a Tosoh Bioscience TSKgel G3000SWXL column (7.8×300 mm with 5 µm particle).6 The acceptance criteria for both the drug product and the substance were (that) the total of the peaks with retention time less than that of the principal peak represent a maximum of 2%.
Electrophoretic-based methods
SDS-PAGE under both reducing and nonreducing conditions used a commercial gradient gel (NuPAGE 4%–12% Bis-Tris) in NuPAGE MOPS SDS running buffer, NuPAGE lithium dodecyl sulfate sample buffer, and NuPAGE reducing agent on a MiniVE apparatus (GE Healthcare Bio-Sciences Corp.). The Silver Staining Kit and the Unstained Protein Molecular Weight Marker (14.4–116 kDa) from Thermo Fischer Scientific (Walthan, MA, USA) were used. The acceptance criteria was that the principal band of the sample migrated at a similar position when compared to the standard, and no additional bands (lower or higher in molecular mass) were more intense than the principal band obtained with a 2% dilution of the sample.
The Western blot was validated in house. After electrophoresis under reducing conditions in a commercial gradient gel (NuPAGE 4%–12% Bis-Tris) in MOPS SDS running buffer, samples were transferred onto nitrocellulose membranes (Gel Transfer Stacks Nitrocellulose) using an i-Blot apparatus according to the supplier’s instructions. A prestained protein ladder (6–180 kDa) or another equivalent prestained molecular weight standard was used in every gel. Monoclonal anti-G-CSF (Merck Millipore, Billerica, MA, USA) was diluted (1:5,000) and used as the primary antibody. The Western Blot Western Breeze Kit (WB 7103), which contains a biotin-marked secondary antibody, was used for detection. All supplies for the Western blot were from Thermo Fisher Scientific except the primary antibody, and the procedure followed the manufacturer’s recommendations. The acceptance criterion for the Western blot was the presence of a single band migrating at a similar position to the standard band.
The isoelectric point (PI) of all batches of drug substances and drug products produced by Eurofarma were compared to Granulokine and the internal standard. Samples were applied to a PhastGel isoelectric focusing (IEF) 3–9 (GE Healthcare Bio-Sciences Corp.) and run along with an IEF mix 3.6–9.3 standard provided by Sigma-Aldrich Co. (St Louis, MO, USA) in a Phast System apparatus (GE Healthcare Bio-Sciences Corp.). Separation was carried out after a prerun at 2.5 mA and 3.5 W for 9 minutes at 2,000 V. The gel was run at 200 V for 4 minutes and then at 2,000 V for the remaining 15 minutes (both at 2.5 mA and 3.5 W). Proteins were revealed with PhastGel Blue R solution. The method was validated in house, but the acceptance criteria adopted was the same as that of the EP filgrastim monograph, which is that the principal band of the sample in the electropherogram migrated at a similar position to the standard, and no impurity band was more intense than a solution containing 10% of the standard concentration.6
Some batches of Granulokine and Eurofarma’s drug products were also analyzed with a more sophisticated bidimensional electrophoresis method where their PI, purity, and molecular mass were determined by ImageMaster 2D Platinum (Genebio, Geneva, Switzerland). Samples were solubilized in buffer containing 7 mol/L urea, 2 mol/L thiourea, 2% (m/v) CHAPS, 0.5% (v/v) ampholytes pH 4–7, 1% (m/v) DTT, and 0.002% (m/v) bromophenol blue. A ready-made dehydrated gel (GE Healthcare Bio-Sciences Corp.) was used as provided by the manufacturer. To rehydrate it, the protein solution (50 µg in 250 µL) was applied and stored at 4°C for 12 hours. After placing the gel on the EttanIPGphor 3 IEF System (GE Healthcare Bio-Sciences Corp.), the IEF assay was conducted at 18°C (200 V for 1 hour, 500 V for 2 hours, 5,000 V for 2 hours, 1,000 V until reaching 18,000 V/h).
Mass spectrometry
Six Eurofarma’s batches were compared to four Granulokine batches by MALDI-TOF mass spectrometry (Micro Flex LT; Bruker Daltonik GmbH, Bremen, Germany) using alpha-cyano-4-hydorxyciannamic acid as the crystalline matrix. Prior to the determination of the mass spectra, samples were diluted 40-fold.
Potency or biological in vitro assay
The potency of the drug substance was assessed by an in vitro biological assay following the filgrastim monograph published by EP using NFS-60 cells (ATCC no CRL-1838), which depend on filgrastim to grow.6 This assay was performed at Institut Pasteur, Uruguay, where it was also validated for drug product. Dilutions of the sample were compared with dilutions of the International Standard of filgrastim (NIBSC) calibrated in international units, which are defined by the World Health Organization. Tetrazolium salt, a cytochemical stain, which is converted by cellular dehydrogenases to a colored product, was used as the staining method. The results were read on an enzyme-linked immunosorbent assay microplate reader. The acceptance criteria also followed Pharmacopeia6 specifications; the estimated potency is not less than 80% and not greater than 125% of the stated potency.
Stress conditions
In this comparability exercise, both products were subjected to the following stress conditions: storage for 12 hours at either −20°C, 0°C, 37°C, or 56°C and intense agitation (by vortex) for 2 minutes. Samples were analyzed before and after stress for content, pH, and purity by RP-HPLC, SE-HPLC, Western blot, and potency by in vitro bioassay. Samples that complied with specifications after stress were returned to regular storage conditions (between 2°C and 8°C) where they remained for 12 months, at which point they were characterized de novo by the same analytical methods. Only one batch of each product was used in this stress comparability exercise, differing only a month in their manufacturing date.
Results and discussion
Eurofarma followed published guides and the EP in order to assess biosimilarity of its filgrastim and Hoffman-La Roche Ltd reference product.3,4,6 Although the comparability exercise started before the publication or revision of some important regulatory agency’s guidelines, the strategy chosen by Eurofarma complied with all recommendations.13,14
An orthogonal approach was used to compare Eurofarma’s filgrastim with the reference product. Critical quality attributes relevant to clinical outcomes were used to compare batches of Eurofarma’s filgrastim and Granulokine as listed in Table 1.
All Eurofarma batches conformed to the acceptance criteria and did not differ significantly from one another or from Granulokine. The batches were also identical under visual inspection (appearance and color) and in terms of pH. Fiprima and Granulokine had the same constituents, consisting of filgrastim at 300 µg/0.5 mL containing acetate buffer (pH 3.8–4.2), sorbitol, and Tween 80 in the same concentrations.
Primary, secondary, and tertiary structure
The amino acid sequence of a protein is determined by the gene sequence that codifies it. During characterization of the Cell Bank responsible for the production of Eurofarma’s filgrastim, the whole plasmid where the human G-CSF gene was cloned was sequenced. The DNA sequence confirmed that the E. coli clone used for filgrastim’s production by Eurofarma was capable of producing a protein identical to the human G-CSF (data not shown).
EMBRAPA Laboratories determined the sequence of 44 amino acids of two Eurofarma batches, showing the three expected cysteines, two of them responsible for the secondary structure of the protein. Universidade Federal de São Paulo sequenced 10–12 amino acid residues of another two of Eurofarma’s batches and two of Hoffman-La Roche Ltd batches. In total, five Eurofarma batches and two Granulokine batches were compared by N-terminal sequencing and showed the expected amino acid residues, identical to human G-CSF. All samples present the initial methionine residue that is a characteristic of proteins produced by bacteria.
Peptide map is described in EP6 as an identification method for filgrastim. After digestion of the protein by Glu-C, peptides are separated by RP-HPLC. Since the endopeptidase must recognize a specific amino acid sequence, this method also evaluates the primary sequence of the protein. Ten Eurofarmailgrastim samples of different batches were compared to four batches of Hoffman-La Roche Ltd Granulokine. The profiles of all the samples separated by HPLC were similar to those of EP standard; their retention times of the main peaks and their individual areas confirmed the similarity of the two products.
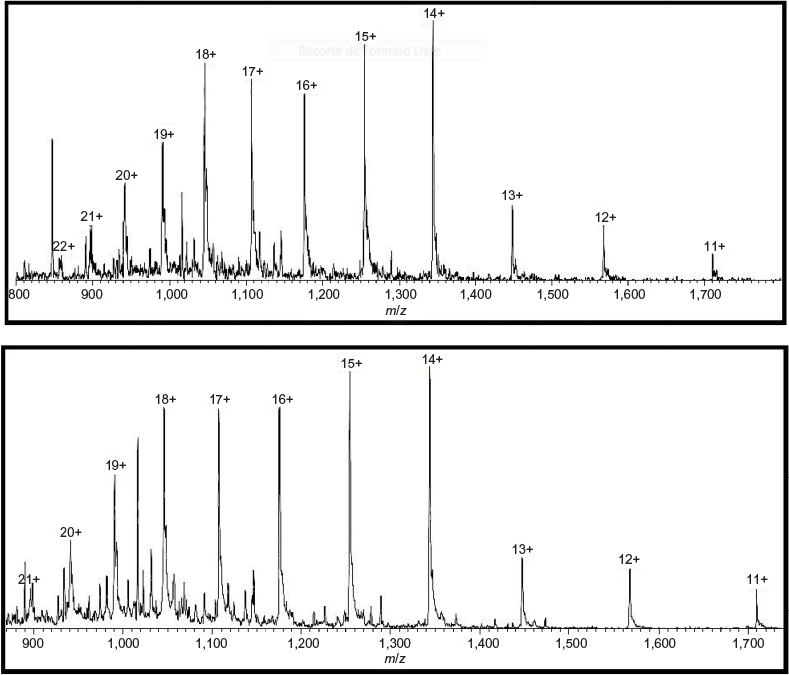
When followed by mass spectroscopy, peptide mapping can predict more accurately the amino acid sequence of a protein. The known fragments have specific molecular mass depending on their sequence. Three batches of Fiprima and three batches of Granulokine submitted to this analysis resulted in comparable and expected fragments, confirming the identity of their primary sequence. Figure 1 shows an example of the chromatograms obtained by a batch of each product.
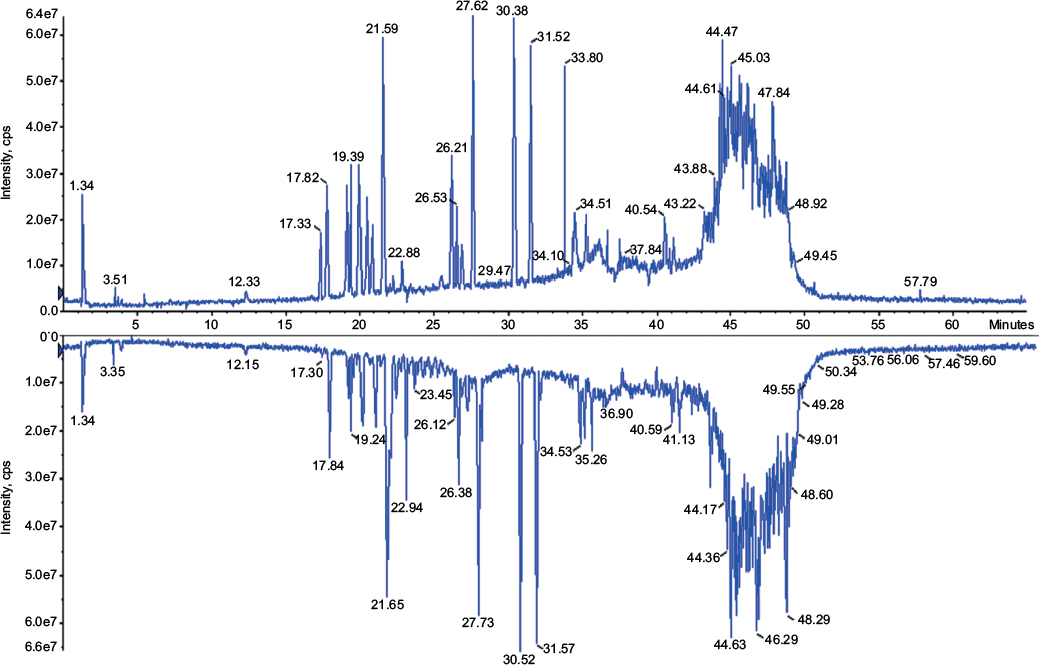 | Figure 1 Total ion current chromatogram of mass spectromery (400–1,500 m/z) comparing Fiprima® (upper spectrum batch P037) and Granulokine® (lower pectrum batch B2070B05). |
The secondary structure of seven batches of Eurofarma’s filgrastim were compared to five of Granulokine’s batches using far-UV CD. Their far-UV CD spectra were practically identical (Figure 2). The spectra have the same shape, with minima centered at 208 nm (π→π* transition) and 220 nm (n→π* transition), showing the prevalence of alpha helices in the secondary structure of both products, as described.15 The complete superposition of the obtained spectra argues in favor of proteins with similar or identical secondary structure. The data have been normalized in order to correct for concentration of the samples. Nevertheless, raw spectra data were used in the deconvolution, and in Table 2, the percentage of different secondary structures of both products shows similarity.
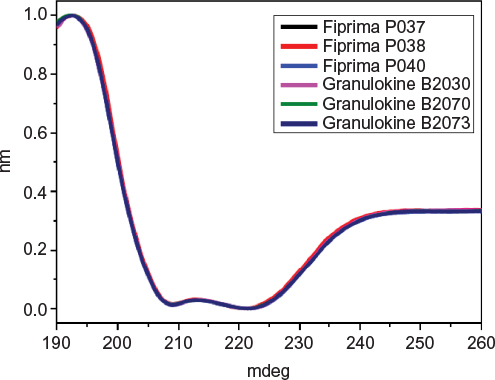 | Figure 2 Comparison of far-UV CD spectra from Fiprima® and Granulokine®. Notes: Overlay of the far-UV CD spectra of three batches of Fiprima (P037, P038, P040) and three batches of Granulokine (B2030B01, B2070B05, B2073B05). Abbreviations: CD, circular dichroism; UV, ultraviolet. |
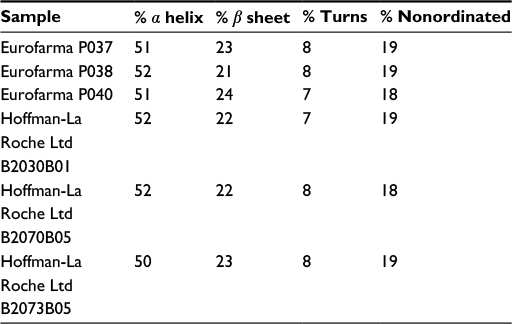 | Table 2 Deconvolution using CDSSTR database Note: Data from Sreerama et al.9 |
Analysis of far-UV CD spectra obtained as a function of temperature is considered an appropriate technique to follow unfolding of proteins.16 Thermostability of the secondary structure was challenged by varying the temperature of the samples submitted to far-UV CD spectrometry from 10°C to 80°C. Figure 3 shows how the raising of temperature affects all batches (seven from Eurofarma and three from Hoffman-La Roche Ltd) in exactly the same way. The figure shows three batches of each product partially losing their secondary structure at temperatures >60°C. The melting temperature of the samples was calculated between 66°C and 67°C. The identical behavior of both products when submitted to the stress conditions strongly suggests their similarity.
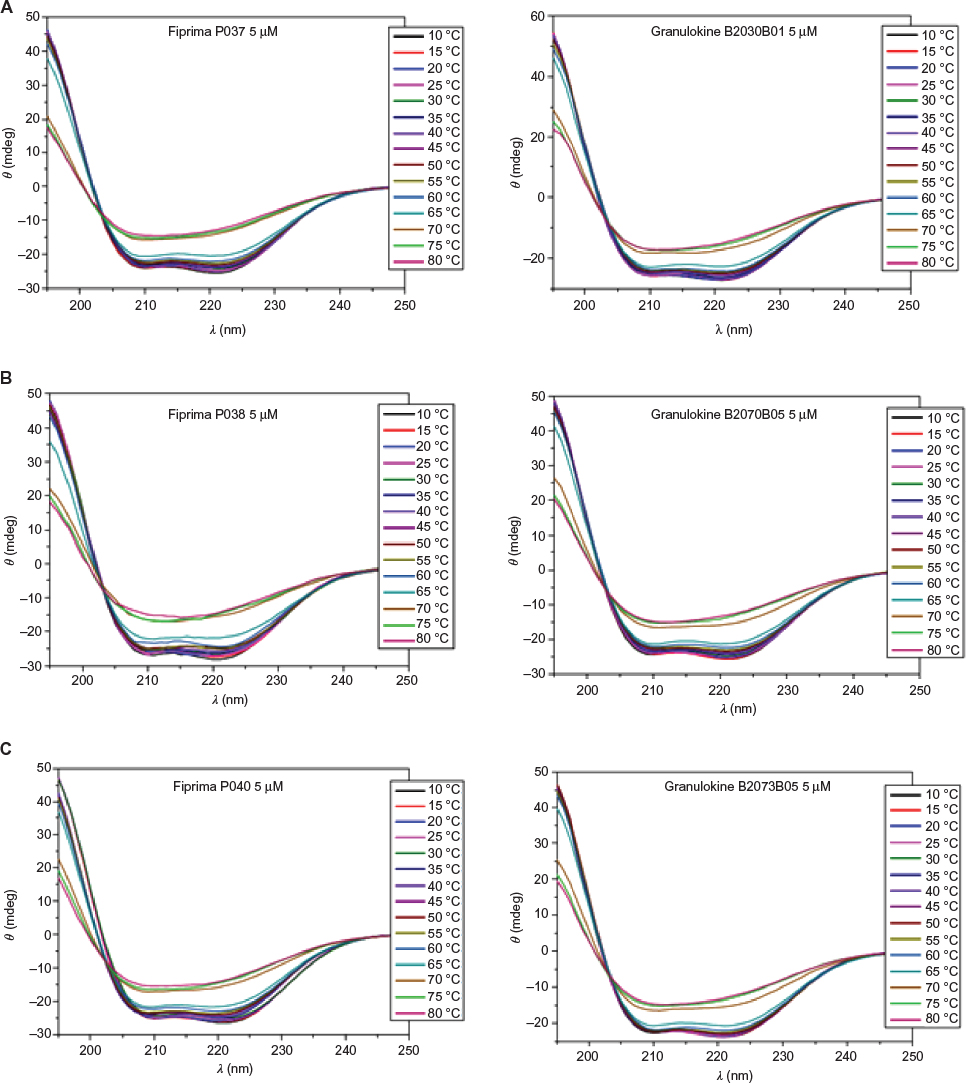 | Figure 3 Far-UV CD spectra of samples submitted to different temperatures. Notes: The three samples at the left are Eurofarma’s batches (A – P037; B – P038; C – P040) and samples at the right are Hoffman-La Roche Ltd (A – B2030B01; B – B2070B05; C – B2073B05). Abbreviations: CD, circular dichroism; UV, ultraviolet. |
Figure 4 shows a superposition of nonnormalized spectra of three of Eurofarma’s filgrastim and two of Hoffman-La Roche Ltd batches for comparison. The spectra show superposed peaks between 250 nm and 320 nm, corresponding to phenylalanine, tyrosine, and tryptophan absorption. All samples show a more negative peak around 280 nm, as indicated by the arrow, confirming their similar tertiary structure.
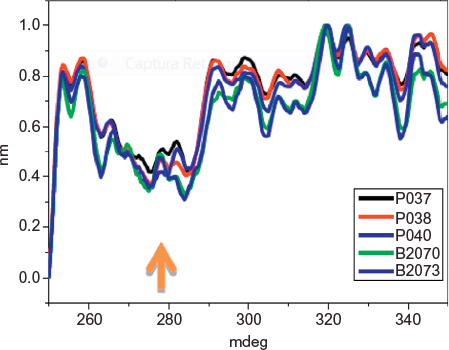 | Figure 4 Near-UV CD nonnormalized spectra of samples of Eurofarma’s (P037, P038, P040) and Hoffman-La Roche Ltd batches (B2070B05, B2073B05). Note: Arrow indicates the most negative peak. Abbreviations: CD, circular dichroism; UV, ultraviolet. |
Fluorescence spectroscopy in protein analysis can infer on the tertiary structure of the protein. Fluorescence is due to photon emission of aromatic amino acids excited by UV light. The wavelength of emission depends on the position of the aromatic amino acid in the protein tridimensional structure.17 FE spectra from all samples excited at 280 nm and 295 nm, with an emission maximum ~337 nm, were compatible with nonexposed tryptophan proteins surface. Figure 5 shows the FEs from 305 nm to 350 nm, excited at 295 nm, confirming the similarity of both products (three batches of each). After being denatured by urea, both products showed a shift in the spectra consistent with loss of the tertiary structure. The maximum peak emission of native protein is at 325 nm, and this maximum shifts to 350 nm upon urea addition.
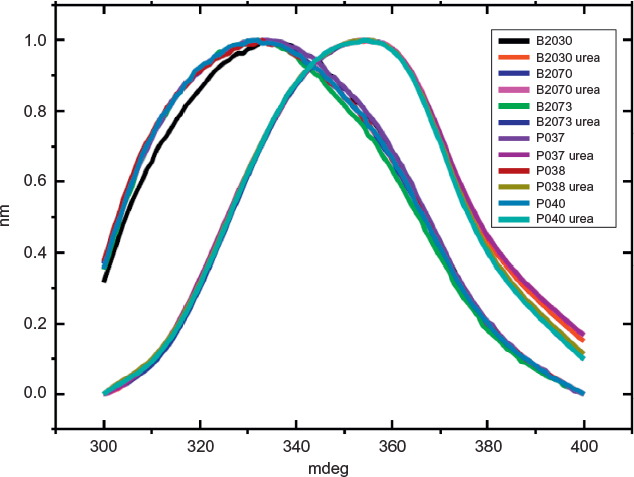 | Figure 5 Comparison of fluorescence spectra of integral and denatured filgrastim. Notes: Spectra superposition of three of Eurofarma’s batches (P037, P038, P040) and three of Hoffman-La Roche Ltd batches (B2030B01, B2070B05, B2073B05). Urea was the denaturing agent. |
The FEs from 290 nm to 450 nm, excited at 280 nm, also showed superposed profiles.
The crystal structure of Eurofarma’s filgrastim confirmed that the protein is a monomer. The crystals had lattice parameters a=109.1160 Å, b=109.1160 Å, and c=314.5470 Å, α=90.0°, β=90.0°, and γ=120.0° and an index space group P6122. Comparison with other human filgrastim structures deposited in the Protein Data Bank revealed a difference of 1.2 Å (considering alpha carbons) for 1CD9 model, 1.1 Å for 1PGR model, and 0.93 Å for Amgen’s 1RHG (yellow). Amgen’s filgrastim is commercialized by Hoffman-La Roche Ltd. In Figure 6, the overlay of Eurofarma’s filgrastim (blue) and the other models confirms that they all share the same tertiary structure.
 | Figure 6 Comparison of tertiary structure of filgrastim. Notes: Overlay of tertiary structure of Eurofarma’s filgrastim Fiprima® (blue) and other human filgrastims deposited in Protein Data Bank (1CD9 in green, 1PGR in pink, and Angem’s 1RHG in yellow). |
Molecular mass and purity
MALDI-TOF used to assess the molecular mass of six batches of Fiprima and four batches of Granulokine confirmed their similarity and the expected size; median of 18,791 kDa for Eurofarma’s batches and of 18,814 kDa for Hoffman-La Roche Ltd batches. No peaks corresponding to contaminants or impurities were observed in the mass profiles.
Molecular weight was also evaluated by SDS-PAGE in a comparative manner confirming the expected mass around 19 kDa (Figure 7). The electrophoretic mobility of the main band of 15 batches of Eurofarma’s filgrastim and five batches of Hoffman-La Roche Ltd corresponded to that of the reference standard in both reduced and nonreduced conditions. The validation proved that this method was capable of detecting 2% of impurities. No spurious band was detected ratifying the purity of the samples.
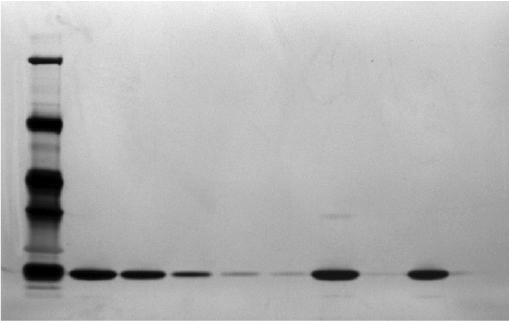 | Figure 7 Electrophoresis (reduced SDS-PAGE) silver stained comparing Eurofarma batch P003 and Hoffman-La Roche Ltd batch B2010B02. Notes: From left to right: Molecular weight standard; P003 at 100 µg/mL; P003 at 50 µg/mL; P003 at 10 µg/mL; P003 at 2 µg/mL; P003 at 1 µg/mL; CRS at 100 µg/mL; CRS at 2 µg/mL; Granulokine® B2010B02 at 100 µg/mL; Granulokine B2010B02 at 2 µg/mL. Abbreviations: SDS-PAGE, sodium dodecyl sulfate–polyacrylamide gel electrophoresis; CRS, Chemical Reference Substances. |
The Western blot (WB) used a monoclonal antibody against G-CSF that recognizes only one band in all analyzed samples of both products (seven from Eurofarma and six from Hoffman-La Roche Ltd). No additional band could be seen in any of the blots in any of the products (data not shown).
IEF showed a principal band for Eurofarma’s filgrastim (seven batches) at the same position as the reference product (three batches) and the standard. No bands with different molecular masses or PIs appeared in the electropherograms. Bidimensional electrophoresis showed the same migration pattern indorsing the similarity of both products’ molecular mass, PI, and purity. No isomers, fragments, or aggregates were observed, only the principal band, as can be seen in the example presented in Figure 8.
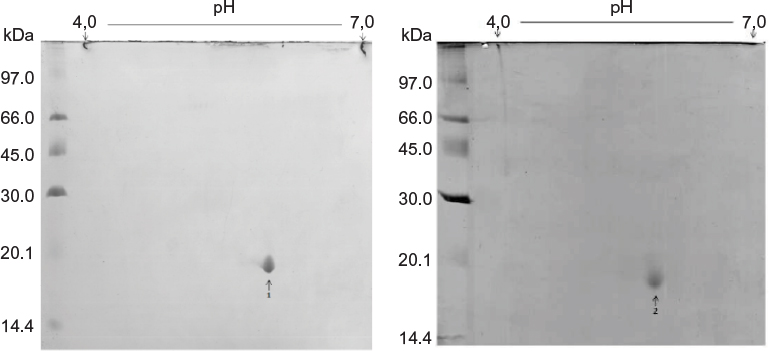 | Figure 8 Comparative bidimensional electrophoresis. Notes: Bidimensional electrophoresis of the Granulokine® batch at the left (B1037B02) and Eurofarma’s Fiprima® at the right (TP104). 1= Granulokine; 2= Fiprima |
The RP-HPLC chromatographic profiles obtained for 20 batches of Eurofarma’s filgrastim and 13 different batches of the reference product were very similar, showing the same retention time for the principal bands and impurities. No impurity represented 2% or more of the principal peak either for Eurofarma’s or Hoffman-La Roche Ltd product. RP-HPLC revealed impurities that migrate at the same position in the analyzed batches from both products. Alternative purification strategy allowed the recovery of the main impurity and mass spectrometry and confirmed that the impurity that migrates around 12.8 mL represented a filgrastim isomer (Figure 9). The samples presented identical spectra, and the deconvolution resulted in the expected mass values; ~18.8 kDa. This isomer was the main impurity in all samples analyzed and could only be detected by RP-HPLC (Figure 10 and Table 3).
 | Figure 9 Spectra obtained of impurity peak (above) and the main filgrastim peak (below). Note: The spectra is the result of mass spectrometry of the impurity peak and the main filgrastim peak. |
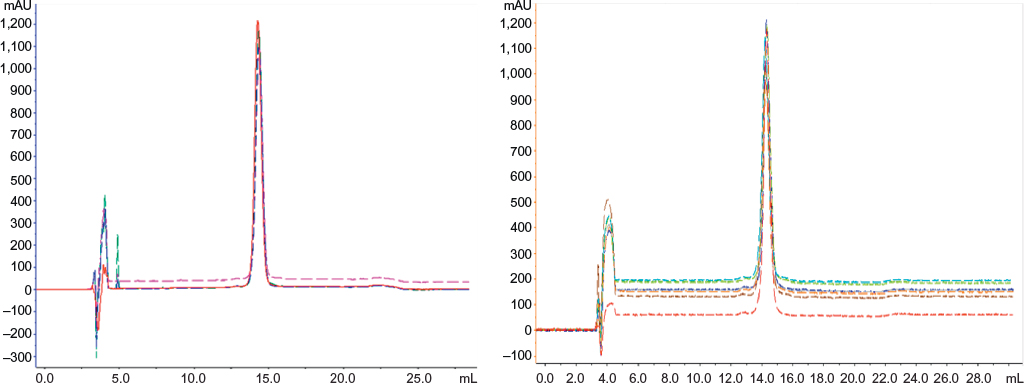 | Figure 10 Comparative RP-HPLC. Notes: Superposed RP-HPLC chromatograms of Eurofarma’s Fiprima® and Hoffman-La Roche Ltd Granulokine®. Left: Fiprima’s batches 056/10 (blue), 057/10 (green), and 058/10 (pink) and Granulokine batch B2008B01 (red); right: Eurofarma filgrastim batches P008 (blue), P037 (light blue), P038 (green), P040 (gray), and P044 (orange) and two Granulokine batches B2030B01 (red) and B2070B05 (brown). Abbreviation: RP-HPLC, reverse-phase high-performance liquid chromatography. |
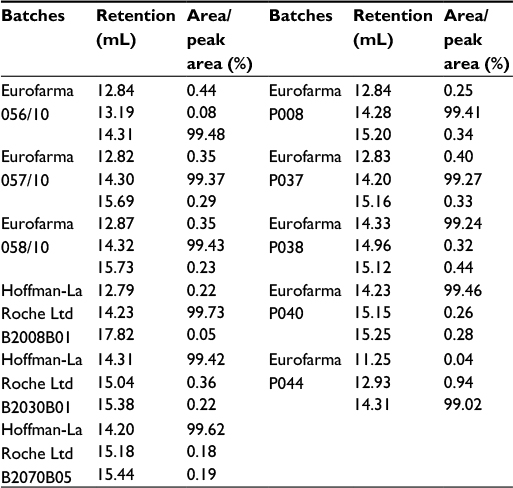 | Table 3 Retention of the peaks from RP-HPLC and their area percentage Abbreviation: RP-HPLC, reverse-phase high-performance liquid chromatography. |
Figure 10 shows superposed chromatograms from RP-HPLC analysis of Granulokine (three batches) and Eurofarma’s filgrastim (eight batches) showing the similarity of both products. Table 3 shows retention (in mL) and the percentage of each peak’s area from the chromatograms presented in Figure 10. The migration of the main peak of filgrastim produced by Eurofarma (mean of 20 batches) was 13.98±1.08 mL and filgrastim produced by Hoffman-La Roche Ltd (mean of 13 batches) was 13.74±1.16 mL. Low variability among different batches of both products was the rule throughout the comparison exercise. The main peak of filgrastim showed purity of >99% by RP-HPLC in all cases for both products.
SE-HPLC of all samples showed that both products were practically devoid of aggregates or fragments. Figure 11 shows the superposed chromatograms of batches of both products. In total, 13 batches of Eurofarma and six batches of Hoffman-La Roche Ltd showed the same retention time as the standard’s main peak (around 20 mL). The peak that migrates around 25 mL corresponds to the excipients (Table 4).
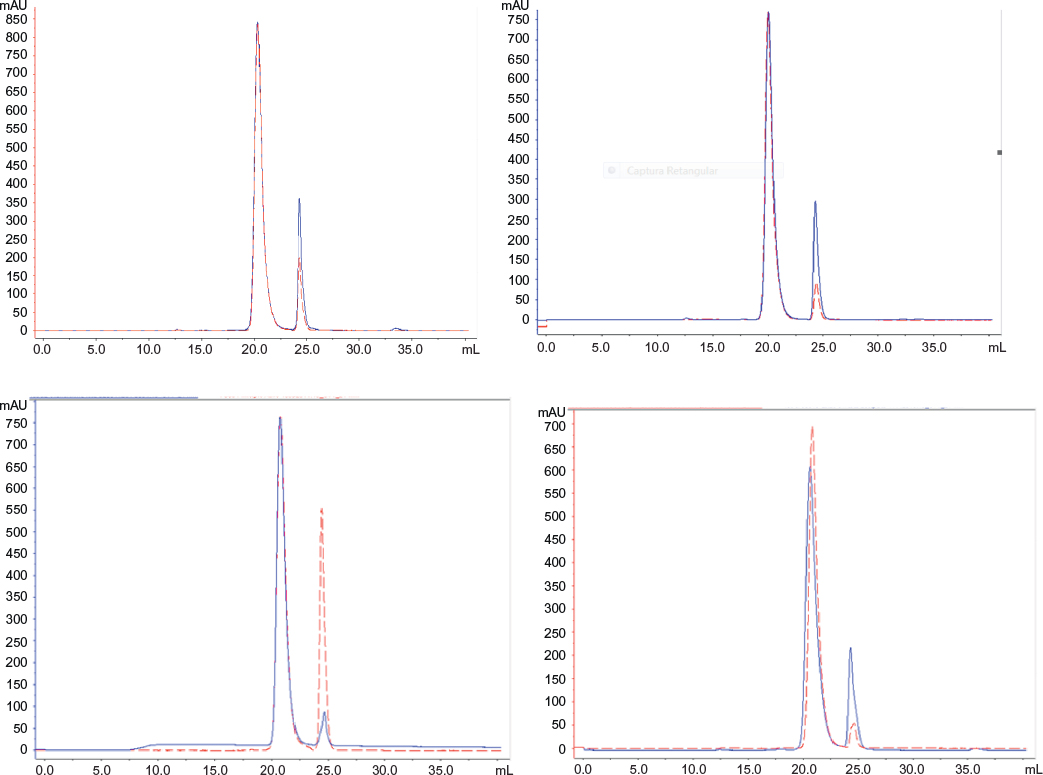 | Figure 11 Comparative SE-HPLC. Notes: Superposition of SE-HPLC chromatograms of (left top) Fiprima® batch 378/11 (blue) and Granulokine® batch B2039B13 (red). Right top: Fiprima (blue) batch 365/10 and Granulokine (red) batch B2009B01; left bottom: Eurofarma’s filgrastim P006 (red) and Granulokine (blue) batch B2011B01; right bottom: Eurofarma’s filgrastim 058/10 (blue) and Granulokine batch B2010B01 (red). Abbreviation: SE-HPLC, size-exclusion high-performance liquid chromatography. |
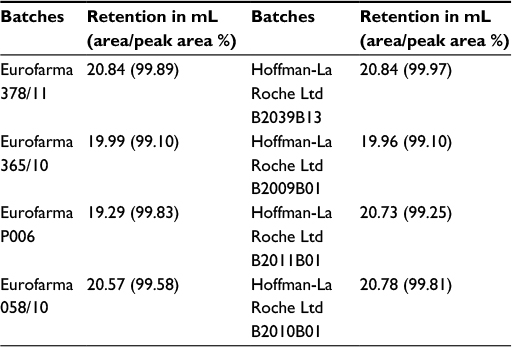 | Table 4 Retention of the peaks from SE-HPLC and their area percentage Abbreviation: SE-HPLC, size-exclusion high-performance liquid chromatography. |
Differences in the excipient peak are more pronounced in the comparison of a Eurofarma’s drug substance P006, which is nonformulated, and Granulokine B2011B01, which is formulated, as expected. In the integration shown in Table 4, peaks from excipients were not considered to calculate purity (area/peak area%). The mean retention of the main peaks in Eurofarma’s samples was 20.17±0.69 mL and for Hoffman-La Roche Ltd was 20.58±0.41 mL. Purity of the peaks was >99% for both products.
An enzyme-linked immunosorbent assay was used to assess host cell proteins (HCPs) in batches of both products, and real-time polymerase chain reaction was used to assess contaminant DNA. Both methods were validated as methods for quantification, following Brazilian and international regulations. HCD and HCP tested in different batches were always below the specifications; 100 pg/mL for contaminant DNA and <60 ng/100 µg of filgrastim for HCP. No significant difference was detected among the products for these process-related impurities (data not shown).
Biological activity
Determination of biological activity was performed as described in the EP and was within the expected range.6 Twenty batches of Eurofarma’s filgrastim and five of Hoffman-La Roche Ltd were compared in bioassays to the NIBSC standard. Figure 12 presents the potency of the 25 batches used in the comparison exercise. The specification is 100 MIU/mg of filgrastim based on the EP monograph 2206. Although the specification of the Pharmacopeia6 is directed to the drug substance, the same criteria was used for the drug product, considering that the estimated potency is not <80% and not >125% of the stated potency.
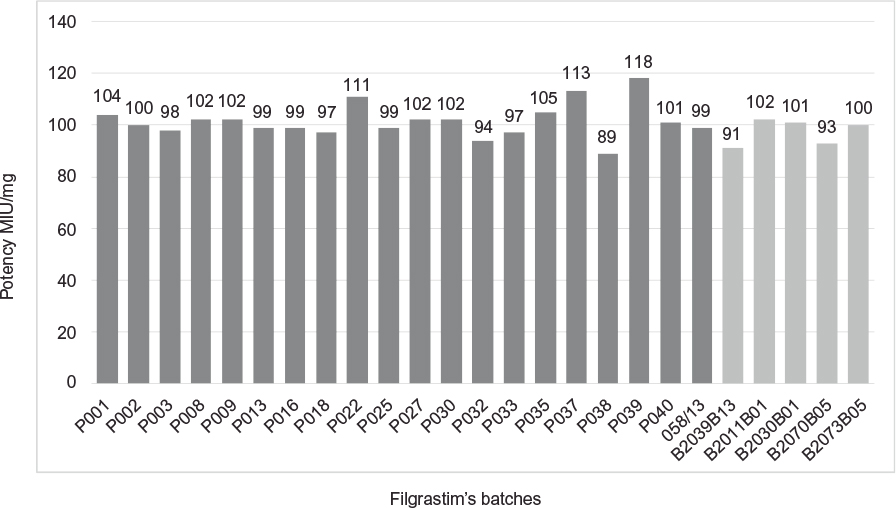 | Figure 12 Comparative potency: Eurofarma’s batches in dark gray and Hoffman-La Roche Ltd batches in light gray. |
All potency results of filgrastim from Eurofarma or Hoffman-La Roche Ltd complied with the specification. The mean potency of the 20 batches from Eurofarma was 101.6±6.5 MUI/mg and from Hoffman-La Roche Ltd was 97.4±5.0 MUI/mg of protein. The bioassay used to approve filgrastim’s batches can also be considered as an assessment of the right tertiary conformation of the protein, since it has to bind to its receptor in order to be effective.
Stress studies
The stability of a Fiprima batch produced in October 2011 and of a Granulokine batch produced in November 2011 was evaluated under stress conditions. Both products were subjected to intense agitation by vortexing for 2 minutes and to high- and low-temperature shocks for 12 hours. The thermostability study using CD spectra that analyzed samples under different temperatures was used to guide the temperatures used for this comparative stress exercise. Before and after stress, samples were analyzed by RP-HPLC, SE-HPLC, Western blot, pH, and in vitro bioassay for activity. The behavior of both Eurofarma’s filgrastim and the reference product was very similar. Being submitted for 12 hours to 0°C or 37°C did not significantly affect any of the products. Nevertheless, neither product passed acceptance criteria after intense agitation or storage at −20°C or 56°C for 12 hours.
After intense agitation, both products presented an increase in an impurity peak migrating before the principal peak. SE-HPLC analysis reproved both products because an impurity approaching 20% of the principal peak was observed after intense agitation. This impurity represents an isomer of filgrastim as determined by mass spectrometry (data not shown) and is expected under this type of stress condition. Nevertheless, when assessed by RP-HPLC, both products did not show an increase in impurity enough to reprove either of them.
The zoom of SE-HPLC chromatograms in Figure 13 showed the impurity generated in the Eurofarma batch after intense agitation migrating at the same position (18.6 mL) and in the same proportion (~20%) as the impurity generated in the Hoffman-La Roche Ltd batch under the same circumstances.
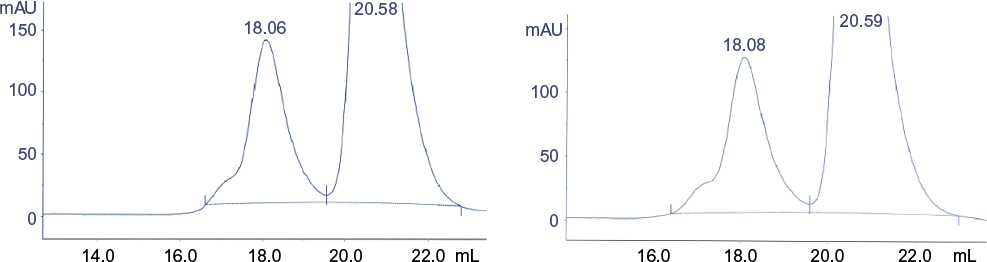 | Figure 13 Zoom of SE-HPLC after intense agitation of filgrastim. Notes: Left: Eurofarma’s batch 378/11; right: Hoffman-La Roche Ltd batch B2039B13. Abbreviation: SE-HPLC, size-exclusion high-performance liquid chromatography. |
After storage at −20°C for 12 hours, both products were reproved for their content of filgrastim (531 µg/mL and 522 µg/mL for Eurofarma’s and Hoffman-La Roche Ltd products, respectively). However, the potency of both products was acceptable by in vitro bioassay when the informed content was used in the bioactivity calculation, meaning that although the product has lost content, the remaining protein was fully active. No pH alteration was observed in any case.
Both products were approved after being maintained at either 0°C or 37°C for 12 hours. These samples were returned to the regular storage condition (2°C–8°C) and were reevaluated 1 year later and at the end of their expiration date. All samples of both products passed the acceptance criteria in all the analytical tests performed then. Both products behaved exactly the same way under different stress conditions.
Taken together, these results point to extensive similarity between Fiprima and Granulokine in terms of the stability of the drug product even under several stress conditions. In Table 5, the content, impurities, and bioactivity of the two products are compared before and after being exposed to 0°C and 37°C for 12 hours. The observed oscillation of the results is due to the methods inherent variability and is seen for both products consistently.
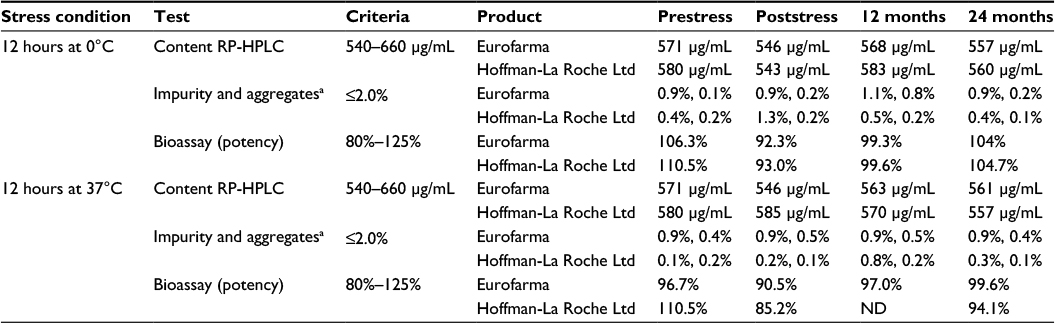 | Table 5 Products behavior after being submitted to different stress conditions Notes: aImpurities were evaluated by RP-HPLC (the first result presented in the cell) and aggregates by SE-HPLC (the second result presented in the cell). Abbreviations: RP-HPLC, reverse-phase high-performance liquid chromatography; SE-HPLC, size-exclusion high-performance liquid chromatography; ND, not determined. |
Conclusion
The data presented here strongly suggested that Eurofarma’s filgrastim is highly similar to the reference product Granulokine in terms of identity, structure, purity, stability, and bioactivity. State-of-the-art analytical approach performed in a comparative manner using different batches of Fiprima and Granulokine showed similar or identical profiles. Batch-to-batch variability inevitably exists even for the reference product. Therefore, using different batches is mandatory for the comparability exercise. At least three batches of each product were used to assess quality attributes including primary structure, higher order structures, mass, size, and identity. A higher number of batches were used in the comparison related to attributes that might vary in a batch-to-batch basis such as content, hydrophobicity, charge, purity, and biological activity.
The primary protein structure of Eurofarma’s and Hoffman-La Roche Ltd filgrastim was demonstrated to be identical, as confirmed by N-terminal sequencing and peptide mapping tandem to mass spectrometry. An array of analytical methods with different principles of operation including far and near-UV CD, fluorescence, and X-ray crystallography were used to compare higher order structure and confirmed strong similarity among all tested samples. Protein mass, size, and identity were also compared by different analytical tests and showed no difference among the products. Analytical tests used to approve the drug substance, as described by EP, and tests used to approve the drug product, as stated at the certificate of analysis of the reference product, were conducted comparatively in a number of batches.6 Stress conditions to which both products were submitted did not show any significant difference in their behavior. All tests pointed to the high similarity of the product even considering the putative batch-to-batch variability.
Head-to-head comparative studies between Eurofarma’s filgrastim and the reference product showed no detectable or significant differences even using an orthogonal approach. Based on the published guides from Brazilian, European, and the US regulatory agencies, this comparative exercise substantiates the similar nature of the products and strengthens the scientific justification for reducing the extent of nonclinical and clinical data package.3,4,13,14 An example of a biosimilar approval with reduced clinical package is presented by Sandoz’s filgrastim, Zarzio.18 Zarzio was compared to Neupogen and established similarity with the reference product at physicochemical, biological, and nonclinical level. Sandoz’s clinical program consisted of PK/PD studies with healthy volunteers and a single-arm Phase III study.19 Eurofarma performed stand-alone toxicological tests in animals. This decision was based on four main reasons: 1) the absence of significant toxicity described for the reference product; 2) existing knowledge of the clinical safety of the reference product present in the market for >20 years; 3) the desire to reduce animal usage; and 4) clinical safety in humans was planned in a comparative study and would result in more meaningful data for toxicity assessment. Indeed, stand-alone toxicological tests did not demonstrate significant toxicity or show any adverse effect that has not already been described to the reference product. Sacrificing more animals in order to obtain data on the toxicity of the reference product would not result in additional knowledge in terms of safety of the developing product. All other nonclinical and clinical tests were performed in a head-to-head comparative model, including PK/PD tests both in animal and in human volunteers, immunogenicity, and Phase III clinical trial. All nonclinical and clinical data demonstrated high biosimilarity. Data on comparative animal PK/PD, human clinical trials, and multivariate/multiparametric statistical analysis encompassing the whole comparability exercise will be published. Altogether, there is strong evidence to attest to the biosimilarity of Eurofarma’s filgrastim and the reference product.
Other companies have published physicochemical and biological comparative studies assessing biosimilarity of biosimilar products that have been approved in Europe and in the US.18,20 The same principles used for establishing comparability of originator biologics after changes in manufacturing are used for establishing biosimilarity. Biosimilarity assessment starts with routine quality control testing against existing specifications including primary structure and higher order structure comparison. The behavior of proteins under stress conditions also plays an important role in demonstrating comparable stability. The use of orthogonal methods to evaluate proteins’ attributes ensures consistency of the comparability exercise.2 The demonstration of biosimilarity between Fiprima and Granulokine is a conclusion based on scientific data. This is the first biosimilar product developed by a Brazilian company, and actually, the first in South America. There are other biologicals already in the market that have been developed by South American companies, but none of them has used a comparative study that allowed the product to claim for biosimilarity. Fiprima has been approved by ANVISA as the first Brazilian biosimilar in 2015 and will certainly affect the Brazilian government’s health costs and will increase the population’s therapeutic options.
Acknowledgments
Eric Sasso, Leandro Pacheco, Claudio Saes Jr, Gabriel Feliciano, João Oliveira, Thiago Oliveira Santos e Silva, Kátia Souza, Maria Noélia Silva, Lauren Camargo, José Rafael da Silveira, Diego Souza, Edinaldo Oliveira, Elenilse Moura, Vinicius Oliveira, Carlos Silverio, Fernanda Perez, and Miriam Malto are team members who contributed to the development of the biosimilar Fiprima. This work was supported by FINEP (contracts 02.06.0158.00 and 01.07.0076.00).
Disclosure
The authors report no conflicts of interest in this work.
References
Gravel P, Naik A, Le Cotonnec J-Y. Biosimlar rhG-CSFs: how similar are they? Target Oncol. 2012;7(suppl 1):S3–S16. | ||
Federici M, Lubiniecki A, Manikwar P, Volkin DB. Analytical lessons learned from selected therapeutic protein drug comparability studies. Biologicals. 2013;41(3):131–147. | ||
European Medicines Agency. Guidelines on Similar Biological Medicinal Products Containing Biotechnology-Derived Proteins as Active Substance: Quality Issues. London: European Medicines Agency; 2014. | ||
European Medicines Agency. Guidelines on Similar Biological Medicinal Products Containing Biotechnology-Derived Proteins as Active Substance: Non-Clinical and Clinical Issues. London: European Medicines Agency; 2013. | ||
Kelly C, Mir F. Economics of biological therapies. BMJ. 2009;339:b3276. | ||
European Directorate for the Quality of Medicines. Filgrastim concentrated solution (2206). Eur Pharmacopeia. 2009;6(3):4142–4144. | ||
Agência de Vigilância Sanitária [webpage on the Internet]. Guia para validação de métodos analíticos e bioanalíticos. RE nº 899 published in May 29, Brasília, 2003. Available from: http://portal.anvisa.gov.br/wps/wcm/connect/4983b0004745975da005f43fbc4c6735/RE_899_2003_Determina+a+publica%C3%A7%C3%A3o+do+Guia+para+valida%C3%A7%C3%A3o+de+m%C3%A9todos+anal%C3%ADticos+e+bioanal%C3%ADticos.pdf?MOD=AJPERES. Accessed May 4, 2016. | ||
International Conference on Harmonisation of Technical Requirements for Registration of Pharmaceuticals for Human Use [webpage on the Internet]. Validation of Analytical Procedures: Text and Methodology – Q2(R1). Parent guideline published in October 27, 1994, revised in 2005. Available from: http://www.ich.org/fileadmin/Public_Web_Site/ICH_Products/Guidelines/Quality/Q2_R1/Step4/Q2_R1__Guideline.pdf. Accessed May 4, 2016. | ||
Sreerama N, Woody RW. Estimation of protein secondary structure from circular dichroism spectra: comparison of CONTIN, SELCON, and CDSSTR methods with and expanded reference set. Anal Biochem. 2000;287(2):252–260. | ||
Sreerama N, Venyaminov SY, Woody RW. Analysis of protein circular dichroism spectra based on the tertiary structure classification. Anal Biochem. 2001;299(2):271–274. | ||
Kabsch W. Automatic processing of rotation diffraction data from crystals of initially unknown symmetry and cell constants. J Appl Crystallogr. 1993;26(6):795–800. | ||
Adams PD, Grosse-Kunstleve RW, Hung L-W, et al. PHENIX: building new software for automated crystallographic structure determination. Acta Crystallogr D Biol Crystallogr. 2002;58(Pt 11):1948–1954. | ||
Agência de Vigilância Sanitária. Guia para Realização do Exercício de Comparabilidade para Registro de Produtos Biológicos. Brasilia: Agência de Vigilância Sanitária; 2011. | ||
US Food and Drug Administration. Scientific Considerations in Demonstrating Biosimilarity to a Reference Product. Rockville, MD: US Food and Drug Administration; 2015. | ||
Hill CP, Osslundt TD, Eisenberg D. The structure of granulocyte-colony-stimulating factor and its relationship to other growth factors. Proc Natl Acad Sci USA. 1993;90(11):5167–5171. | ||
Greenfield NJ. Using circular dichroism collected as a function of temperature to determine the thermodynamics of protein unfolding and binding interactions. Nat Protoc. 2006;1(6):2527–2535. | ||
Ladoklhin AS. Fluorescence spectroscopy in peptide and protein analysis. In: Meyers RA, editor. Encyclopedia of Analytical Chemistry. Chichester: John Wiley & Sons Ltd; 2000:5762–5779. | ||
Sörgel F, Lerch H, Lauber T. Physicochemical and biological comparability of a biosimilar granulocyte colony-stimulating factor with its reference product. BioDrugs. 2010;24(6):347–357. | ||
Berghout A. Clinical programs in the development of similar biotherapeutic products: rationale and general principles. Biologicals. 2011;39(5):293–296. | ||
Skrlin A, Radic I, Vuletic M, et al. Comparison of the physicochemical properties of a biosimilar filgrastim with those of reference filgrastim. Biologicals. 2010;38(5):557–566. |
 © 2016 The Author(s). This work is published and licensed by Dove Medical Press Limited. The
full terms of this license are available at https://www.dovepress.com/terms
and incorporate the Creative Commons Attribution
- Non Commercial (unported, 3.0) License.
By accessing the work you hereby accept the Terms. Non-commercial uses of the work are permitted
without any further permission from Dove Medical Press Limited, provided the work is properly
attributed. For permission for commercial use of this work, please see paragraphs 4.2 and 5 of our Terms.
© 2016 The Author(s). This work is published and licensed by Dove Medical Press Limited. The
full terms of this license are available at https://www.dovepress.com/terms
and incorporate the Creative Commons Attribution
- Non Commercial (unported, 3.0) License.
By accessing the work you hereby accept the Terms. Non-commercial uses of the work are permitted
without any further permission from Dove Medical Press Limited, provided the work is properly
attributed. For permission for commercial use of this work, please see paragraphs 4.2 and 5 of our Terms.