Back to Journals » Clinical and Experimental Gastroenterology » Volume 14
Phosphomannose Isomerase High Expression Associated with Better Prognosis in Pancreatic Ductal Adenocarcinoma
Authors Alipour Z, Agostini-Vulaj D ![]() , Findeis-Hosey J, Liu L, Gonzalez RS, Drage MG, Krigman H, Zhou Z
, Findeis-Hosey J, Liu L, Gonzalez RS, Drage MG, Krigman H, Zhou Z ![]()
Received 30 April 2021
Accepted for publication 1 July 2021
Published 1 September 2021 Volume 2021:14 Pages 353—360
DOI https://doi.org/10.2147/CEG.S316492
Checked for plagiarism Yes
Review by Single anonymous peer review
Peer reviewer comments 2
Editor who approved publication: Professor Wing-Kin Syn
Zahra Alipour,1 Diana Agostini-Vulaj,2 Jennifer Findeis-Hosey,2 Lei Liu,3 Raul S Gonzalez,4 Michael G Drage,2 Hannah Krigman,1 Zhongren Zhou5
1Department of Pathology and Immunology, Washington University, St Louis, MO, 63110, USA; 2Department of Pathology and Laboratory Medicine, University of Rochester, Rochester, NY, 14642, USA; 3Division of Biostatistics, Washington University, St Louis, MO, 63110, USA; 4Department of Pathology, Beth Israel Deaconess Medical Center, Harvard Medical School, Boston, MA, 02215, USA; 5Department of Pathology and Laboratory Medicine, Robert Wood Johnson Medical School, Rutgers University, New Brunswick, NJ, 08901, USA
Correspondence: Zhongren Zhou
Chief of Gastrointestinal Pathology, Department of Pathology and Laboratory Medicine, Robert Wood Johnson Medical School, Rutgers University, 125 Paterson Street, New Brunswick, NJ, 08903, USA
Tel +1 732-667-0497
Fax +1 732-235-8124
Email [email protected]
Introduction: Pancreatic ductal adenocarcinoma (PDAC) is the fourth leading cause of cancer-related death in the United States. The need for increased patient survival has not been met for PDAC. The addition of mannose to conventional chemotherapy leads to accumulation of mannose metabolite in cancer cells and increases subsequent cell death. This susceptibility to mannose depends on the levels of phosphomannose isomerase (PMI). The cancer cells with lower levels of PMI are more sensitive to mannose than cells with higher levels. In this study, we investigated the association of PMI expression with clinical and pathological features of PDAC cases.
Methods: PMI antibody immunohistochemistry (AbCam) was performed on tissue microarrays from 235 PDAC by a standard protocol on Ventana automated immunostainer. The PMI intensity was graded (0– 3) and the proportion of positivity was scored. Correlation of PMI expression with staging and survival was analyzed.
Results: Of the 235 cases, 51.5% (n=121) cases demonstrated grade 2 intensity with 90.1% of these (n=109) showing positivity in ≥ 70% of tumor cells. Ninety-eight (41.7%) cases exhibited grade 3 intensity with 94.9% (n=93) of these cases showing ≥ 70% reactivity. Sixteen cases (6.8%) were nonreactive (intensity grade 0– 1). Intensity of PMI expression was associated with significantly better prognosis as assessed by median survival in months (M): grade 0– 1 intensity group: 11.2 M; grade 2 intensity group: 25.2 M; and grade 3 intensity group: 33.2 M (p=0.03). A minority (6.8%) of PDACs show non-high PMI expression with poorer prognosis.
Discussion: Mannose may be a particularly useful adjunct with chemotherapy to treat this aggressive subgroup. PMI expression is also a potential biomarker to predict the prognosis of PDAC.
Keywords: pancreatic ductal adenocarcinoma, phosphomannose isomerase, PMI, immunohistochemistry, overall survival, gene expression
Introduction
Pancreatic ductal adenocarcinoma (PDAC) is the fourth leading cause of cancer-related deaths and its incidence and death rates still rises by age and sex in the United States.1 The combined survival rate for all stages of pancreatic carcinoma (9%) is lower than many other malignancies such as liver (18%), esophagus (19%), and lung (19%)1 which underscores an unmet need for improving patients’ survival in PDAC.
The addition of sugar to conventional chemotherapy can alter the malignant cellular metabolism2 because many cancers demonstrate enhanced glucose uptake.3,4 Mannose, imported into malignant cells by sharing the same transporters with glucose,4 leads to accumulation of mannose metabolite, mannose-6-phosphate, in cancer cells, that negates anti-apoptotic proteins of Bcl2 family and significantly increases subsequent cell death.3 Some authors contend that the accumulation of phosphorylated metabolite impairs the shared metabolic pathways of glucose, including glycolysis, tricarboxylic acid cycle and the pentose phosphate pathway in vivo.3 Liquid chromatography and mass spectrometry analyses have failed to establish the levels of the phosphorylated metabolites of mannose correlation with mannose sensitivity in mannose-sensitive versus mannose-insensitive tumors.3
Susceptibility to mannose depends on the levels of phosphomannose isomerase (PMI) that catalyzes the reciprocation of mannose-6-phosphate and fructose-6-phosphate;,5 and its level varies in human tumors. Although the role of PMI activity in normal versus malignant tissues was first discussed in 1960s,6 only recently have studies focused on its application against various tumor types.3,4 Cancer cells with lower levels of PMI are more sensitive to mannose utilization than cells with higher levels. In addition to the role of PMI, a recent study has suggested the direct effect of mannose in the induction of regulatory T cells and suppressing immunopathology.7 One study found that the level of hexose-6P in osteosarcoma cells with low levels of PMI significantly increased after mannose treatment while normal human osteoblasts demonstrated no such increase. Based upon these results, the authors proposed treating osteosarcoma cells and normal human osteoblasts with mannose as a stimulant, which greatly promotes the metabolic discrimination of osteosarcoma cells and the early diagnosis of cancer.8
In this study, we aimed to investigate the association of PMI expression with clinical and pathological features of PDAC cases.
Materials and Methods
Patients for Tissue Microarrays
All PDAC tissue samples for the tissue microarray construction were collected from 235 patients with PDAC in Strong Memorial Hospital/University of Rochester, New York, between 1997 and 2005. Only twelve of 235 cases had chemotherapy before the operation, 223 were treated with chemotherapy/radiotherapy after the operation. The follow-up period following chemotherapy/radiotherapy ranged from 0 to 124 months with a mean of 22 months. The patients’ information including clinical history, demography and follow-up prognosis was extracted from medical records. The studies were approved by University of Rochester RSRB office.
Construction of Tissue Microarray
Tissue microarrays, comprising 235 cases of PDAC, were constructed from the representative areas of formalin-fixed specimens collected from 1997 to 2005 at the Department of Pathology, Strong Memorial Hospital/University of Rochester, New York. At least 3 cores from each tumor were added to TMA. Four-micron sections were cut from the tissue microarray samples and stained with H&E for confirmation of the existence of the expected pathology within each tissue core. Further sections also were cut for immunohistochemistry. In case of dislodged tissue cores from the slides during processing, the patient was excluded from the study.
Immunohistochemistry
Immunohistochemistry (IHC) was carried out in the Anatomic and Molecular Pathology (AMP) Core Lab, Department of Pathology & Immunology, Washington University School of Medicine in St. Louis with IRB approval. IHC was performed by a standard protocol on Ventana automated immunostainer (Ventana Medical Systems, Tucson, AZ, USA). Antigen retrieval for anti-Mannose phosphate isomerase antibody (rabbit monoclonal, clone EPR10234, AbCam) was performed with CC2 buffer (Cell Conditioning 2; citrate-based buffer pH 6.0, Ventana Medical System) for 68 min at 95 degrees. Sections incubated with primary antibodies for 40 min at 37 degrees. Biotin-free multimer technology system, based on direct linkers between peroxidase and secondary antibodies (ultraView Universal DAB Detection Kit, Ventana Medical System) was used as detection kit. The PMI staining was validated by Z.Z. and Z.A.
Immunohistochemistry Scoring
All sections were independently reviewed by Z.Z. and Z.A., who were blinded to all clinical and pathologic information. Conflicting results were reviewed by both Z.Z. and Z.A. before a final consensus was reached. The PMI intensity was graded 0–3 as a standard score system: 0 was defined as no stain in all cells; 1 was defined as a weak cytoplasmic staining in ≥10% of the tumor cells; 2 was defined as a moderate cytoplasmic staining in ≥10% of the cells; and 3 was defined as a strong cytoplasmic staining in ≥10% of the cells. Also, the proportion of tumor positivity was accordingly scored. Cases with intensity grade of 0 and 1 were defined as negative or non-high PMI expression; 2 and 3 as positive or high PMI expression.
Statistical Analysis
Summary data are represented as the means (±SD) for continuous data, and N (%) for binary and categorical data. All statistical tests were two-sided unless otherwise stated. P values <0.05 were considered statistically significant. To assess the associations between the clinicopathologic/prognostic characteristics and PMI intensity, Student’s t-test (for continuous variables) and Fisher’s exact test (for binary/categorical variables) were utilized as appropriate. A Kaplan-Meier survival estimator with a log rank test was used to compare the patients’ survival rates between the PMI high- and low-intensity groups. PMI-related hazard ratio was studied with Cox proportional hazards model. Statistical analyses were performed using SAS v. 9.3 (SAS Institute Inc., Cary, NC).
Results
High Expression of PMI in PDAC
As expected, PMI expression is predominantly located in the cytoplasm (Figure 1). PMI was highly expressed in 93.2% (n=219; intensity grade 2 and 3) PDAC cases. One hundred sixteen of 219 cases (49.3%) cases demonstrated grade 2 intensity with 90.5% (n=105) showing ≥70 positivity; 95 (40.4%) cases exhibited grade 3 intensity with 95.8% (n=91) showing >70% reactivity. Sixteen cases (6.8%) were non-high expression (intensity grade 0–1).
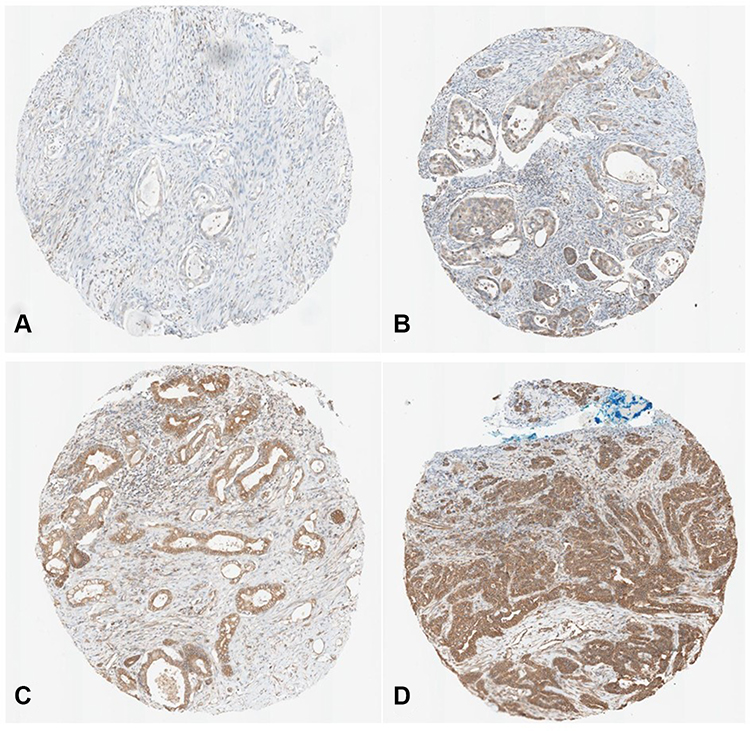 |
Figure 1 PMI expression in various levels in PDAC surgical tissue microarray. (A) Intensity 0; (B) Intensity 1; (C) Intensity 2; (D) Intensity 3. |
Survival Rate in PDAC Cases
The effect of PMI expression on the survival rates of the patients with PDAC was compared by Log rank test. The mean survival time in the PMI high expression group, determined by immunostaining, was 45.52±8.17 months. The PMI non-high expression group had a mean survival time of 21.77±4.8 months. The Log rank test indicated that the survival time for the PMI high expression group was statistically longer compared with the PMI non-high expression group (p = 0.03, Figure 2A). The mean disease-free survival time in the PMI high expression group was 38.9±2.77 months. The PMI non-high expression group had a mean disease-free survival time of 13.2±8.17 months. The Log rank test indicated that the survival time for the PMI high expression group was statistically longer compared with the PMI non-high expression group (p = 0.01, Figure 3A). Next, we calculate the hazard ratio of PMI in Cox models for death and disease-free survival, respectively. For death, HR=0.52 (95% CI: 0.28–0.94). For disease free survival, HR=0.42 (95% CI: 0.21–0.85). Therefore, PMI is significant for both death and disease-free survival of PDAC patients.
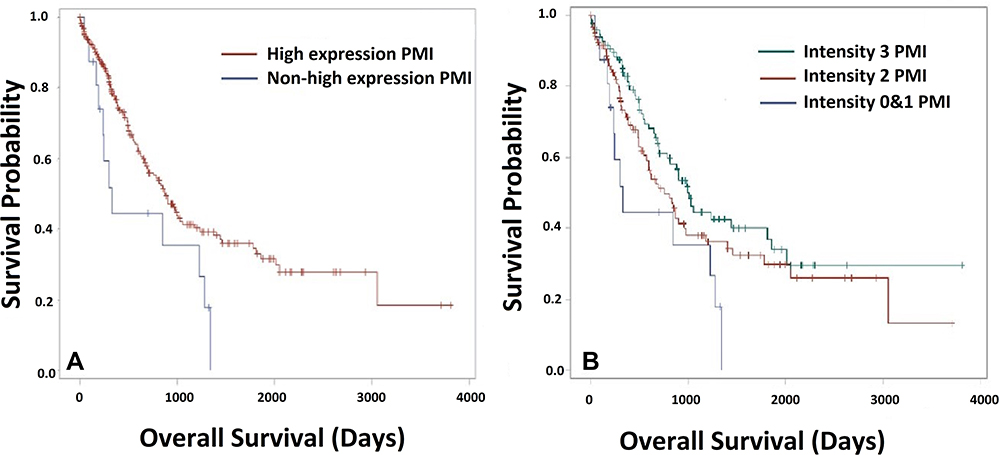 |
Figure 2 Overall survival of PDAC patients with various PMI expression. (A) Overall survival between PMI high expression (intensity 2 and 3) and non-high expression group (intensity 0 and 1) (Kaplan-Meier curve). The result emphasizes that PMI high expression is significantly associated with improved survival (p=0.03). (B) Overall survival among 3-level PMI intensity including non-high-expression PMI group (intensity 0 and 1), moderate expression of PMI (intensity 2) and high expression PMI (intensity 3). Kaplan-Meier curve analysis revealed a direct significant correlation (p=0.03). |
 |
Figure 3 Disease free survival of PDAC patients with various PMI expression. (A) Disease free survival between PMI high-expression (intensity 2 and 3) and non-high expression groups (intensity 0 and 1) (Kaplan-Meier curve). Kaplan-Meier analysis also suggested that PMI high expression group was significantly correlated with lower rate of recurrence (p=0.01). (B) Disease free survival among 3 PMI intensity groups including non-high-expression PMI group (intensity 0 and 1), moderate expression of PMI (intensity 2) and high expression PMI (intensity 3. Kaplan-Meier curve analysis revealed a direct significant correlation (p=0.04). |
In addition to the dichotomized approach, application of three levels of PMI scores (intensity: group 1: 0 and 1, group 2: 2, group 3: 3) revealed the significant difference of the overall survival of PDAC patients with 3 PMI levels (p=0.03; Figure 2B). The median survivals in months (M) were 11.2 M in Grade 0–1 intensity group, 25.2 M in grade 2 intensity group, and 33.2 M in grade 3 intensity group (p=0.03). The Cox regression model was unable to highlight any difference between level 0 and 1 vs level 2 and, likewise, between level 2 vs level 3, although the level 0 and 1 vs level 3 was significant (p=0.01) that presumably explains the significance of PMI levels affecting survival (Figure 2B). Disease-free survival analysis was repeated on the three level PMI approach for the PDAC patients. The analysis revealed a direct significant correlation of the disease-free survival (p=0.04, Figure 3B) with PMI levels. In the Cox regression models, there was no significant difference to compare level 2 vs level 3; while both level 0 and 1 vs level 2 as well as level 0 and 1 vs level 3 expressed statistical significance (p=0.02).
Association of High PMI Expression with Clinicopathologic Characteristics of PDAC
The association of PMI high expression with the clinicopathologic features in PDAC was analyzed. In contrast to the significant association between the survival time/disease-free survival and PMI high expression previously described (p=0.03 and p=0.01), none of the other clinicopathologic characteristics, including age, sex, TNM staging or differentiation, were significantly associated with PMI high expression (Table 1).
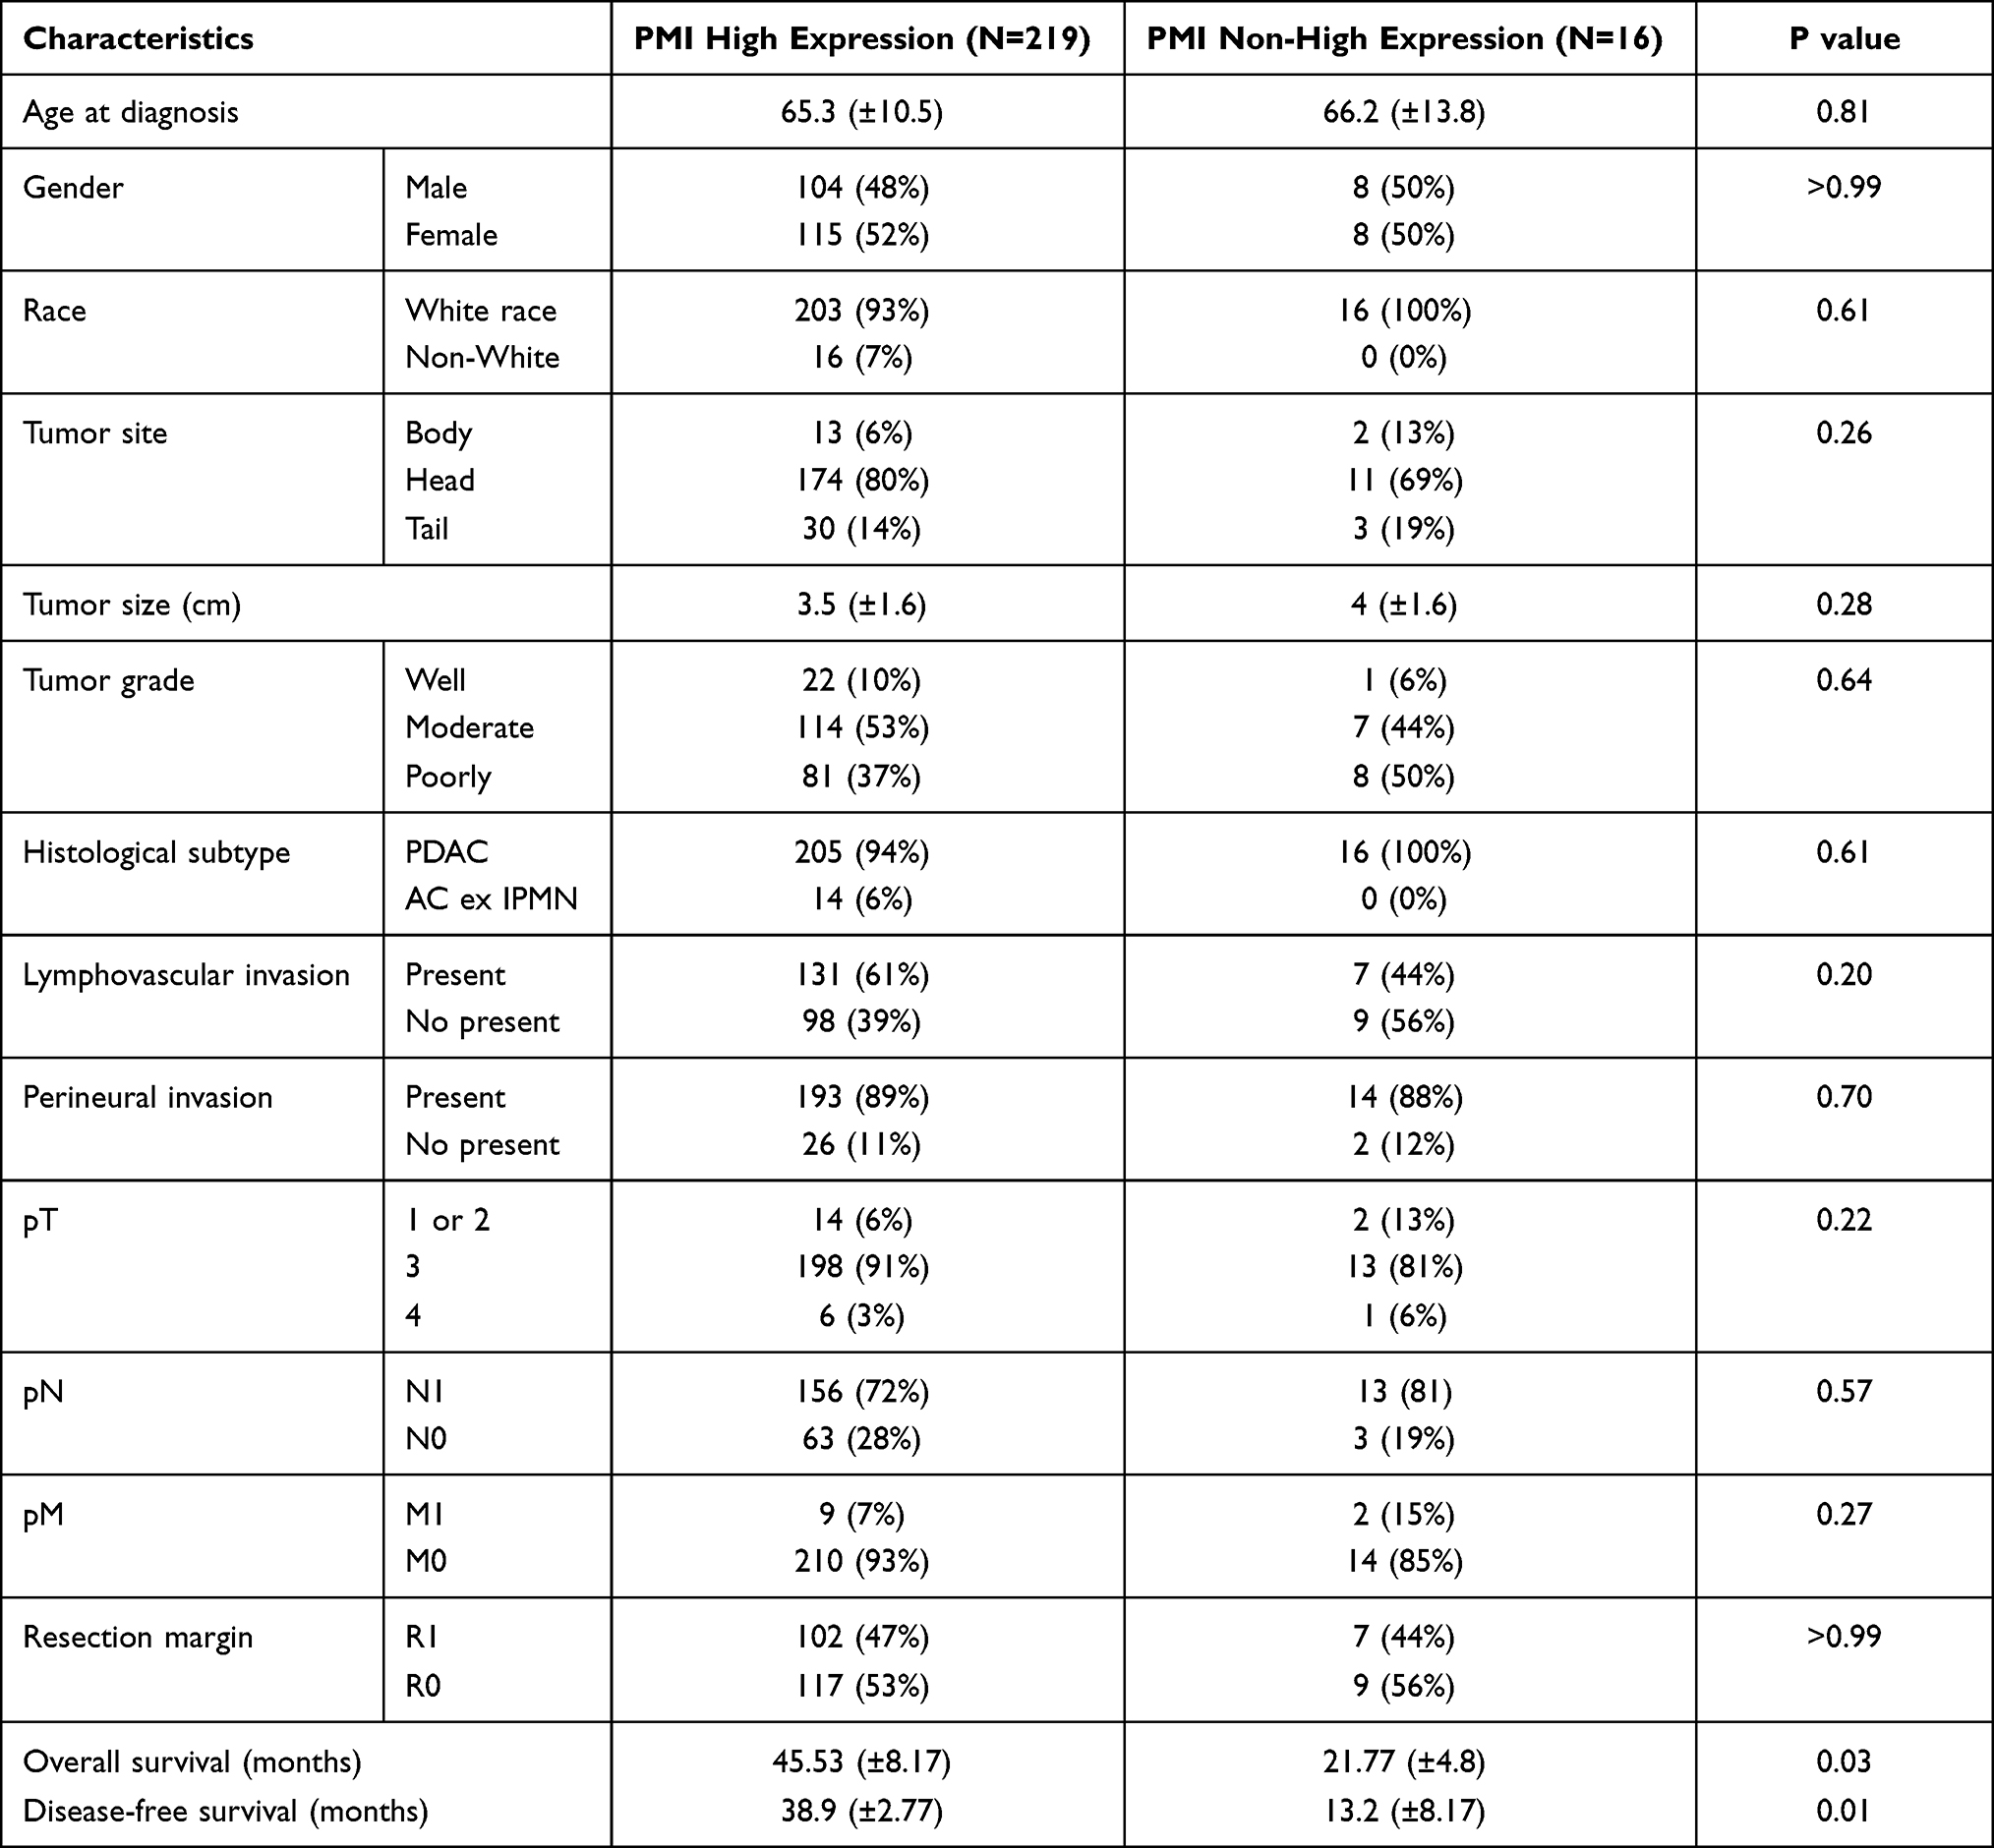 |
Table 1 Clinicopathologic Characteristics and Their Association with PMI Intensity |
Association Between Treatment and Overall Survival in PMI High-Expression Patients
First, we analyzed the overall survival of PDAC patients with both adjuvant chemotherapy and/or radiotherapy compared with non-treatment. There is a strongly significant difference of the overall survival of PDAC patients between both adjuvant chemotherapy and/or radiotherapy compared with non-treatment (p < 0.0001). Cox analysis showed the hazard ratio 0.147 in chemotherapy patients and 0.142 in combined chemotherapy with radiotherapy.
We further compared the overall survival with or without high-expression level of PMI in various treatment methods including adjuvant chemotherapy, adjuvant chemotherapy plus radiotherapy and neoadjuvant chemotherapy. In chemotherapy patients, high-expression PMI group showed shorter overall survival compared with non-high-expression group but did not show statistical significance (mean: 18.42 vs 25.61 months; median: 18.41 vs 25.51 months; p = 0.107). However, in chemotherapy plus radiotherapy patients, high-expression PMI groups showed longer overall survival compared with non-high-expression group, but it was not significant too (mean: 30.68 vs 15.87 months; median: 22.61 vs 9.26 months; p = 0.093). In the neoadjuvant chemotherapy group (11 cases), PMI high-expression patients did not show a significant change of overall survival compared to PMI non-high-expression. No statistically significant change may be due to small sample numbers in non-high expression group.
Discussion
It is well established that cancer cell expansion depends on glucose metabolism for cell division (3); however, mannose can impair glucose metabolism by accumulation as mannose-6-phosphate in cells and causing growth deceleration in some tumor types.3 The tumor cell sensitivity to mannose is inversely proportional to the PMI levels, the enzyme converting mannose-6-phosphate to fructose-6-phosphate.3 Total loss of PMI by knockout of MPI, the encoding gene for PMI induced p53 activation and caused apoptosis in zebrafish embryo, mouse liver cancer cells and human osteosarcoma cancer cells (Shtraizent, DeRossi et al 2017). Based on aforementioned metabolic role of PMI, it is suggested in multiple studies that PMI depletion in PMI-rich tumors or adjunctant mannose therapy in PMI-deficient tumors could be a promising anticancer drug (Gonzalez, O’Prey et al 2018, Wei and Huang et al, 2020).
Gonzalez and colleagues stained tissue microarrays of ovarian, renal, breast, prostate and colorectal tumors with PMI antibody, which revealed that colorectal tumors have low PMI levels; therefore, making them sensitive to mannose (Gonzalez, O’Prey et al 2018). They, in addition, manifested that PMI levels vary among tumors from the same tissue as well as between tissues from different organs (Gonzalez, O’Prey et al 2018). Our study is the first study examining PMI expression in PDAC tissue and investigating the association of PMI level with survival rate and clinicopathologic features. We showed that most PDAC cases (93.2%) have a high expression of PMI, implying low sensitivity to mannose. However, one small group of PDAC cases (6.8%) had non-high expression of PMI, probably indicating high sensitivity to mannose. Actually, this non-high PMI expression cases showed significant short survival time (21.77 months) compared with the PMI high expression group (45.52 months; p = 0.03, Figure 2A), which implies that mannose could be a potential treatment for this group of patients. It is highly interesting to see whether the clinical trial with mannose plus chemotherapy could improve the survival in the non-high PMI expressing patients. Gonzalez and colleagues found that in tumor-bearing mice that when mannose is combined with chemotherapic agents, cisplatin or doxorubicin, cell apoptosis is intensified through Bcl2 family compared to cisplatin or doxorubicin alone (Gonzalez, O’Prey et al 2018). Moreover, Fan et al proved that combined methotrexate (MTX) and mannose in a nanoparticle complex displayed a better penetration of MTX with a remarked synergistic chemotherapeutic effects in tumor-bearing mice and consequently, lowering the drug dosage and decreasing the toxicity to normal tissues (Fan, Wang et al 2020). Combined mannose with chemotherapic agents related with PDAC treatment such as gemcitabine/nab paclitaxel or FOLFIRINOX could be a good regimen for the non-high PMI expressing PDAC patients.
Gonzalez and colleagues found that PMI levels did not have a significant association with cancer-specific survival in either breast cancers showing PMI expression or colon cancer exhibiting very low PMI expression (Gonzalez, O’Prey et al 2018). By contrast, our study of patients with pancreatic adenocarcinoma showed a significant association between higher survival rate and mean disease-free survival rate in group with high PMI expression, implying that PMI could be a potential biomarker to predict the PDAC prognosis. In addition, when some of the genetically engineered mice with colorectal cancer were provided with 20% mannose in drinking water, fewer tumors were significantly observed at the clinical end point, which confirmed that mannose promotes tumor growth retardation (Gonzalez, O’Prey et al 2018). Hence, patients with PDAC might benefit from adding mannose to conventional chemotherapy in both PMI-rich tumors by RNA-interference-mediated depletion of the enzyme and PMI-deficient tumors.
In other series, PMI knockdown amplified glioblastoma radiosensitivity and significantly reduce tumoral cell survival (Cazet et al, 2014). Our study has conflicting results. Among patients receiving chemotherapy alone, overall survival was shorter for the high-expression PMI group in comparison to the non-high-expression group (not statistically significant: mean: 18.42 vs 25.61 months; median: 18.41 vs 25.51 months; p = 0.107). For patients receiving both chemotherapy and radiotherapy patients, overall survival was longer for the high-expression PMI groups than for the non-high-expression group, again without statistical significance (mean: 30.68 vs 15.87 months; median: 22.61 vs 9.26 months; p = 0.093). This discordance may be from the small number of non-high expression cases in our studies.
Conclusion
Our series is among the first to report that small number of PDAC cases show minimal to no PMI expression and that non-high PMI expression PDAC patients showed significant lower overall survival and disease free survival comparing with high-expression patients. Based on previous study, combined mannose with chemotherapy should be clinically trialed to treat PDAC with non-high PMI expression. In addition, PMI expression could function as a prognostic factor for PDAC.
Abbreviation
PMI, phosphomannose isomerase; PDAC, pancreatic ductal adenocarcinoma; IHC, immunohistochemistry.
Acknowledgments
We want to thank for the help from Core Laboratory, Department of Pathology and Immunology, Washington University. We also thank the funding from Department of Pathology and Immunology, Washington University. The abstract of this paper was presented at the USCAP Conference name “Loss of Phosphomannose Isomerase Expression Associated with Worse Prognosis in Pancreatic Ductal Adenocarcinoma” as a poster presentation with interim findings. The poster’s abstract was published in “Poster Abstracts” in Modern Pathology.
Author Contributions
All authors made substantial contributions to conception and design, acquisition of data, or analysis and interpretation of data; took part in drafting the article or revising it critically for important intellectual content; agreed to submit to the current journal; gave final approval of the version to be published; and agree to be accountable for all aspects of the work.
Disclosure
Dr Lei Liu reports grants from Washington University, during the conduct of the study; personal fees from Mesoblast and Adial, outside the submitted work. The authors report no other conflicts of interest in this work.
References
1. Siegel RL, Miller KD, Jemal A. Cancer statistics, 2019. CA Cancer J Clin. 2019;69(1):7–34. doi:10.3322/caac.21551
2. Hanahan D, Weinberg RA. Hallmarks of cancer: the next generation. Cell. 2011;144(5):646–674. doi:10.1016/j.cell.2011.02.013
3. Gonzalez PS, O’Prey J, Cardaci S, et al. Mannose impairs tumour growth and enhances chemotherapy. Nature. 2018;563(7733):719–723. doi:10.1038/s41586-018-0729-3
4. Cairns RA, Harris IS, Mak TW. Regulation of cancer cell metabolism. Nat Rev Cancer. 2011;11(2):85–95. doi:10.1038/nrc2981
5. Sharma V, Smolin J, Nayak J, et al. Mannose alters gut microbiome, prevents diet-induced obesity, and improves host metabolism. Cell Rep. 2018;24(12):3087–3098. doi:10.1016/j.celrep.2018.08.064
6. Kizer DE, McCoy TA. Phosphomannose isomerase activity in a spectrum of normal and malignant rat tissues. Proc Soc Exp Biol Med. 1960;103:772–774. doi:10.3181/00379727-103-25665
7. Zhang D, Chia C, Jiao X, et al. D-mannose induces regulatory T cells and suppresses immunopathology. Nat Med. 2017;23(9):1036–1045. doi:10.1038/nm.4375
8. Fang Z, Wang R, Zhao H, Yao H, Ouyang J, Zhang X. Mannose promotes metabolic discrimination of osteosarcoma cells at single-cell level by mass spectrometry. Anal Chem. 2020;92(3):2690–2696. doi:10.1021/acs.analchem.9b04773
 © 2021 The Author(s). This work is published and licensed by Dove Medical Press Limited. The
full terms of this license are available at https://www.dovepress.com/terms
and incorporate the Creative Commons Attribution
- Non Commercial (unported, 3.0) License.
By accessing the work you hereby accept the Terms. Non-commercial uses of the work are permitted
without any further permission from Dove Medical Press Limited, provided the work is properly
attributed. For permission for commercial use of this work, please see paragraphs 4.2 and 5 of our Terms.
© 2021 The Author(s). This work is published and licensed by Dove Medical Press Limited. The
full terms of this license are available at https://www.dovepress.com/terms
and incorporate the Creative Commons Attribution
- Non Commercial (unported, 3.0) License.
By accessing the work you hereby accept the Terms. Non-commercial uses of the work are permitted
without any further permission from Dove Medical Press Limited, provided the work is properly
attributed. For permission for commercial use of this work, please see paragraphs 4.2 and 5 of our Terms.