Back to Journals » Journal of Blood Medicine » Volume 11
Phenotype Frequencies of Major Blood Group Systems (Rh, Kell, Kidd, Duffy, MNS, P, Lewis, and Lutheran) Among Blood Donors in the Eastern Region of Saudi Arabia
Authors Owaidah AY ![]() , Naffaa NM
, Naffaa NM ![]() , Alumran A
, Alumran A ![]() , Alzahrani F
, Alzahrani F ![]()
Received 1 November 2019
Accepted for publication 4 February 2020
Published 13 February 2020 Volume 2020:11 Pages 59—65
DOI https://doi.org/10.2147/JBM.S236834
Checked for plagiarism Yes
Review by Single anonymous peer review
Peer reviewer comments 4
Editor who approved publication: Dr Martin H Bluth
Amani Y Owaidah,1 Noor M Naffaa,1 Arwa Alumran,2 Faisal Alzahrani1
1Department of Clinical Laboratory Sciences, College of Applied Medical Sciences, Imam Abdulrahman Bin Faisal University, Dammam, Saudi Arabia; 2Department of Health Information Management and Technology, College of Public Health, Imam Abdulrahman Bin Faisal University, Dammam, Saudi Arabia
Correspondence: Amani Y Owaidah
Department of Clinical Laboratory Sciences, College of Applied Medical Sciences Imam Abdulrahman Bin Faisal University, P.O. Box 2435, Dammam 31441, Kingdom of Saudi Arabia
Tel +966-13-3331347
Fax +966-13-3330225
Email [email protected]
Introduction: The understanding of blood group phenotypes in Saudi Arabia is limited to the ABO and Rh blood groups. Data for the other major blood group phenotypes in different populations have been widely studied and used as a reference for identifying antigen-negative blood in hospital blood banks. Such information is crucial for facilitating the challenging task of providing antigen-negative blood for patients with multiple antibodies.
Objective: The aim of this study was to determine the frequency of the major blood group phenotypes in the Eastern region of Saudi Arabia and compare them to phenotypes in other populations.
Methods: A total of 100 volunteer Saudi donors were included in this study. Red blood cells from the donors were subjected to antigen typing of the major blood group systems (Rh, Kell, Kidd, Duffy, MNS, Lewis, Lutheran, and P) using the gel microtube technique.
Results: From the Rh blood group system, the e antigen was found in 97% of donors, followed by c at 86%. The Cellano (k) antigen of the Kell system was found in all donors, whereas the Kell (K) antigen was only found in 8 % of donors. The K+k- phenotype was not detected in our study. Unexpectedly, for the Duffy blood group system, the null phenotype Fy(a-b-) was found in 61% of donors. In the MNS blood group system, M+N-S+s+ was the most common phenotype at 24%.
Conclusion: The frequency of blood group phenotypes in the Eastern region of Saudi Arabia differs from that in other populations because of the diverse ethnic backgrounds of those living in that region. The findings of this study can be used to establish a local donor registry to help provide antigen-negative blood for patients with unexpected antibodies or to create an in-house antibody identification panel to add to the commercial panel that would be useful for confirming antibody identification results.
Keywords: alloimmunization, blood groups, phenotype frequencies, Saudi Arabia
Introduction
The main function of any blood bank is to provide safe and compatible blood or blood component units to patients in a timely manner.1 However, this goal may be challenging if patients have been identified with alloantibodies in the absence of a local database of donor phenotypes. The International Society of Blood Transfusion has identified 346 blood group antigens, 308 of which were classified into 36 blood group systems, and the remaining 38 antigens were clustered into collections, low-frequency series (700), high-frequency series (901) and collection series (200).2 Blood group phenotypes show varying distributions among different populations and ethnic groups, which has been reported in African, Caucasian, Chinese and Indian populations. However, reports of blood group phenotypes in Saudi Arabia are limited to the ABO and RhD blood group systems.3–7 No reports on the distribution of the various blood group phenotypes are available in the Eastern region of Saudi Arabia. Saudi Arabia is a large and multi-national country with a diverse ethnic background, particularly in the East and West because of its proximity to the sea, resulting in a long history of immigration.
The Eastern region of Saudi Arabia has a high prevalence of hemoglobinopathies compared to other regions in the kingdom, with 111.4 cases of Sickle Cell Disease (SCD) per 1000 individuals and 23.7 cases of Thalassemia per 1000 individuals for sickle cell disease.8 As a result, patients with haemoglobinopathies require multiple transfusions, which is a major part of their treatment regimen. Therefore, providing phenotypically matched packed red blood cells may be challenging in the absence of a local donor database.
The aim of this study was to determine the major blood group antigen frequencies in the eastern region of Saudi Arabia using the gel method and to provide a foundation for initiating development of a database for volunteer blood donors to enable antigen-negative blood to be provided to patients with alloantibodies. This will help to reduce phenotyping and crossmatching turnaround times and utilize blood bank resources in a cost-effective manner.
Materials and Methods
Sample Size and Inclusion Criteria
The sample size was calculated as described by Faul et al using G*Power3.1 software.9 Briefly, using G*Power 3.1 software, the sample size was estimated at 87 samples. This assumes a significant level of 5 % and power of 80%. This sample size can be used to detect a significant difference if the estimated prevalence (alternative) differs from the null value of 0.4290 by an amount of 0.15. In this study, the sample size was rounded up to 100 cases.
Donor Inclusion Criteria
All participants were Saudi volunteer blood donors fulfilling the national blood transfusion guidelines in Saudi Arabia, including age, medical history, and infection criteria.
Sample Collection and Preparation of Red Cell Suspension
A sample of 5 mL of EDTA-anticoagulated blood was drawn from each donor. Packed red cells from each donor were prepared. A 5 % suspension in ID-diluent-1 (Bromlin, DiaMed GmBH, Cressier, Switzerland) was prepared for antigen profiles I and II, and a 0.8% suspension in ID-diluent-2 (Low Ionic Strength Saline (LISS), DiaMed GmBH, Cressier, Switzerland) was prepared for antigen profile III.
Extended Red Cell Antigen Typing
For the Rh subgroups+K (C, c, E, e, and K), ID card antigen profile-I (P1, Lea, Leb, Lua, Lub) and ID-card antigen profile-II (k, Kpa, Kpb, Jka, Jkb), 5% of red cell suspension in ID-Diluent-1 (Bromlin) was used for phenotyping as per the manufacturer’s instructions (DiaMed GmBH). Briefly, 12.5 µL of the 5% red cell suspension was pipetted into all 6 microtubes containing specific test anti-sera. All cards were centrifuged for 10 min at 85 ×g using the ID-Centrifuge.
For ID card antigen profile-III (M, N, S, s, Fya, Fyb), a 0.8% red cell suspension was used for antigen typing as per the manufacturer’s instructions (DiaMed GmBH). Briefly, 50 µL of 0.8% of red cell suspension was pipetted into all 6 microtubes, and then 50 µL of ID-test sera were added to the corresponding microtubes. The ID-cards were incubated for 10 min at room temperature then centrifuged for 10 min at 85 ×g in the ID-Centrifuge.
Interpretation of Results
Positive
Agglutinated cells form a line on the surface of the microtube or diffuse throughout the gel. The results were graded from 4+ to 1+ depending on cell diffusion, indicating the presence of the corresponding antigen.
Negative
Accumulation of red cells as a compact button in the bottom of the microtube indicated the absence of the corresponding antigen.
Statistical Analysis
The Statistical Package for Social Sciences (SPSS for windows version 19. Armonk, NY, USA) was used to conduct a meta-analysis to compare the results from this study with other populations. All results were standardized to percentages. A binary logistic regression was used to find the odds ratio (OR), where the reference category was the results of our study. P-value was considered significant if it was < 0.05.
Results
One hundred blood donor samples were typed for antigens of major blood group systems (Rh, Kell, Kidd, Duffy, MNS, P, Lewis, and Lutheran). For the Rh blood group system, all samples were typed for D, C, E, c, and e. Of these, 80% of the donors were RhD-positive and 20% were RhD-negative. Table 1 shows the antigen frequency of the Rh antigens. The e antigen showed the highest frequency of 97%, followed by c antigen and D antigen (86% and 80%, respectively).
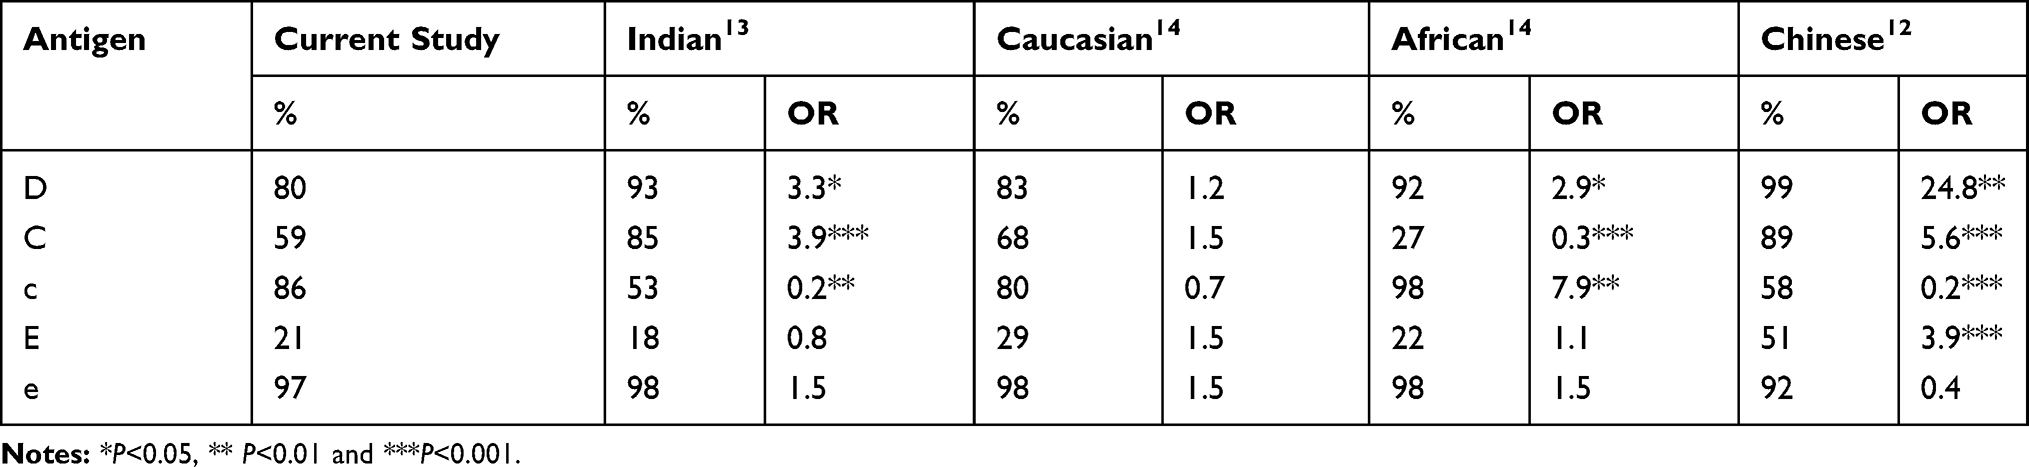 |
Table 1 Distribution of Rh Antigens in Blood Donors of Eastern Region of Saudi Arabia in Comparison to Other Populations |
In addition, Table 1 shows the bivariate association between the study sample and results from other populations (ie, Indian, Caucasian, African, and Chinese). The results indicate a statistically significant difference in the Antigen D, C, and c between the Saudi population and other populations. In the Chinese population, the odds of having the D antigen is 24.8 times higher compared to Saudi, and the C antigen is 5.6 times higher compared to the Saudi population. While, Africans were 7.9 times more likely to have the c antigen compared to the Saudis.
Table 2 shows the prevalence of Rh phenotypes detected in this study in comparison to other populations, DCCee for example was significantly higher in both the Chinese population and Indian populations compared to the Saudi population (OR= 4.3 and 4.8, respectively). Furthermore, the odds of having the Dccee phenotype in the African population is 7.9 times higher compred to the Saudi population. All RhD-negative donors expressed the commonly associated antigens c and e, which is seen in Table 2. Weak D antigen was not observed in any of the donors in this study.
 |
Table 2 Prevalence of Rh Phenotypes Detected in This Study in Comparison to Other Populations |
The antigen frequencies and blood group phenotypes of other major blood groups were also tested in this study. Some red cell antigens in the current study are significantly different compared to other populations (ie, Indian, Caucasian, African, and Chinese) (Table 3). For example, the s antigen is 21.6 times higher in the Chinese population compared to the Saudi population Furthermore, interestingly the odds of having the antigen Fya in the Chinese population is 365 times higher, and 21.6 times higher in the Indian population compared to the Saudi population. While the odds of having Antigen Fyb is 17.3 times higher in the Caucasians compared to the study population.
 |
Table 3 Prevalence of Red Cell Antigens in the Current Study and Other Populations |
When assessing the percentage of Kell, Kidd, and Duffy blood groups in the current study and other study, it was found that there was significant differences (Table 4), namely: K-k+, K+k+, Jk(a+b-), Jk(a-b+), Fy(a+b-), Fy(a-b+), Fy(a+b+), Fy(a-b-). The odds of having Fy(a+b-) phenotype in the Chinese population is 25.6 times higher compared to the Saudi population, while the odds of having it in the Indian population is 3.8 higher compared to the study population. In addition, the odds of Fy(a+b+) phenotype in the Indian and Caucasian populations are significantly different that the Saudi population (OR= 14.3 and 18.3, respectively). As, the Fya and Fyb were both found in 22% of the population in our study (Table 3). Interestingly, this resulted in the detection of the rare Fy (a-b -) phenotype in 61% of the donors in the study (Table 4).
 |
Table 4 Percentage of Kell, Kidd and Duffy Blood Group Phenotypes in Current Study and Other Populations |
As for the MNS blood group system, M+N-S+s+ and M+N+S-s+ were among the most common phenotypes at a frequency of 24% and 21% respectively, whereas M-N+S+s+ and M-N+S+s- were both the least common phenotypes of the MNS blood group system at a frequency of 3% (Table 5).
 |
Table 5 Percentage of Lewis, Lutheran and MNS Blood Group Phenotypes in Current Study and Other Populations |
Finally, for the cold blood group systems Lewis, Lutheran, and P; 49% of donors were Le (a-b+) and 97% were Lu (a-b+). The rare Lu(a+b+) and Lu(a-b-) were both found in this study at a frequency of 2% and 1 %, respectively (Table 5). The rare Le(a+b+) phenotype was observed in 3% of donors. The P1 antigen was observed in 85% of donors in this study (Table 3).
Discussion/Conclusion
In the present study we determined the frequency of the major blood group phenotypes (Rh, Kell, Kidd, Duffy, MNS, P, Lewis, and Lutheran) among the blood donors in the Eastern region of Saudi Arabia using gel method. The study showed that the frequency of these blood group phenotypes differs in between the Central region of Saudi Arabia and other populations.
As the Eastern region of Saudi Arabia has the highest prevalence of SCD and Thalassemia, local blood banks face the challenge of providing antigen-negative donor units for such patients who require frequent packed red blood cell transfusions as part of their therapeutic regimen.8 Therefore, determining the antigen frequencies of the local donor population is essential for facilitating routine blood banking practices providing blood to patients in a timely manner, while preventing future alloimmunization.10
The antigen frequencies of major blood group systems have been widely reported in the Caucasian, African, Indian, and Chinese populations.11–14 However, information on antigen frequencies in Saudi Arabia has been limited to the ABO and Rh blood group systems.3–5,7 To the best of our knowledge, this is the first study to report the extended antigen phenotyping of the major blood group systems in Saudi Arabia, specifically in the Eastern region.
The incidence of D antigen varies in different populations; in our study, the D antigen was found to be present in 80% of the population, which was comparable to that in the Caucasian population. However, the D antigen was highly expressed in the Chinese and African population with a significant difference in comparison to the findings in our study with an odds ratio (OR) of 2.9 and 24, and a significant p-value of <0.05 and < 0.001 respectively (Table 1). Similarly, the frequency of both the C and c antigen were comparable to the Caucasian population. The frequency of the C antigen in our study was detected in 59% of donors, which was significantly less than those found in the Indian and Chinese population (p<0.001), yet higher than the African population (p<0.001) (Table 1).13,14 A similar study was conducted by Nomani et al, on blood donors in the Central region of Saudi Arabia, where the D antigen was found at 91.3% in comparison to 80% in our study.15 Similarly, with the C antigen which was found at 59% in our study compared to 69.2% in the Central region. These findings highlight the differences in antigen expression in the various regions of Saudi Arabia, which proves that Saudi Arabia has a diverse ethnic background. Overall the antigen and phenotypic expression of the Rh blood group system in this study was found to be closer to those of the Caucasian population than any of the other populations.
In the Kell blood groups system, our findings revealed 8% of our donors expressed the K antigen, which was comparable to that in the Caucasian and Indian populations.13,14 The k (cellano) antigen was detected in 100% of our donors which was also comparable to values reported in all other populations.12–14
The Duffy blood group antigens function as receptors for malaria parasites, specifically Plasmodium vivax. Malaria infections caused by P. vivax affects approximately 80 million individuals worldwide.16 Individuals with the Duffy null phenotype Fy (a-b-) are resistant to malaria infections caused by P. vivax as they lack the receptor that allows parasite invasion into the red cells. The null phenotype is common among the African population living in an endemic area for malaria with a prevalence of approximately 68%, while in other populations such as the Indian, Chinese, and Caucasians, this phenotype is rare.12–14 Unexpectedly, in our study, this null phenotype showed a prevalence of 61%, which is similar to the African population as well as the overall phenotypes of the Duffy blood groups system (Table 4). However, a study conducted in the Central region of Saudi Arabia observed Fy (a-b-) only in 36% of their donors, which was lower than the value found in our study.15 This finding in addition to the differences in Rh antigen expression indicate that phenotype frequencies in different regions of Saudi Arabia vary between areas, emphasizing the importance of documenting blood group phenotypes nationally to help minimize the search for antigen-negative blood when necessary.
The cold blood group system Lewis was the most common phenotype found in our study, with Le (a-b+) showing a prevalence of 49%, which is close to the value observed in the African population (55%). The null Le(a-b-) was detected in 19% of our donors, showing a similar frequency to both the Indian, Chinese and African populations, and significantly than in the Caucasian population, which was found to be 6% (p<0.05).12–14 For the Lutheran blood group system, the most common phenotype detected was Lu (a-b+) at a frequency of 97%; this value is similar to those in all other populations.
The M+N-S+s+ and M+N+S-s+ phenotypes from the MNS blood group system were found in our donors at a frequency of 24% and 21%, respectively; however, they were not the most common MNS phenotypes observed in the other populations.12–14
As observed in this study, the frequency of the major blood groups in the eastern region of Saudi Arabia differs from those in not only other studied populations but also in the central region of Saudi Arabia. The main limitation of this study is the lack of a national registry for blood donors, because of which the frequency of these phenotypes cannot be generalized to the Saudi population as a whole but remains limited to the Eastern region.
Another major limitation is the small sample size, but the outcomes of this study may be used as a basis for establishing local registries nationwide not only in the Eastern region. Understanding the frequencies of the major blood group systems other than the ABO and Rh systems is essential for all blood banks for routine testing and emergencies. Data may be used to help blood banks prepare in-house antibody identification extended panels to detect unexpected multiple antibodies when commercial antibody identification kits are not conclusive.
Statement of Ethics
The donors provided written informed consent to participate in the study, and the study protocol was approved by the institutional review board of Imam Abdulrahman Bin Faisal University (IRB-PGS-2018-03-141). The study is in compliance with the Declaration of Helsinki.
Acknowledgment
The authors would like to thank Prof. Sulaiman Bah from the College of Public Health at Imam Abdulrahman Bin Faisal University, Dammam, Saudi Arabia for his consultation on the calculation of the sample size. Ms. Nada Al-Zahrani, Blood Bank supervisor from King Fahd Hospital of the University for providing us with the Rh phenotype data of the donors.
Author Contributions
All authors contributed to data analysis, drafting and revising the article, gave final approval of the version to be published, and agree to be accountable for all aspects of the work.
Funding
This study was funded by the Deanship of Research and Graduate studies of Imam Abdulrahman Bin Faisal University (2018-302-CAMS).
Disclosure
The authors have no conflicts of interest to declare.
References
1. Ashford P. Guidelines for pre-transfusion compatability procedures. Transfus Med. 1997;7(2):171. doi:10.1046/j.1365-3148.1997.d01-22.x
2. Storry JR, Castilho L, Chen Q, et al. International society of blood transfusion working party on red cell immunogenetics and terminology: report of the Seoul and London meetings. ISBT Sci Ser. 2016;11:118–122. doi:10.1111/voxs.12280
3. Bashawri LA, Al-Mulhim AA, Ahmad MS, Ahmed MA. Frequency of ABO blood groups in the Eastern region of Saudi Arabia. Saudi Med J. 2001;22(11):1008–1012.
4. Sarhan MAA, Saleh KA, Bin-Dajem SM. Distribution of ABO blood groups and rhesus factor in Southwest Saudi Arabia. Saudi Med J. 2009;30(1):116–119.
5. AlBilali A, AlFraidy O, AlHarbi H, et al. The distribution of ABO blood groups and rhesus factor among regular donors in Al-Madinah Al-Monawarah, Saudi Arabia 2016. Int J Adv Res. 2017;14(3):7850–7863. doi:10.21474/ijar01/3092
6. Alsuhaibani ES, Kizilbash NA, Malik S. Heterogeneity and diversity of ABO and Rh blood group genes in select Saudi Arabian populations. Genet Mol Res. 2015;14:7850–7863. doi:10.4238/2015.July.14.11
7. Abdullah SM. Frequency of ABO and Rh blood groups in the Jazan region of Saudi Arabia. Pak J Med Sci. 2010;26(4):818–821.
8. Alsaeed ES, Farhat GN, Assiri AM, et al. Distribution of hemoglobinopathy disorders in Saudi Arabia based on data from the premarital screening and genetic counseling program, 2011–2015. J Epidemiol Glob Health. 2018;7(suppl 1):S41–7. doi:10.1016/j.jegh.2017.12.001
9. Faul F, Erdfelder E, Lang AG, Buchner A. G*Power 3: a flexible statistical power analysis program for the social, behavioral, and biomedical sciences. Behav Res Methods. 2007;39(2):175–191. doi:10.3758/BF03193146
10. Kacker S, Ness PM, Shirey RS, Savage WJ, King KE, Tobian AAR. The future of red blood cell alloimmunization risk reduction. Transfusion. 2015;55(1):222–224. doi:10.1111/trf.12866
11. Kahar M, Patel R. Phenotype frequencies of blood group systems (Rh, Kell, Kidd, Duffy, MNS, P, Lewis, and Lutheran) in blood donors of south Gujarat, India. Asian J Transfus Sci. 2014;8(1):51–55. doi:10.4103/0973-6247.126693
12. Yu Y, Ma C, Sun X, et al. Frequencies of red blood cell major blood group antigens and phenotypes in the Chinese Han population from Mainland China. Int J Immunogenet. 2016;43(4):226–235. doi:10.1111/iji.12277
13. Thakral B, Saluja K, Sharma RR, Marwaha N. Phenotype frequencies of blood group systems (Rh, Kell, Kidd, Duffy, MNS, P, Lewis, and Lutheran) in north Indian blood donors. Transfus Apher Sci. 2010;43(1):17–22. doi:10.1016/j.transci.2010.05.006
14. Reid ME, Lomas-Francis C, Olsson ML. The Blood Group Antigen Facts Book.
15. LNomani SN, FS. Abstract Presentations from the AABB Annual Meeting Philadelphia, PA, October 25–28, 2014. In:
16. Langhi DM, Bordin JO. Duffy blood group and malaria. Hematology. 2006;11(5):389–398. doi:10.1080/10245330500469841
 © 2020 The Author(s). This work is published and licensed by Dove Medical Press Limited. The
full terms of this license are available at https://www.dovepress.com/terms
and incorporate the Creative Commons Attribution
- Non Commercial (unported, 3.0) License.
By accessing the work you hereby accept the Terms. Non-commercial uses of the work are permitted
without any further permission from Dove Medical Press Limited, provided the work is properly
attributed. For permission for commercial use of this work, please see paragraphs 4.2 and 5 of our Terms.
© 2020 The Author(s). This work is published and licensed by Dove Medical Press Limited. The
full terms of this license are available at https://www.dovepress.com/terms
and incorporate the Creative Commons Attribution
- Non Commercial (unported, 3.0) License.
By accessing the work you hereby accept the Terms. Non-commercial uses of the work are permitted
without any further permission from Dove Medical Press Limited, provided the work is properly
attributed. For permission for commercial use of this work, please see paragraphs 4.2 and 5 of our Terms.