Back to Journals » Drug Design, Development and Therapy » Volume 9
Pharmacokinetic-pharmacodynamic analysis to evaluate the effect of moxifloxacin on QT interval prolongation in healthy Korean male subjects
Authors Hong T, Han S ![]() , Lee J, Jeon S, Park G, Park W, Lim KS, Chung J
, Lee J, Jeon S, Park G, Park W, Lim KS, Chung J ![]() , Yu K
, Yu K ![]() , Yim D
, Yim D ![]()
Received 23 December 2014
Accepted for publication 22 January 2015
Published 26 February 2015 Volume 2015:9 Pages 1233—1245
DOI https://doi.org/10.2147/DDDT.S79772
Checked for plagiarism Yes
Review by Single anonymous peer review
Peer reviewer comments 3
Editor who approved publication: Prof. Dr. Wei Duan
Taegon Hong,1,2 Seunghoon Han,1,2 Jongtae Lee,1,2 Sangil Jeon,1,2 Gab-Jin Park,1,2 Wan-Su Park,1,2 Kyoung Soo Lim,3 Jae-Yong Chung,4 Kyung-Sang Yu,3 Dong-Seok Yim1,2
1Department of Pharmacology, College of Medicine, the Catholic University of Korea, Seoul, Republic of Korea; 2PIPET (Pharmacometrics Institute for Practical Education and Training), the Catholic University of Korea, Seoul, Republic of Korea; 3Department of Clinical Pharmacology and Therapeutics, Seoul National University College of Medicine and Hospital, Seoul, Republic of Korea; 4Department of Clinical Pharmacology and Therapeutics, Seoul National University College of Medicine and Bundang Hospital, Seongnam, Republic of Korea
Abstract: A single 400 mg dose of moxifloxacin has been the standard positive control for thorough QT (TQT) studies. However, it is not clearly known whether a 400 mg dose is also applicable to TQT studies in Asian subjects, including Koreans. Thus, we aimed to develop a pharmacokinetic (PK)-pharmacodynamic (PD) model for moxifloxacin, to evaluate the time course of its effect on QT intervals in Koreans. Data from three TQT studies of 33 healthy male Korean subjects who received 400 and 800 mg of moxifloxacin and placebo (water) were used. Twelve-lead electrocardiograms were taken for 2 consecutive days: 1 day to record diurnal changes and the next day to record moxifloxacin or placebo effects. Peripheral blood samples were also obtained for PK analysis. The PK-PD data obtained were analyzed using a nonlinear mixed-effects method (NONMEM ver. 7.2). A two-compartment linear model with first-order absorption provided the best description of moxifloxacin PK. Individualized QT interval correction, by heart rate, was performed by a power model, and the circadian variation of QT intervals was described by two mixed-effect cosine functions. The effect of moxifloxacin on QT interval prolongation was well explained by the nonlinear dose-response (Emax) model, and the effect by 800 mg was only slightly greater than that of 400 mg. Although Koreans appeared to be more sensitive to moxifloxacin-induced QT prolongation than were Caucasians, the PK-PD model developed suggests that a 400 mg dose of moxifloxacin is also applicable to QT studies in Korean subjects.
Keywords: thorough QT study, PK-PD model, NONMEM, Emax model
Introduction
Even if they do not target cardiovascular diseases, new drugs under development may prolong the QT or corrected QT (QTc) interval, which may cause fatal arrhythmias, such as torsades de pointes or sudden cardiac death.1,2 Since the 1990s, this phenomenon has drawn a high level of interest from regulatory agencies, pharmaceutical companies, and clinicians.3,4 The International Conference on Harmonisation (ICH) guidance, “Clinical Evaluation of QT/QTc Interval Prolongation and Proarrhythmic Potential for Non-antiarrhythmic Drugs” (ICH guidance E14), which describes assessment of drug-induced QT/QTc interval prolongation for new drugs in clinical development, was endorsed in 2005.5 This guidance provides recommendations about the design, conduct, analysis, and interpretation of thorough QT (TQT) studies to evaluate the potential of drugs to delay cardiac repolarization.
Bazett’s formula, Fridericia’s formula, and linear regression are generally used to adjust QT interval for heart rate because increased heart rate shortens the QT interval. However, these methods do not consider interindividual differences.6 Nonlinear mixed-effects methods can be applied to overcome this drawback, with individualized corrections by fixed and random effects.7
In TQT studies, moxifloxacin is most commonly used as a positive control to assess the relative risk of a drug.8 Despite some concerns for the racial difference in the sensitivity to QT-prolonging effects by drugs,9 the appropriateness of the moxifloxacin dose (400 mg) used for TQT studies among races or ethnic groups has not been scrutinized enough. The relationship between the pharmacokinetic (PK) characteristics of moxifloxacin and QT interval prolongation in Korean subjects has not yet been reported, although there is a report that Koreans are less sensitive to the QT prolongation effect of quinidine than Caucasians.10 Some reports have analyzed the PK-pharmacodynamic (PD) relationship of moxifloxacin and QT interval prolongation using nonlinear mixed-effects methods.11–13 These TQT studies for PK-PD analysis were conducted using a single dose (400 mg) of moxifloxacin, and QT interval baselines were measured after placebo intake. We tested two doses of moxifloxacin (400 mg and 800 mg) and precisely evaluated baseline QT interval variation by separately measuring the circadian rhythm (baseline) and placebo effect. The objective of this study was to explore the feasibility of using 400 mg moxifloxacin for TQT study in healthy Korean subjects by developing a PK-PD model to evaluate the time course of the effects of placebo and moxifloxacin on QT intervals.
Materials and methods
Inclusion and exclusion criteria
The PK and QT interval data of 33 subjects was used for PK-PD analysis. Eligible for inclusion were healthy male Korean volunteers between 20 and 40 years old, weighing within 20% of their ideal body weight, and with no clinically relevant conditions identified on their medical history, physical examination, and laboratory tests. The study excluded subjects with electrocardiogram (ECG) findings of corrected QT interval (using Fridericia’s formula) (QTcF) over 450 ms, PR interval above 200 ms or below 110 ms, second- or third-degree atrioventricular block, intraventricular conduction delay with QRS over 120 ms, pathologic Q waves (defined as Q wave over 40 ms or depth over 0.5 mV), ventricular preexcitation, and left or right bundle branch block. Subjects who had a family history of long QT syndrome or any other risk factors of torsade de pointes, such as sudden death, cardiac failure, and hypokalemia, were also excluded. A previous history of hypersensitivity to drugs, including quinolone antibiotics, was one of the important exclusion criteria. Participants abstained from drugs, foods, and any other lifestyle factors that might alter the PK characteristics of moxifloxacin for at least 24 hours before hospitalization and throughout the participation period.
Study design and subjects
Three TQT studies with an open-label, randomized, placebo-controlled, three-way crossover design were conducted at clinical trial centers of three hospitals in Korea (Seoul St Mary’s Hospital, Seoul National University Hospital, and Seoul National University Bundang Hospital). This study employed a William’s square design, including three 3-day treatment periods with 1-week washout intervals. The sequences of each period were as follows: ABC, ACB, BAC, BCA, CAB, and CBA (A = placebo [240 mL water only]; B = moxifloxacin 400 mg; and C = moxifloxacin 800 mg). Moxifloxacin was given as Avelox® (Bayer Healthcare Pharmaceuticals Inc., Montville, NJ, USA) tablets with 240 mL of water. For placebo, only 240 mL water was given, without placebo tablets. Six volunteers were allocated to each study sequence at enrollment, for every clinical center. The trial was conducted twice for each center with about a 6-month time interval, so the planned total number of recruited subjects was 36. Dropouts from the first study were replaced in the second study, so the total number of enrolled subjects was 38. Five participants withdrew consent during the study, and 33 subjects completed the study. Subject demographics are summarized in Table 1.
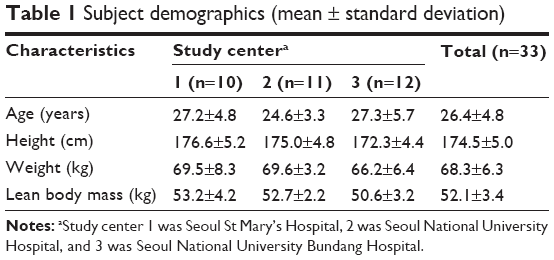 | Table 1 Subject demographics (mean ± standard deviation) |
The study was designed and monitored in accordance with the good clinical practice guidelines of Korea and the principles of the Declaration of Helsinki. The independent institutional review board of each hospital approved the protocol prior to study initiation, and all participants provided written informed consent. Before subject enrollment, this study was registered in the public trial registry at Clinical Trials.gov (www.clinicaltrials.gov) under the registration number NCT01756521.
Blood sampling and ECG measurement
On day 1 of each period, baseline 12-lead ECGs were measured using either a MAC5000® or MAC5500® (GE Healthcare, Little Chalfont, UK) (set at 25 mm/sec) from 8 am (0 hours) at the following time points: 0, 1, 2, 3, 4, 6, 8, 12, 16, and 24 hours. On day 2, subjects received one of three treatments (400 mg or 800 mg of moxifloxacin or placebo) in each period according to their sequence group, and ECGs were recorded at the same time points as on day 1. Subjects were not allowed to drink water throughout the morning of day 1, while placebo treatment on day 2 included intake of 240 mL water.
Blood sampling for PK analysis was done right after each ECG recording for subjects who took moxifloxacin. ECG measurements were always performed prior to vital sign measurements and blood sampling, after resting in the supine position for at least 10 minutes. Variability between hospitals was minimized by using the same mineral water (Volvic®; Groupe Danone, Paris, France) for drug administration and an identical menu for meals. Exact landmarks on the trunk (eg, clavicle, nipples, and sternal notch) and precordial electrode locations were indicated on a transparent plastic film for each subject in the first period, to minimize variability in ECG recording between periods. This film was used throughout the study to attach electrodes. A MUSE CV® information system (GE Healthcare) measured QT intervals automatically and computed the representative median value from 12 leads. Automatically calculated values from MAC5000® or MAC5500® were used for all other ECG results, including heart rate (HR), PR interval, RR interval, and QRS interval.
Assay of moxifloxacin plasma concentrations
Plasma concentration of moxifloxacin was determined by validated methods, using high-performance liquid chromatography (LC) (Agilent 1200 series; Agilent Technologies, Santa Clara, CA, USA) coupled with tandem mass spectrometry (MS/MS) (API3200; AB SCIEX, Foster City, CA, USA). After centrifugation at 2,093 g for 10 minutes at 4°C, separated plasma was stored at −70°C until assay. Briefly, a volume of 200 μL of plasma was deproteinized with 200 μL of 10% trichloroacetic acid containing internal standard (moxifloxacin-d 4,5). Samples were vortexed for 5 minutes and centrifuged at 17,311 g for 10 minutes at 4°C. Then, 50 μL of supernatant was diluted with 450 μL of distilled water. A volume of 5 μL from the diluted sample was injected into an LC/MS/MS system. The analytes were separated through a Hypersil GOLD™ C18 column (50×3.0 mm, 5 μm) at a flow rate of 0.4 mL/min under isocratic conditions, using 35% methanol with 0.1% formic acid. Analytes were detected by the electrospray positive-ionization mode of MS/MS.
The lower limit of quantification (LLOQ) was 100 ng/mL. The precision (% relative standard deviation) and accuracy of intra- and interday were below 3.9% and 97.7%–106.6%, respectively.
PK analysis
To develop the PK model, it was essential to evaluate the dose-dependence of moxifloxacin PK parameters and to compare PK characteristics according to dose. The following PK parameters were calculated by noncompartmental analysis using Phoenix WinNonlin® version 7.3 (Pharsight, Mountain View, CA, USA): maximum plasma concentration (Cmax), time to maximum plasma concentration (Tmax), area under the plasma concentration–time curve from zero until last measurable concentration (AUClast), area under the plasma concentration–time curve from zero extrapolated to infinite time (AUCinf), half-life, apparent clearance, and apparent volume of distribution. Cmax and Tmax were actual measured values, whereas AUClast and AUCinf were calculated by using a log-linear trapezoidal rule. After dose normalization of obtained Cmax, AUClast, and AUCinf, the dose-dependence of PK parameters was compared by paired t-test using SAS version 9.2 (SAS Institute Inc. Cary, NC, USA). The dose-dependence of other parameters was also evaluated.
PK model
The PK data set consisted of 660 moxifloxacin concentration observations from 33 subjects. PK analysis with the mixed-effects method was conducted using NONMEM version 7.2 (Icon Development Solutions, Ellicott City, MD, USA) with the GFORTRAN compiler. The first-order conditional estimation (FOCE) with interaction method was used throughout the model building process.14 Model appropriateness was evaluated based on various goodness-of-fit criteria, including diagnostic scatter plots, likelihood ratio tests, and measures of model stability and adequacy (condition number, successful convergence, significant digits, and matrix singularity). Likelihood ratio test results were considered statistically significant if decreases in the objective function value (OFV) of nested models were more than 3.84 (P<0.05, one degree of freedom) and 5.99 units (P<0.05, two degrees of freedom). Besides using the OFV, the Akaike information criterion (AIC) was used for nonnested models. AIC is expressed as:
AIC = OFV + 2p, | (1) |
where p is the number of all parameters.
A log-normal distribution was assumed for between-subject variability (BSV), and parameters were described as:
Pij = θj · exp(ηij), | (2) |
where Pij is the jth parameter for the ith individual, θj is the typical value of the jth parameter, and ηij is a random variable following a Gaussian distribution with a mean of 0 and variance of ωj2. To refine the PK model, covariance between random effects in the model was explored using the Omega block option. The combined (ie, additive and proportional) error model was initially applied to describe residual error, including intrasubject variability and measurement error, as follows:
|
|

where IPREDij is the individual predicted concentration, Yij is the measured concentration of the jth individual at the ith sampling time, and εij is residual error.
Both one-compartment and multicompartment models were tested, and all PK processes (except the absorption) were assumed to follow first-order kinetics. First-order absorption with or without lag time, transit compartment,15 and Weibull-type absorption model16 were tested to find the best description of the moxifloxacin absorption profile.
PD model
QT interval data of six subjects were lost due to an error in the ECG data archiving format. Thus, the data of 27 subjects were analyzed. The PD data sets for baseline, placebo, and drug effect consisted of 810, 513, and 540 QT interval observations, respectively. PD modeling was conducted with individual PK parameters estimated from the final PK model added to the data set (sequential PK-PD modeling approach).
Individualized baseline model
An essential element of evaluating drug-induced QT interval prolongation is correction of QT intervals for changes in RR interval or heart rate. The power correction model was first tested by RR interval, as shown in the former study:7
QT = QTcI · RRα. | (4) |
A linear regression form was also tested by comparing AIC:
QT = QTcI+ α · (1 – RR), | (5) |
where the QTcI is an individually-corrected QT interval, and α is an individual heart rate correction factor.
Since three baseline data points were gathered from each subject, all were used for baseline modeling. Interoccasional variability for QTcI was allowed because there were statistically significant differences in QTcI between periods of the same subject. The power correction model, found to be superior to the linear regression model, was used throughout the step-by-step PD model building process described in the following sections.
Circadian rhythm model
It is well known that QT, RR, and QTc vary within a day, by circadian rhythm.17,18 Therefore, a model for this rhythm should be incorporated into the PD model to precisely estimate the drug effect. An empirical model for circadian rhythm was constructed using the multiple components procedure for analysis of longitudinal time-series amounts, as reported by Fernández and Hermida.19 Cosine equations for baseline QT (QTb) and corrected QTc (QTbc) were as follows:7
QTb = QTcm · [1 + CIRC] · RRα, | (6) |
|
|
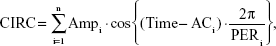
QTbc = QTcm · [1 + CIRC], | (8) |
QTb = QTbc · RRα, | (9) |
where QTcm is an individual mesor value of the corrected QT interval, Ampi is the ith parameter for the amplitude of cosine terms, ACi is the ith parameter for phase shift of the cosine terms, and PERi is the period of the ith component of variation (assumed to be divisors of 24 hours). The components were added up from the one with the longest period (in order of 24, 12, 8, 6 hours, etc) until the model could not be improved any further.
Placebo effect model
In addition to the circadian rhythm model, the presence of the placebo effect was tested for the baseline data of the placebo administration period (period A) for each subject. A first-order elimination function was applied to explain changes of the placebo effect with time, where the maximum value right after placebo intake decreased as if it were a first-order elimination of drug concentrations after intravenous (IV) bolus injection (PE·e−k·TAD). Because the placebo used in this study was only 240 mL of mineral water without any placebo tablets or a blinding process, healthy subjects did not have any reason to expect or assume drug effects after water intake. Thus, the placebo effect in comparison with the condition at baseline QT study, where no water intake was allowed in the morning time, would be some influence caused by 240 mL of water: eg, a temporary increase in stomach volume caused by water intake. Thus, we assumed that its influence was largest just after dosing. The equations for placebo effect QT (QTp) and corrected QTc (QTpc) were described as follows;
|
|
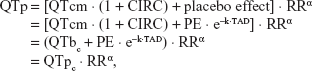
where PE is the maximum value of the placebo effect, k is the elimination rate constant of the placebo effect, and TAD represents the time elapsed after placebo administration.
Drug effect model
Assessment of drug effects was conducted by analyzing the data of periods B and C. QT interval data before and after moxifloxacin (400 mg or 800 mg) administration were used for drug effect modeling. The equations for drug effect QT (QTd) and corrected QTc (QTdc) were as follows:
|
|
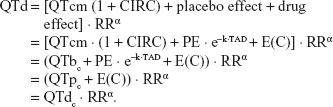
The effect of moxifloxacin plasma concentration (E(C)) on QT interval prolongation was tested using Emax and linear relationship models:
|
|
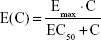
and
E(C) = a · C, | (13) |
where Emax is the maximum effect of QT prolongation, and EC50 is the drug concentration that produces 50% of the maximal effect.
The BSV of each PD parameter was described using a log-normal variance model. A proportional error model was used to present the residual variability of the drug effect. Data were fitted using an FOCE with the interaction method of NONMEM. Model selection criteria were the same as those used for PK model building.
Covariate selection and model evaluation
Demographic and clinical variables such as age, height, weight, lean body mass, and genotype were screened as potential covariates of PK and PD parameters. Both visual (parameter vs variable scatter plots) and numerical (generalized additive modeling [GAM] in Xpose. ver. 4.2.3) covariate screening procedures were performed before adding each covariate to the basic model. Covariates were chosen through a forward selection–backward elimination process, with the likelihood ratio test.
The 95% confidence intervals (CIs) for mean population PK and PD parameters were determined using a resampling technique based on the bootstrap method. One thousand bootstrap-resampled data sets from the original data were sequentially estimated using the same final model to evaluate parameter values obtained from the final model. A visual predictive check (VPC) was also performed by overlaying observed data points with the median, and 5 and 95 percentile curves of 1,000 data sets simulated using the final PK and PD model.
Results
PK analysis
Results of the noncompartmental PK analysis are summarized in Table 2. The dose-normalized Cmax was higher, but the median Tmax value was less for 400 mg moxifloxacin than for 800 mg. The dose-normalized AUClast and AUCinf were not statistically different. Statistical analysis of the other parameters confirmed that the elimination characteristics of moxifloxacin were independent of dose.
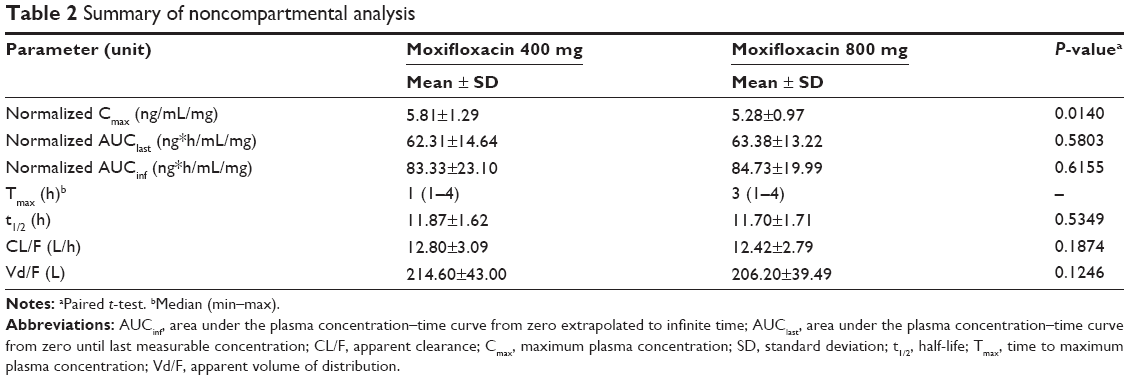 | Table 2 Summary of noncompartmental analysis |
PK model
A two-compartment, first-order elimination model with proportional residual error was chosen as the basic PK model. The absorption profile of moxifloxacin was best described by a first-order absorption model with lag time. The absorption rate constant was estimated separately according to dose. There was no significant covariate for PK parameters. The Omega block structure between clearance and volume of distribution incorporated into the basic model was maintained throughout the model development process. Final PK parameter estimates, with corresponding standard error (SE) values, are summarized in Table 3. Basic goodness-of-fit plots for the final PK model are presented in Figure 1.
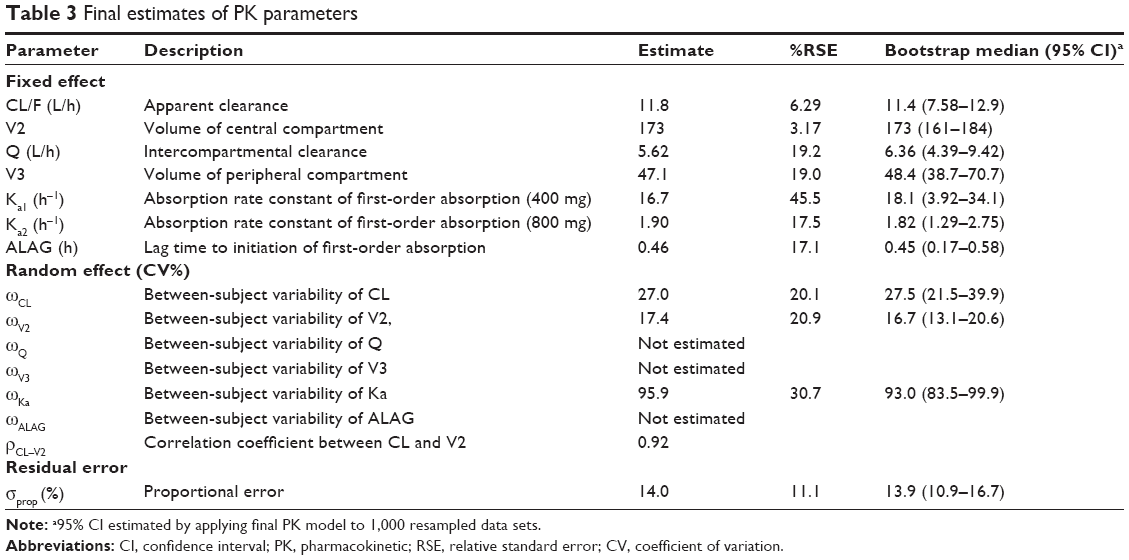 | Table 3 Final estimates of PK parameters |
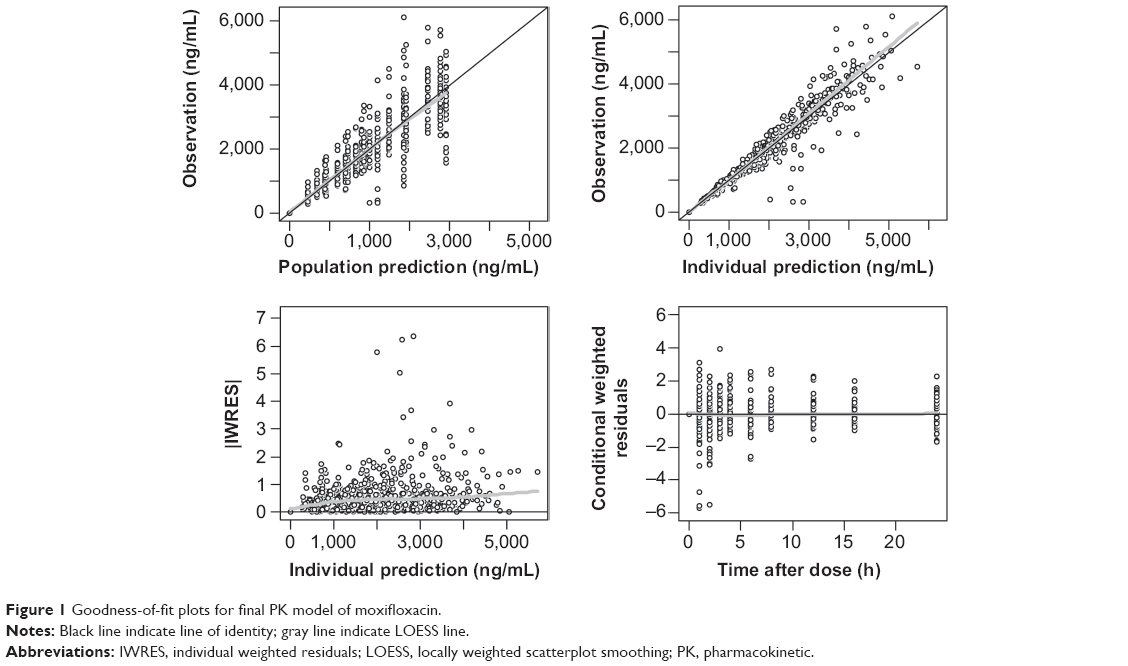 | Figure 1 Goodness-of-fit plots for final PK model of moxifloxacin. |
PD model
Individualized baseline and circadian rhythm model
The power correction model was chosen as a method for QT interval individualization because it showed a significantly smaller AIC than that of the linear regression model and better explained the relationship between heart rate and QT interval. A total of two cosine terms for circadian rhythm were identified, with periods of 24 and 6 hours. The BSV for individual parameters describing the circadian rhythm was explained best when applied additively (eg, + ηi). The BSV was significant at the first circadian rhythm (24-hour component) only. The final parameter estimates for QTcm and α were 406 ms and 0.26, respectively. The model was significantly improved when about 1% of interoccasional variability was given to QTcm.
Placebo effect model
Baseline QTbc and QTpc, which indicate corrected QT interval before and after considering the placebo effect, were estimated. The placebo effect–incorporated model showed a significant decrease in OFV compared with the model without it. Final parameter estimates for the IV bolus-like placebo effects were −5.31 ms for PE and 0.06 hours−1 for k.
Drug effect model
The Emax model provided a better description of the effect than did the linear model, based on AIC value and conditional weighted residuals (CWRES). The sigmoid Emax model was also attempted, but the addition of Hill’s coefficient to the simple Emax model was not helpful. The final parameter estimates for Emax and EC50 were 34.7 ms and 3,920 ng/mL, respectively. No covariance structure or contributing covariates were identified. Basic goodness-of-fit plots for the final baseline circadian, placebo, and drug effect model are given in Figure 2. Final parameter estimates of the PK-PD model, with corresponding SE values, are summarized in Tables 4 and 5. Comparative time courses of the average QTc intervals, predicted by models according to dose, are depicted in Figure 3. Means and 95% CIs of QTc intervals predicted by final PD model at each time point are summarized in supplementary Tables S1 and S2.
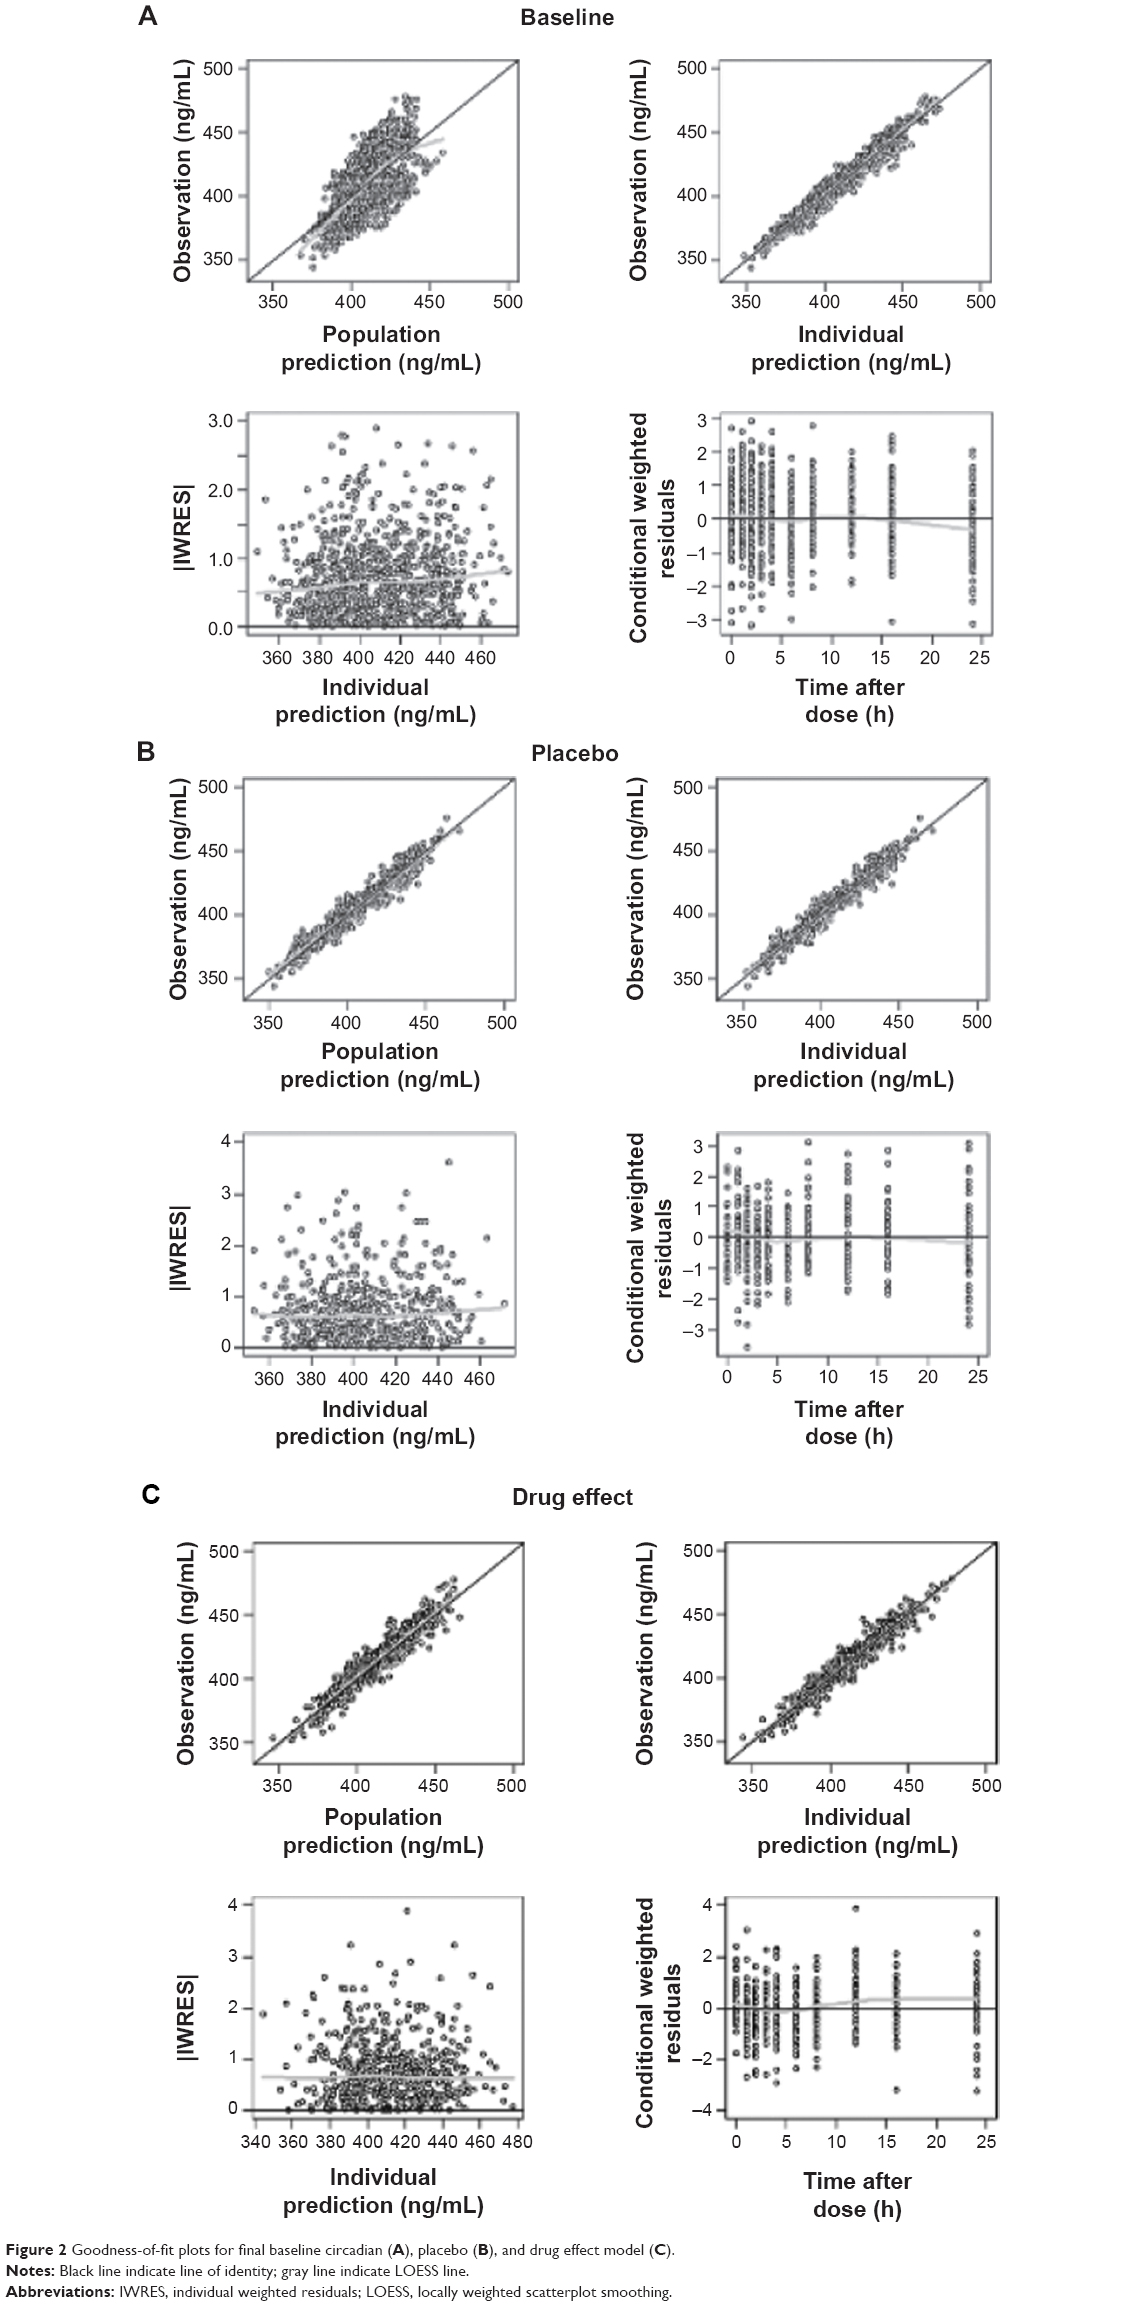 | Figure 2 Goodness-of-fit plots for final baseline circadian (A), placebo (B), and drug effect model (C). |
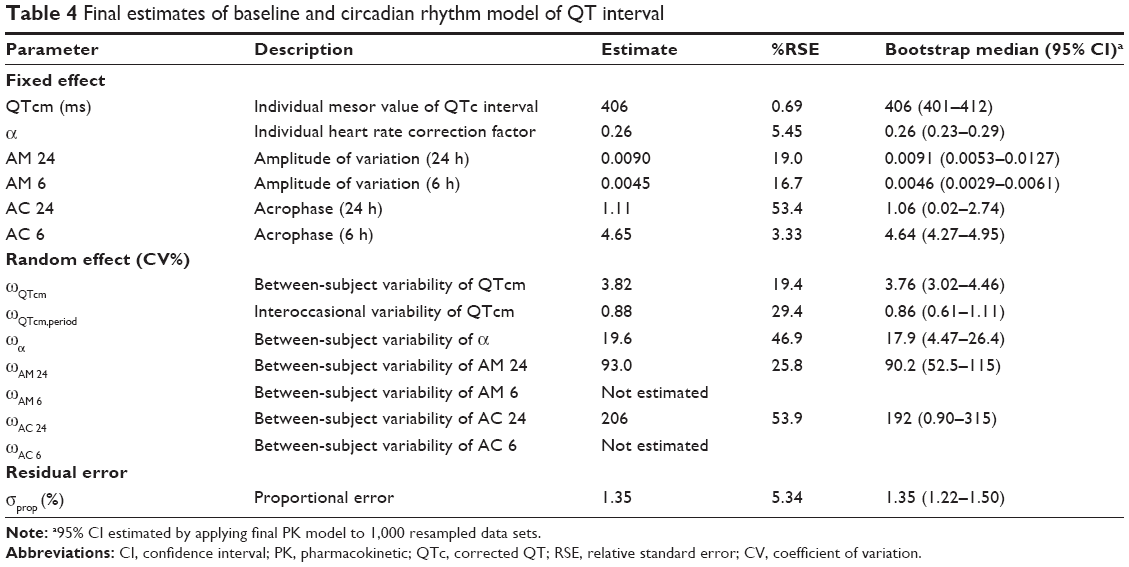 | Table 4 Final estimates of baseline and circadian rhythm model of QT interval |
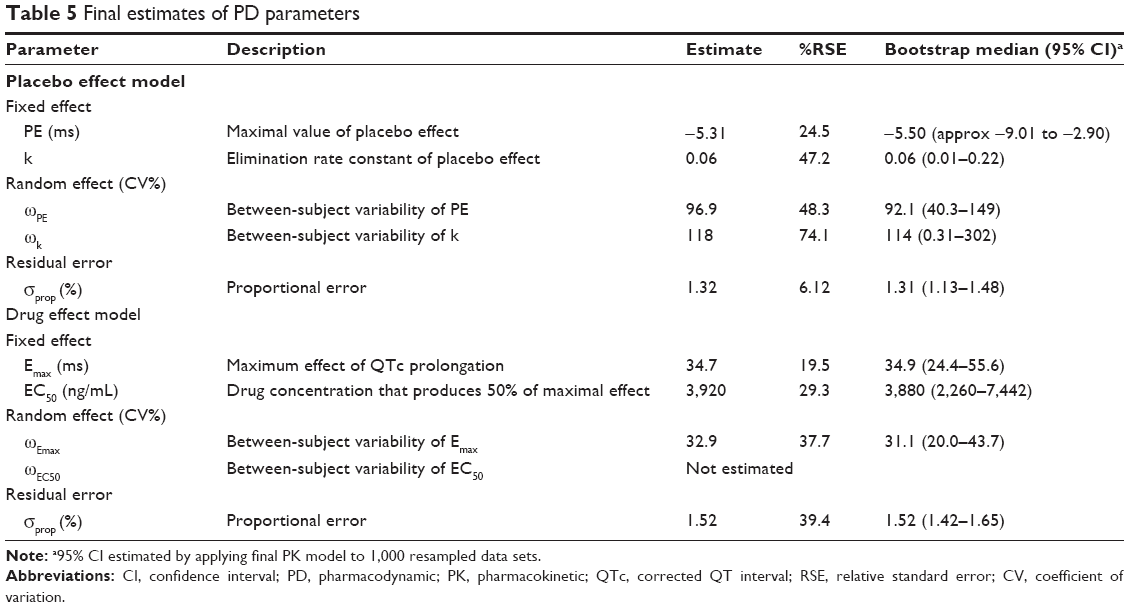 | Table 5 Final estimates of PD parameters |
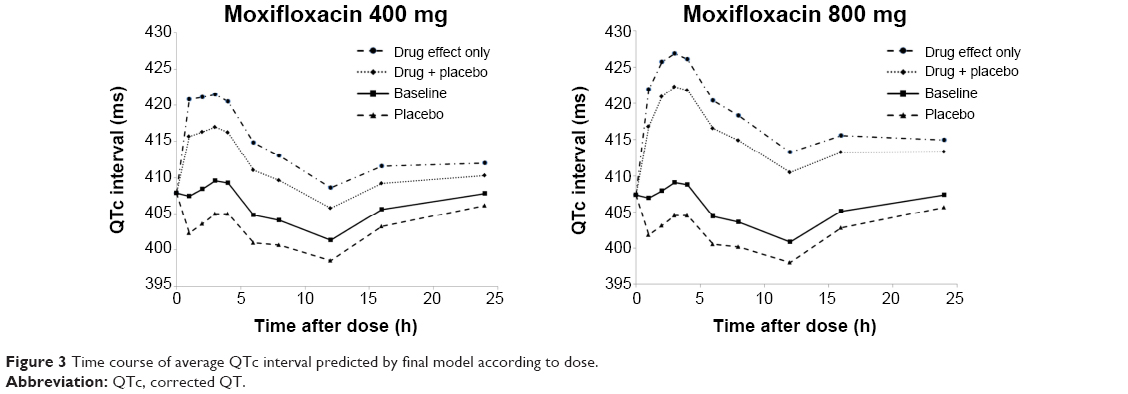 | Figure 3 Time course of average QTc interval predicted by final model according to dose. |
Model evaluation
The results of VPCs performed using the final PK and PD models are presented in Figures 4 and 5, respectively. Median parameter estimates obtained from the bootstrap process were very similar to estimates of the final model. Median parameter estimates and CIs from 1,000 bootstrap replications are summarized in Tables 3–5, respectively.
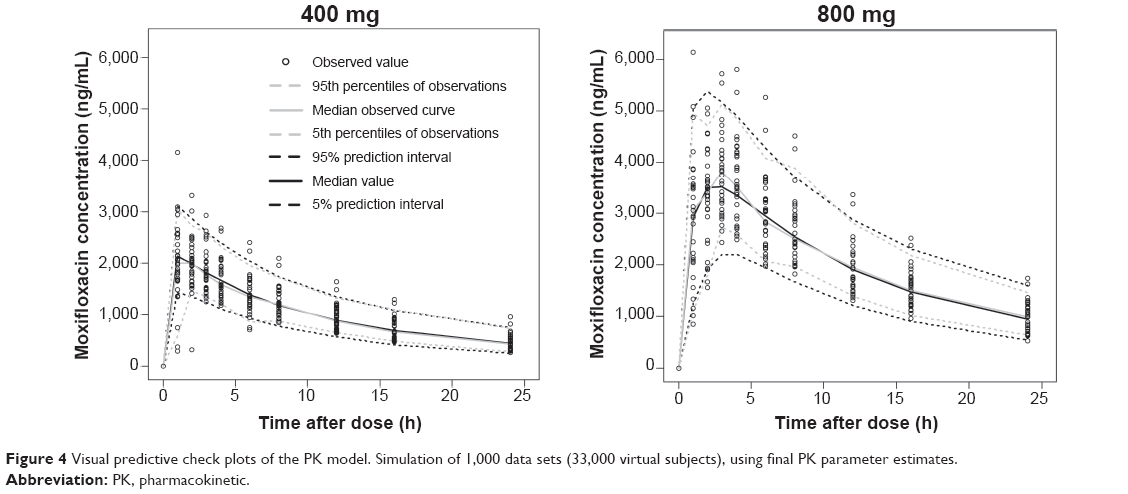 | Figure 4 Visual predictive check plots of the PK model. Simulation of 1,000 data sets (33,000 virtual subjects), using final PK parameter estimates. |
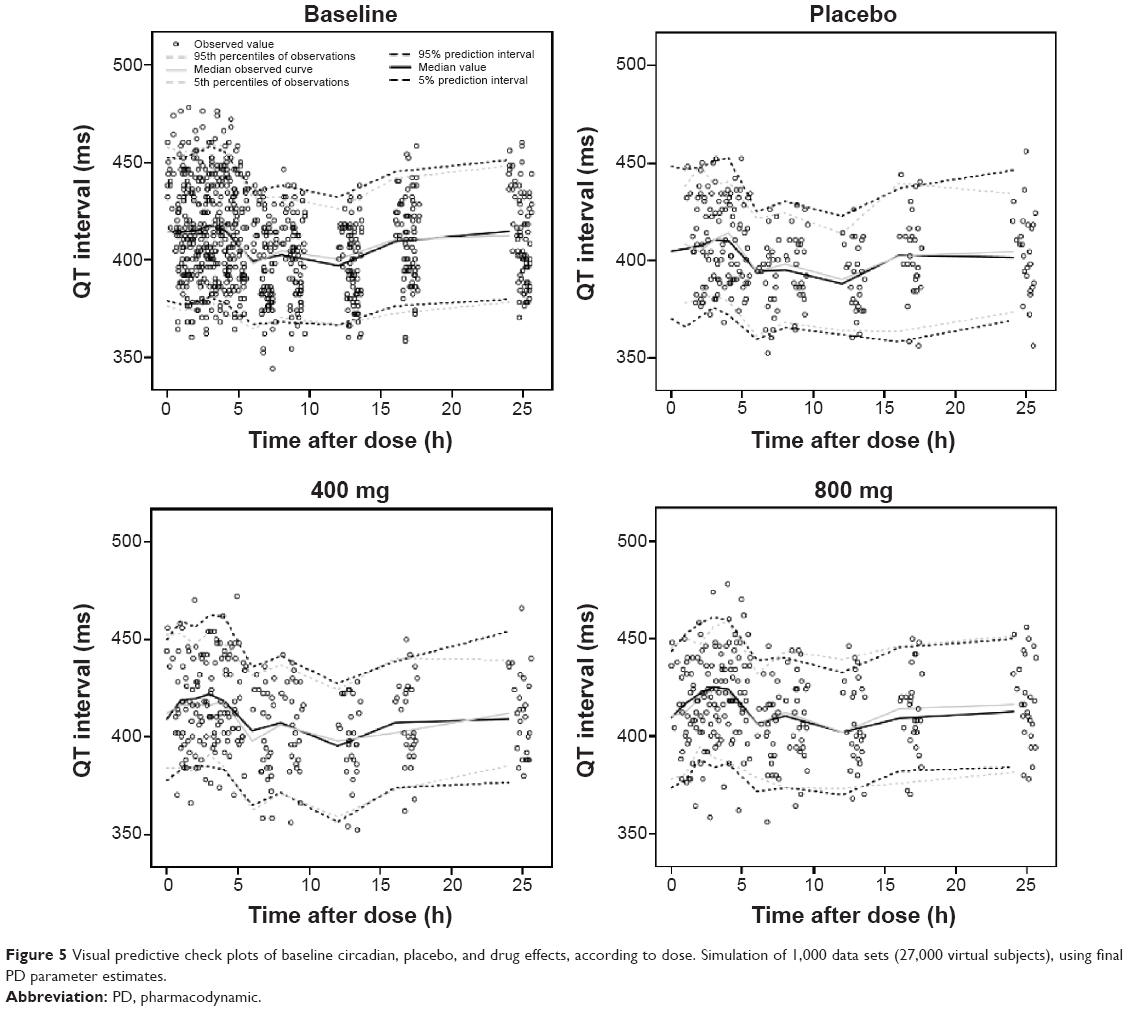 | Figure 5 Visual predictive check plots of baseline circadian, placebo, and drug effects, according to dose. Simulation of 1,000 data sets (27,000 virtual subjects), using final PD parameter estimates. |
Discussion
This study investigated the effect of moxifloxacin on QT interval prolongation by constructing a mixed-effects model for circadian rhythm, placebo effect, and drug effects. The moxifloxacin PK in our data was best described by a two-compartment distribution and first-order absorption model, with different absorption rates according to dose. The circadian model adequately expressed intraday variation in QT intervals, and the Emax model explained QT interval prolongation by moxifloxacin.
This study was the first to attempt PK modeling of more than a single dose of moxifloxacin. Noncompartmental analysis showed different tmax and dose-normalized Cmax values depending on dose, in agreement with a previous report.20 Different absorption characteristics per dose were assumed, so a different parameter was estimated by dose in the absorption model. As a result, there was a significant decrease in OFV and improvement in the model. The absorption rate of 400 mg moxifloxacin was faster than that of 800 mg. Other recent modeling studies11–13 selected the transit compartment model as their absorption model, so this model was also tried along with another absorption model with a complex structure (Weibull-type absorption). However, these models were not found to be appropriate. This may have been due to insufficient information regarding the absorption phase, as the first plasma sampling time point was set as 1 hour in the clinical trial design.
The building of a circadian rhythm model was an essential part of this analysis. Our model reflected the pattern of intraday change in QT interval and was successful in identifying BSV and residual errors included in the raw data. Using this model, we were able to establish a standard for comparison when evaluating the effect of placebo and drug. We supplied 240 mL of water as a placebo, and there was an approximate QTc interval decrease of 5.3 ms on average per person in contrast to baseline (no water intake) status. A prior report by Nagy et al21 that examined the effect of meals on QTc interval prolongation had set up a water-only consumption control group, with a pattern of QTc interval decrease similar to our findings. As mentioned in the “Methods” section, our placebo effect model was assumed to decrease by first-order kinetics. Thus far, PK-PD analysis of moxifloxacin has mostly been done in a setting that placed the placebo data as a baseline. However, it is more logical for the observed QTc values to be modeled as the sum of placebo and drug effects riding on baseline fluctuation in the circadian rhythm. Unlike previous reports, the placebo effect caused by 240 mL of water was separated from the baseline (circadian rhythm) in our model building process.
We selected Emax model as our final PD model, based on the significant decrease in AIC value and improvements in residual plots and VPC compared with those of the linear model. Although 800 mg moxifloxacin (double the therapeutic dose, 400 mg) was the maximum dose in this study because of safety concerns, the moxifloxacin concentrations obtained ranged from 265.4 to 6,137 ng/mL, which included many well above the estimate of EC50 (3,920 ng/mL). This also implies that the final Emax model may be a reasonable choice over the simple linear model despite the narrow dose range (400 mg and 800 mg) in our study. The PK-PD analysis between moxifloxacin concentration and QT interval prolongation is challenging due to ethical considerations. Administration of moxifloxacin over the therapeutic range may cause an excessive prolongation of QT interval. For this reason, there is a limitation on obtaining the data on appropriate range. The therapeutic dose of moxifloxacin is 400 mg, and in this study, we also administered 800 mg, which was relatively sufficient to evaluate PK-PD relationship.
In our Emax model, the estimated EC50 value was 3,920 ng/mL, which was close to the average peak concentration when 800 mg moxifloxacin was administered. The mean of the predicted maximal QTc interval prolongation with moxifloxacin alone (placebo effect excluded) was 13.4 (73% of 800 mg) ms with 400 mg intake and 18.3 ms with 800 mg intake. Including the placebo effect, the average QTc interval prolongation from baseline was 8.4 ms with 400 mg intake and 13.7 ms with 800 mg intake. Thus, our PK-PD model indicates that the QTc interval prolongation effect of moxifloxacin does not double by doubling the dose from 400 to 800 mg. The results of this TQT study describing baseline-corrected, placebo-adjusted differences in ΔQTc (ΔΔQTc) caused by moxifloxacin dose has been reported previously.22
Since Grosjean and Urien employed an Emax model12,13 with a model structure slightly different from ours, using data obtained from the 400 mg intake group only, it is difficult to directly compare Emax and EC50 values. In this study, the degree of QTc interval prolongation with 400 mg moxifloxacin in Koreans (13.4 ms) was about double the value observed in Caucasians, as reported by Grosjean and Urien (7 ms).13 This contradicts a previous report that concluded Koreans may be less sensitive to drug (quinidine)-induced QT interval prolongation than are Caucasians.10 However, there was no subject whose QTc interval prolongation exceeded the predefined upper limit in ICH guidance E14 (absolute QTc interval >450 ms or QTc interval increase from baseline >30 ms) in our 400 mg–intake group.5 Differences in the PK-PD models, data processing methods, and drugs used in the studies make it difficult to draw a clear conclusion. We can conclude that 400 mg moxifloxacin may be used for TQT studies in Koreans without concern for lower sensitivity to QT prolongation effects or overdosing.
Conclusion
We successfully demonstrated QT/QTc interval prolongation with 400 mg and 800 mg moxifloxacin in healthy Korean male subjects, using models described in this report. We conclude that a 400 mg dose of moxifloxacin is also applicable to TQT studies in Korean subjects. The circadian rhythm and placebo effect models developed herein may be utilized as a foundation for QT interval interpretation studies.
Acknowledgments
This study was supported by a grant of the Korea Healthcare Technology R&D Project, Ministry of Health and Welfare, Republic of Korea (grant number HI07C00010000).
Disclosure
The authors report no conflicts of interest in this work.
References
Fenichel RR, Malik M, Antzelevitch C, et al; Independent Academic Task Force. Drug-induced torsades de pointes and implications for drug development. J Cardiovasc Electrophysiol. 2004;15(4):475–495. | ||
Roden DM. Drug-induced prolongation of the QT interval. N Engl J Med. 2004;350(10):1013–1022. | ||
De Ponti F, Poluzzi E, Montanaro N. QT-interval prolongation by non-cardiac drugs: lessons to be learned from recent experience. Eur J Clin Pharmacol. 2000;56(1):1–18. | ||
Malik M, Camm AJ. Evaluation of drug-induced QT interval prolongation: implications for drug approval and labelling. Drug Saf. 2001;24(5):323–351. | ||
US Dept of Health and Human Services; Food and Drug Administration; Center for Drug Evaluation and Research; Center for Biologics Evaluation and Research; International Conference on Harmonisation. Guidance for Industry, E14 Clinical Evaluation of QT/QTc Interval Prolongation and Proarrhythmic Potential for Non-Antiarrhythmic Drugs. Rockville, MD: US Dept of Health and Human Services, Food and Drug Administration, Center for Drug Evaluation and Research; 2005. | ||
Batchvarov VN, Ghuran A, Smetana P, et al. QT-RR relationship in healthy subjects exhibits substantial intersubject variability and high intrasubject stability. Am J Physiol Heart Circ Physiol. 2002;282(6):H2356–H2363. | ||
Piotrovsky V. Pharmacokinetic-pharmacodynamic modeling in the data analysis and interpretation of drug-induced QT/QTc prolongation. AAPS J. 2005;7(3):E609–E624. | ||
Dmitrienko A, Beasley C, Mitchell M. Design and Analysis of Thorough QT Studies. Biopharmaceutical Network; 2008. Available from: http://www.biopharmnet.com/doc/2008_04_29_report.pdf. Accessed January 22, 2015. | ||
Shah RR. Drug-induced QT interval prolongation: does ethnicity of the thorough QT study population matter? Br J Clin Pharmacol. 2013;75(2):347–358. | ||
Shin JG, Kang WK, Shon JH, et al. Possible interethnic differences in quinidine-induced QT prolongation between healthy Caucasian and Korean subjects. Br J Clin Pharmacol. 2007;63(2):206–215. | ||
Florian JA, Tornøe CW, Brundage R, Parekh A, Garnett CE. Population pharmacokinetic and concentration – QTc models for moxifloxacin: pooled analysis of 20 thorough QT studies. J Clin Pharmacol. 2011;51(8):1152–1162. | ||
Grosjean P, Urien S. Reevaluation of moxifloxacin pharmacokinetics and their direct effect on the QT interval. J Clin Pharmacol. 2012;52(3):329–338. | ||
Grosjean P, Urien S. Moxifloxacin versus placebo modeling of the QT interval. J Pharmacokinet Pharmacodyn. 2012;39(2):205–215. | ||
Beal SL, Sheiner LB. NONMEM User’s Guide – Part I. San Francisco, CA: University of California at San Francisco; 1992. | ||
Savic RM, Jonker DM, Kerbusch T, Karlsson MO. Implementation of a transit compartment model for describing drug absorption in pharmacokinetic studies. J Pharmacokinet Pharmacodyn. 2007;34(5):711–726. | ||
Pétricoul O, Cosson V, Fuseau E, Marchand M. Population models for drug absorption and enterohepatic recycling. In: Ette EI, Williams PJ, editors. Pharmacometrics: the Science of Quantitative Pharmacology. Hoboken, NJ: John Wiley & Sons, Inc.; 2007:345–382. | ||
Ishida S, Nakagawa M, Fujino T, Yonemochi H, Saikawa T, Ito M. Circadian variation of QT interval dispersion: correlation with heart rate variability. J Electrocardiol. 1997;30(3):205–210. | ||
Molnar J, Rosenthal JE, Weiss JS, Somberg JC. QT interval dispersion in healthy subjects and survivors of sudden cardiac death: circadian variation in a twenty-four-hour assessment. Am J Cardiol. 1997;79(9):1190–1193. | ||
Fernández JR, Hermida RC. Inferential statistical method for analysis of nonsinusoidal hybrid time series with unequidistant observations. Chronobiol Int. 1998;15(2):191–204. | ||
Stass H, Dalhoff A, Kubitza D, Schühly U. Pharmacokinetics, safety, and tolerability of ascending single doses of moxifloxacin, a new 8-methoxy quinolone, administered to healthy subjects. Antimicrob Agents Chemother. 1998;42(8):2060–2065. | ||
Nagy D, DeMeersman R, Gallagher D, et al. QTc interval (cardiac repolarization): lengthening after meals. Obes Res. 1997;5(6):531–537. | ||
Moon SJ, Lee J, An H, et al. The effects of moxifloxacin on QTc interval in healthy Korean male subjects. Drugs R D. 2014;14(2):63–71. |
Supplementary materials
 | Table S1 QTc intervals (ms) predicted by the final model (moxifloxacin 400 mg) |
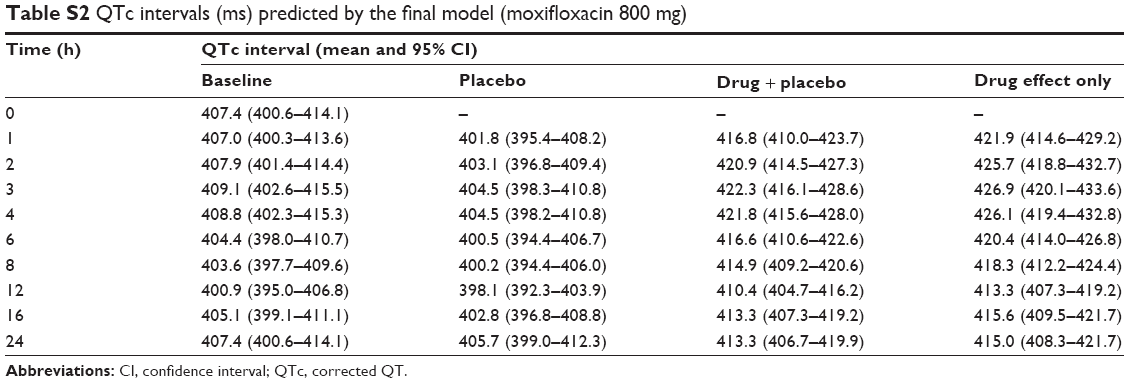 | Table S2 QTc intervals (ms) predicted by the final model (moxifloxacin 800 mg) |
 © 2015 The Author(s). This work is published and licensed by Dove Medical Press Limited. The
full terms of this license are available at https://www.dovepress.com/terms
and incorporate the Creative Commons Attribution
- Non Commercial (unported, 3.0) License.
By accessing the work you hereby accept the Terms. Non-commercial uses of the work are permitted
without any further permission from Dove Medical Press Limited, provided the work is properly
attributed. For permission for commercial use of this work, please see paragraphs 4.2 and 5 of our Terms.
© 2015 The Author(s). This work is published and licensed by Dove Medical Press Limited. The
full terms of this license are available at https://www.dovepress.com/terms
and incorporate the Creative Commons Attribution
- Non Commercial (unported, 3.0) License.
By accessing the work you hereby accept the Terms. Non-commercial uses of the work are permitted
without any further permission from Dove Medical Press Limited, provided the work is properly
attributed. For permission for commercial use of this work, please see paragraphs 4.2 and 5 of our Terms.