Back to Journals » International Journal of Nanomedicine » Volume 14
pH-dependent and cathepsin B activable CaCO3 nanoprobe for targeted in vivo tumor imaging
Authors Sun N ![]() , Wang D, Yao G, Li X, Mei T, Zhou X, Wong KY
, Wang D, Yao G, Li X, Mei T, Zhou X, Wong KY ![]() , Jiang B, Fang Z
, Jiang B, Fang Z
Received 16 January 2019
Accepted for publication 9 April 2019
Published 13 June 2019 Volume 2019:14 Pages 4309—4317
DOI https://doi.org/10.2147/IJN.S201722
Checked for plagiarism Yes
Review by Single anonymous peer review
Peer reviewer comments 2
Editor who approved publication: Dr Linlin Sun
Ning Sun,1,2,* Dou Wang,3,* Guoqiang Yao,4 Xiaomei Li,1 Ting Mei,1 Xinke Zhou,1 Kwok-Yin Wong,2 Baishan Jiang,4 Zhiyuan Fang,1
1The Fifth Affiliated Hospital of Guangzhou Medical University, Guangzhou 510500, People’s Republic of China; 2State Key Laboratory of Chemical Biology and Drug Discovery, and Department of Applied Biology and Chemical Technology, The Hong Kong Polytechnic University, Hung Hom, Kowloon, Hong Kong SAR, People’s Republic of China; 3Department of Hepatobiliary and Pancreatic Surgery, Shenzhen People‘s Hospital, Second Clinical Medical College of Jinan University, Shenzhen 518020, People’s Republic of China; 4Guangzhou Institutes of Biomedicine and Health, Chinese Academy of Sciences, Guangzhou 510530, People’s Republic of China
*These authors contributed equally to this work
Background: The intraoperative visualization of tumor cells is a powerful modality for surgical treatment of solid tumors. Since the completeness of tumor excision is closely correlated with the survival of patients, probes that can assist in distinguishing tumor cells are highly demanded.
Purpose: In the present study, a fluorescent probe JF1 was synthesized for imaging of tumor cells by conjugating a substrate of cathepsin B (quenching moiety) to Oregon Green derivative JF2 using a self-immolative linker.
Methods: JF1 was then loaded into the folate-PEG modified CaCO3 nanoparticles. The folate receptor-targeted, pH-dependent, and cathepsin B activable CaCO3 nanoprobe was test in vitro and in vivo for tumor imaging.
Results: CaCO3 nanoprobe demonstrated good stability and fast lighting ability in tumors under low pH conditions. It also showed lower fluorescence background than the single cathepsin B dependent fluorescent probe. The pH-dependent and cathepsin B controlled “turn-on” property enables precise and fast indication of tumor in vitro and in vivo.
Conclusion: This strategy of controlled drug delivery enables in vivo imaging of tumor nodules with a high signal-to-noise ratio, which has great potential in surgical tumor treatment.
Keywords: cathepsin B, activable probe, fluorescent probe, CaCO3 nanoparticle, tumor imaging
Introduction
Tumor imaging is an indispensable tool during the whole process of treatment. Traditional imaging modalities such as computed tomography (CT),1,2 positron emission tomography (PET),3 FDG-PET/CT,4 and magnetic resonance imaging5–7 are powerful tools for accurate diagnosis, staging, and visualization of tumors. The emerging of fluorescence imaging, which uses fluorescent molecules for surgical navigation, provides good supplementary to traditional imaging modalities. Optical and fluorescent imaging that aids the maximal tumor excision and minimal collateral damage provides great benefits for the outcomes and quality of life.8
To date, a variety of fluorescent imaging materials have been used in targeted surgery, including near-infrared fluorescent molecule/complexes,9,10 fluorescent nano-particles,11–15 and dual-modality PET/fluorescence probe.16 To minimize the off-target effect, the condition activated fluorescent probes have been developed to diminish the background noise, such as pH, enzyme, or redox-responsive probes.17–21 Self-quenching molecules, which can be turned on after cleavage of the attached quencher by tumor-specific enzymes, are valuable candidates for tumor detection.
Cathepsin B is a tightly regulated cysteine proteinase in normal cells.22 Overproduction of cathepsin B has been found in the initiation, proliferation, angiogenesis, invasion, and metastasis of many carcinomas.23–25 It is considered as a valuable diagnostic and therapeutic target for cancers and has been widely used in tumor imaging.7,26–28
In the present study, a pH-dependent, folate receptor-targeted, and cathepsin B activable CaCO3 nanoprobe for in vivo imaging of tumor in mice model was established. Scheme 1 shows the design of the CaCO3 nanoprobe. The fluorescent probe JF1 was synthesized by conjugating a substrate of cathepsin B using a self-immolative linker. JF1 was then loaded into the folate-PEG modified CaCO3 nanoparticles. These nanoparticles are relatively stable at normal physiological pH (7.3) in the blood circulation. After uptake by tumor cells via folate receptor, CaCO3 under the acidic pH tumor environment is decomposed quickly to release JF1. After the quencher is cleaved by cathepsin B, the fluorescence of JF2 is thus turned-on under exciting light. The tumor cells can be visualized using a 450 nm LED light source.
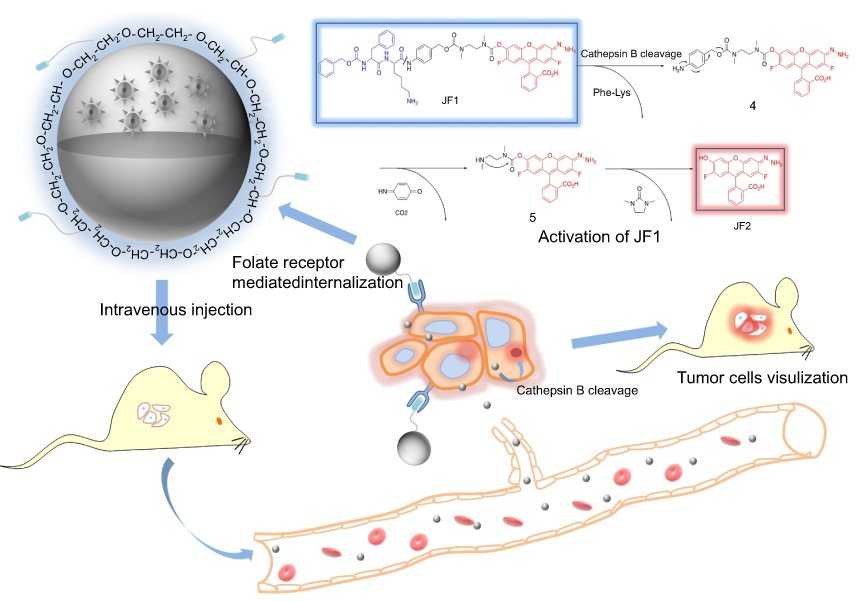 | Scheme 1 Schematic of the targeting and activation of JF1. (A) Activation of JF1 by cathepsin B. (B) In vivo targeting of tumor. |
Materials and methods
Materials and reagents
Folate-PEG and BSA were purchased from Aladdin (Shanghai, People's Republic of China). CA-074 was from ApexBio Technology (Houston, TX). DMEM and FBS were from Sijiqing Zhejiang Tianhang Biotechnology (Hangzhou, People's Republic of China). Other chemicals were all purchased from Standard commercial sources and were of analytical grade purity.
Chemical synthesis and CaCo3 nanoparticle preparation
Synthesis of the fluorescent probe JF1 is schematically shown in Scheme S1. Intermediate 1 was prepared according to the literature,28 while Oregon Green 2 was commercially available. Details of synthesis were available in supporting information.
CaCO3 nanoparticles were prepared using a modified emulsion method according to the previous reported methods.22,29 Briefly, 7.5 mL of cyclohexane and 1.77 mL Triton X-100 were mixed thoroughly for 10 mins, followed by adding 400 µL mixture of calcium chloride (0.03 M) and compound JF1 (0.01 M). The mixture was agitated vigorously with a magnetic stirrer to form a well-dispersed water-in-oil emulsion. After that, 40 µL of sodium carbonate (0.28 M) was added and mixed under moderate magnetic stirring. After mixing, the above solution was turned to sonication (15 s, 3 times) to form the CaCO3 nanoparticles. Nanoparticles were collected by centrifugation at 9,000× g for 10 mins and washed with ultrapure water. The pellets were dispersed in 500 μL of PEG water solution (folate-PEG, 3 mg/mL). The folate-PEG modified CaCO3 nanoparticles were collected by centrifugation at 9,000× g for 10 mins.
Zeta potential of the synthesized CaCO3 nanoparticles was measured using a Malvern Zetasizer Nano ZS instrument. Their UV-vis absorption changes were monitored with a UV-visible absorbance spectrophotometer (PerkinElmer Lambda 605S UV/Vis spectrometer) with deionized water as the blank. Scanning electron microscopy (SEM) micrographs were obtained using SEM-Jeol, model: JSM-6360 (Jeol, Germany). The CaCO3 nanoparticles were coated with gold using Sputter Coater, model: JFC-1600 (Jeol, Germany).
Release profile of CaCo3 nanoprobe under different pH conditions
The release and lighting-up of fluorescent probe was tested by exposure of CaCO3 nanoparticles to PBS (10 mM) with different pH (5.5, 6, 6.5, 7.3). Briefly, cathepsin B was added into 0.5 mL of PBS with a final concentration of 0.6 U/mL. Then, 0.5 mL of 10 µg/mL of CaCO3 that suspended in PBS nanoparticles was added. The fluorescence intensity was recorded by UV-vis spectroscopy. To further test the specificity of this probe, 5 µg/mL of CA-074 was added in PBS (PH 5.5) to inhibit the function of cathepsin B.
Cell culture and cell uptake behavior
MCF7 cells purchased from ATCC were cultured in DMEM supplemented with 10% FBS at 37°C and 5% CO2. Cells were seeded in 48-well plates. After 24 hrs of incubation, 10 μL of CaCO3 nanoparticle solution in DMEM media was added into each well, with a final concentration of 10 μg/mL. Cells were observed at 488 nm after twice washing with DMEM media.
In vivo tumor imaging
Tumor-bearing mice were established by injection 1×10⁶ MCF7 cells into the right flank of nude mice. The mice were used for tumor imaging when tumor volume reached approximately 0.5–1 cm3. The mice were anesthetized with 1% pentobarbital sodium (15 mg/kg). Then, 0.1 mg CaCO3 nanoparticles in 100 μL PBS were administrated via tail vein injection. Images were analyzed using Living Image 4.3.1 software (Xenogen).
Major organs, including heart, liver, spleen, lung, and kidney, were excised from tumor-bearing mice 1 week after CaCO3 nanoparticles injection. Tissue was first washed with PBS and fixed with 4% formaldehyde. It was then embedded in paraffin and sliced into 5 µm thickness sections. The sections were stained with H&E and observed under optical microscope (BX 51, Olympus, Japan).
All animal procedures were approved by the Ethics Committee of the Fifth Affiliated Hospital of Guangzhou Medical University prior to the commencement of the study. Mice were maintained in randomly assigned cohorts in the pathogen-free vivarium with temperature controlled, light cycled rooms of Guangzhou Medical University. All the mice were fed ad libitum. All animal procedures were in compliance with the relevant laws and Institutional Animal Care and Use Committee of the Guangzhou Medical University.
Results and discussion
Characterization of fluorescent probe
The molecular weight of JF1 is confirmed to be 1055.1 Da (Supporting Information). The probe shows an absorption peak at 451 nm and an emission peak at 524 nm (Figure 1A). The quenched probe (cathepsin B-activable substrate protected) shows weak fluorescence. A 21-fold of fluorescence is restored in 30 mins in the presence of 0.1 U/mL cathepsin B (Figure 1B).
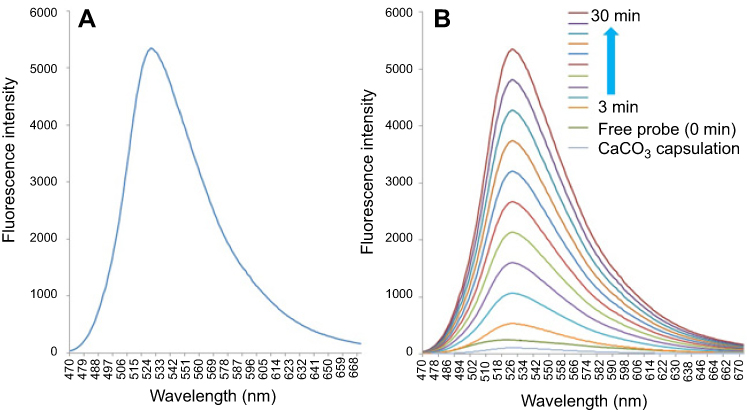 | Figure 1 Optical characterization of JF1. (A). Excitation and emission spectra of JF1. (B). Emission spectra of JF1 and JF1 loaded CaCO3 nanoparticle under cathepsin (B). |
Characterization and release profile of fluorescent probe embedded CaCo3 nanoparticles
CaCO3 nanoparticle has a weak negative zeta potential (−4 mV), which decreases to −18 mV after the coating of folate-PEG (Figure 2A). The average diameter of CaCO3 nanoparticles is 200 nm (Figure 2B). It is interesting that the packaging of probe into CaCO3 nanoparticles further reduces its fluorescence background by half (Figure 1B).
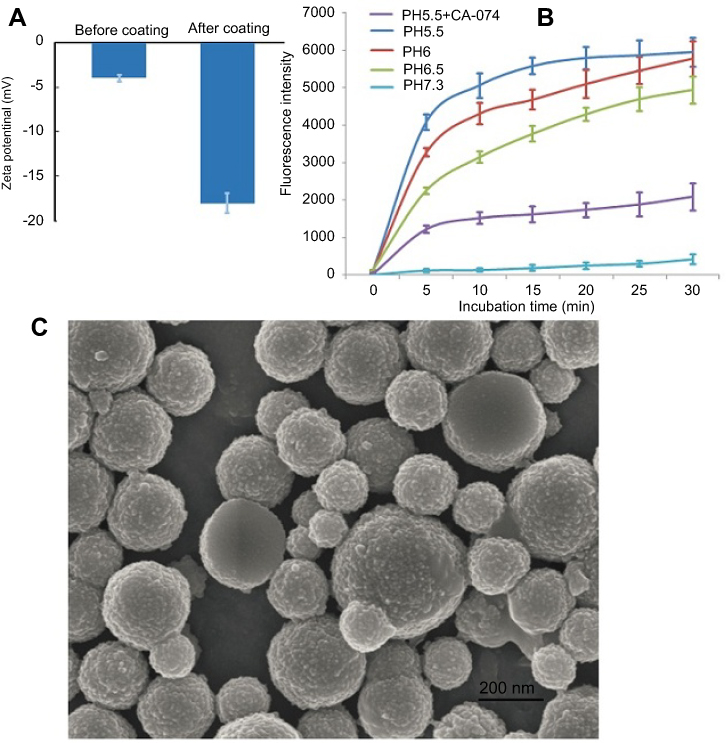 | Figure 2 Characterization and release profile of CaCO3 nanoparticles. (A). Zeta potential of CaCO3 nanoparticles before and after folate-PEG modification. (B). Emission spectra of CaCO3 nanoparticles under different PH conditions. (C). SEM of CaCO3 nanoparticles. Scale bar: 200 nm.Abbreviation: SEM, scanning electron microscope. |
The release and lighting-up of CaCO3 nanoprobe were tested by incubating 10 µg/mL CaCO3 with 0.3 U/mL cathepsin B at three different pH conditions. As shown in Figure 2C, fluorescence intensity has a fast rate of increment in the first 8 mins and reaches a plateau in 20–30 mins in a pH 5.5 buffer. The lighting-up of fluorescent probe is relatively slower at higher pH conditions (pH=6, 6.5). CaCO3 nanoparticles are stable at pH 7.3 as week fluorescence is detected during the whole experiment.
To further assess the targeting ability, a cathepsin B inhibitor CA-074 was added into the acidic PBS (pH=5.5) to block the lighting-up of JF1. As expected, fluorescence decreased significantly compared to these without CA-074 treatment (Figure 2C). Therefore, the present nanoprobe can be a good photographic agent for imaging of tumors with overexpression of cathepsin B.
In vitro image of tumor cells
Parallel experiments were carried out in MCF7 cells and fibroblast cells. The background fluorescence was very low in the supernatant, which was in accordance with the release profile in PBS. MCF7 cells showed high intensity of fluorescence after 30 mins of incubation. No fluorescence was detected in fibroblast cells after 30 mins of incubation. The fluorescence is very weak in fibroblast cells that have low level of cathepsin B expression after 24 hrs of incubation (Figure 3). It is noteworthy that the fluorescence localizes in cytoplasm rather than on the cell surface, indicating the successful internalization and dissolution of nanoparticles.
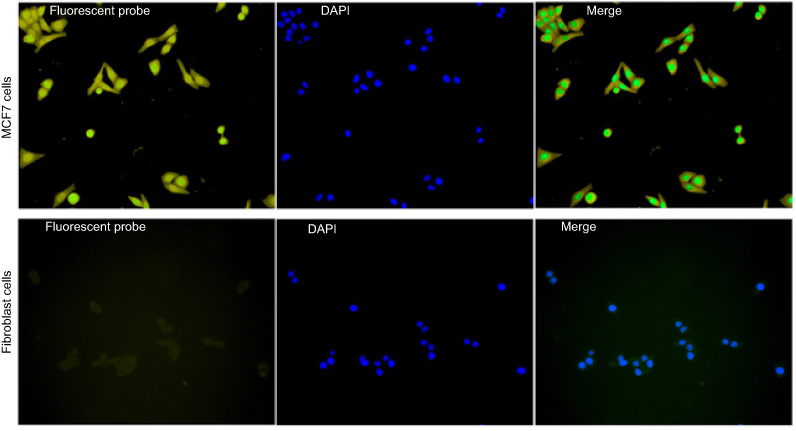 | Figure 3 In vitro imaging of MCF7 cells using CaCO3 nanoprobe. The upper row shows MCF7 cells incubated with nanoprobe for 30 mins. The second row shows fibroblast cells incubated with nanoprobe for 24 hrs. |
In vivo image of tumor cells
Nude mice baring MCF7 tumor nodule were injected with CaCO3 nanoparticles via tail intravenous injection. Mice were then observed under a Living Image System. Fluorescence was observed in one of the tumor-bearing mice at 5 mins after injection and the intensity increased gradually over time. The tumor was visualized in the other mouse at 10 mins after injection (Figure 4). The fluorescence intensity was proportional to the tumor load (Figure S1). Due to the double “turn-off” ability of the probe, there was no detectable fluorescence in normal tissues (Figure S2).
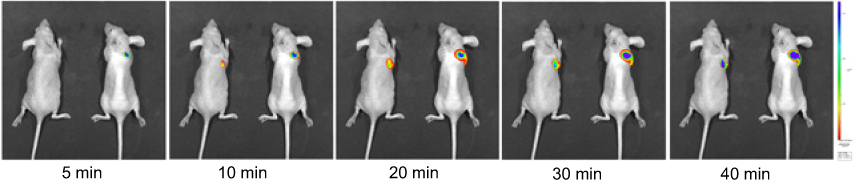 | Figure 4 In vivo imaging of MCF7 baring mice using CaCO3 nanoprobe. |
The toxicity of nanoparticles is also an important parameter that needs to be analyzed before clinical applications. In the present study, major organs of mice received nanoparticles treatment were subjected to histology analysis. As shown in Figure 5, no visible pathological change was found in heart, liver, spleen, lung, and kidney in 1 week after treatment. The histology results indicated the good biocompatibility of this probe. However, chronic toxicity tests are still needed to confirm its safety for in vivo applications.
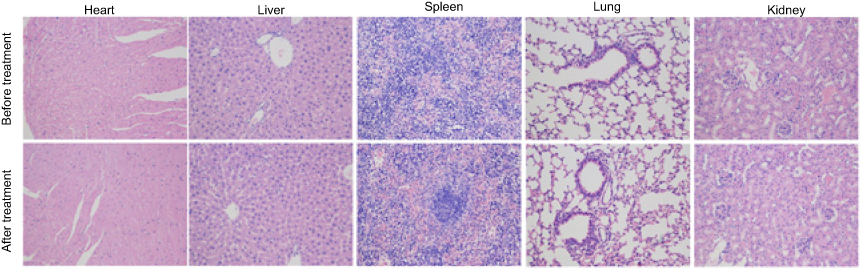 | Figure 5 Histology analysis of heart, liver, spleen, lung, and kidney. No pathological change was observed in these tissues; 20 × magnification. |
Conclusion
Since pH decrease is found in most solid tumors due to increased fermentative metabolism and poor perfusion, pH-responsive materials have been developed as a general strategy for tumor targeting.30 CaCO3 nanoparticles exhibited promising potential as tumor-targeting carriers owing to its pH-sensitivity and biocompatibility.31 Furthermore, CaCO3 nanoparticles can also modulate local pH and inhibit tumor growth in vivo.32
The results demonstrate that this CaCO3 nanoparticle enables fast release of JF1 into cytoplasm of tumor cells and maintains its intactness in the blood circulation. The release profile is similar to the reported studies, in which CaCO3 nanoparticle is used as pH response drug delivery carriers.22,32,33 The protection of probe by nanoparticles can not only lower the signal background by reducing off-target effect, but also delay its clearance from circulation, increasing tumor cell absorption.
In summary, a cathepsin B activable fluorescent probe was synthesized and loaded into CaCO3 nanoparticles. This nanoparticle shows good stability in neutral pH condition, and the fluorescence background is very low. The pH-dependent and cathepsin B gated “turn-on” properties of the nanoprobe enable precise and fast indication of tumors both in vitro and in vivo. This strategy of controlled drug release, consistent of pH response (acidic endosome/lysosome), can also be an efficient drug release modality for tumor treatment.
Acknowledgments
This work was supported by the National Natural Science Foundation of China (81602608, 81703333, 21402204 and 31671933), Natural Science Foundation of Guangdong (020204003). The authors are also grateful to the support from Nanshan Scholar Program of Guangzhou Medical University (B185006006008 and B185006006009).
Disclosure
The authors report no conflicts of ineterest in this work.
References
1. Singh D, Kumar R, Das A, Varma SC, Mittal BR. Fluorine-18-2-fluoro-2-deoxy-D-glucose positron emission tomography/computed tomography masquerading as a case of sporadic malignant peripheral nerve sheath tumor of lower extremity presenting as massive lower limb edema. World J Nucl Med. 2017;16(4):324–327. doi:10.4103/1450-1147.215494
2. Leufkens AM, van Den Bosch MA, van Leeuwen MS, Siersema PD. Diagnostic accuracy of computed tomography for colon cancer staging: a systematic review. Scand J Gastroenterol. 2011;46(7–8):887–894. doi:10.3109/00365521.2011.574732
3. Morbelli S, Conzi R, Campus C, et al. Contrast-enhanced [18 F] fluorodeoxyglucose-positron emission tomography/computed tomography in clinical oncology: tumor-, site-, and question-based comparison with standard positron emission tomography/computed tomography. Cancer Imaging. 2014;14:10.
4. Xia T, Guan Y, Chen Y, Li J. Askin tumor: CT and FDG-PET/CT imaging findings and follow-up. Medicine (Baltimore). 2014;93(6):e42. doi:10.1097/MD.0000000000000042
5. Haraldsdottir KH, Jonsson T, Halldorsdottir AB, Tranberg KG, Asgeirsson KS. Tumor size of invasive breast cancer on magnetic resonance imaging and conventional imaging (mammogram/ultrasound): comparison with pathological size and clinical implications. Scand J Surg. 2017;106(1):68–73. doi:10.1177/1457496916631855
6. Ma Z, Chen X, Huang Y, et al. MR diffusion-weighted imaging-based subcutaneous tumour volumetry in a xenografted nude mouse model using 3D slicer: an accurate and repeatable method. Sci Rep. 2015;5(15653):15653. doi:10.1038/srep15653
7. Ogbomo SM, Shi W, Wagh NK, Zhou Z, Brusnahan SK, Garrison JC. 177Lu-labeled HPMA copolymers utilizing cathepsin B and S cleavable linkers: synthesis, characterization and preliminary in vivo investigation in a pancreatic cancer model. Nucl Med Biol. 2013;40(5):606–617. doi:10.1016/j.nucmedbio.2013.01.011
8. Bu L, Shen B, Cheng Z. Fluorescent imaging of cancerous tissues for targeted surgery. Adv Drug Deliv Rev. 2014;76:21–38. doi:10.1016/j.addr.2014.07.008
9. Jo D, Hyun H. Structure-inherent targeting of near-infrared fluorophores for image-guided surgery. Chonnam Med J. 2017;53(2):95–102. doi:10.4068/cmj.2017.53.2.95
10. Li L, Shi W, Wu X, Li X, Ma H. In vivo tumor imaging by a gamma-glutamyl transpeptidase-activatable near-infrared fluorescent probe. Anal Bioanal Chem. 2018;16(10):018–1181.
11. Gonda K, Watanabe M, Tada H, et al. Quantitative diagnostic imaging of cancer tissues by using phosphor-integrated dots with ultra-high brightness. Sci Rep. 2017;7(1):7509. doi:10.1038/s41598-017-06534-z
12. Haghiralsadat F, Amoabediny G, Sheikhha MH, Forouzanfar T, Helder MN, Zandieh-Doulabi B. A novel approach on drug delivery: investigation of a new nano-formulation of liposomal doxorubicin and biological evaluation of entrapped doxorubicin on various osteosarcoma cell lines. Cell J. 2017;19(Suppl 1):55–65. doi:10.22074/cellj.2017.4502
13. Huang KW, Chieh JJ, Yeh CK, et al. Ultrasound-induced magnetic imaging of tumors targeted by biofunctional magnetic nanoparticles. ACS Nano. 2017;11(3):3030–3037. doi:10.1021/acsnano.6b08730
14. Ge X, Dong L, Sun L, et al. New nanoplatforms based on UCNPs linking with polyhedral oligomeric silsesquioxane (POSS) for multimodal bioimaging. Nanoscale. 2015;7(16):7206–7215. doi:10.1039/c5nr00950b
15. Dai Z, Ma H, Tian L, et al. Construction of a multifunctional nanoprobe for tumor-targeted time-gated luminescence and magnetic resonance imaging in vitro and in vivo. Nanoscale. 2018;10(24):11597–11603. doi:10.1039/c8nr03085e
16. Deng H, Wang H, Wang M, Li Z, Wu Z. Synthesis and evaluation of 64Cu-DOTA-NT-Cy5.5 as a dual-modality PET/fluorescence probe to image neurotensin receptor-positive tumor. Mol Pharm. 2015;12(8):3054–3061. doi:10.1021/acs.molpharmaceut.5b00325
17. Wang X, Chen H, Zhang K, et al. An intelligent nanotheranostic agent for targeting, redox-responsive ultrasound imaging, and imaging-guided high-intensity focused ultrasound synergistic therapy. Small. 2014;10(7):1403–1411. doi:10.1002/smll.201302846
18. Li S, Hu K, Cao W, et al. pH-responsive biocompatible fluorescent polymer nanoparticles based on phenylboronic acid for intracellular imaging and drug delivery. Nanoscale. 2014;6(22):13701–13709. doi:10.1039/c4nr04054f
19. Tantama M, Hung YP, Yellen G. Imaging intracellular pH in live cells with a genetically encoded red fluorescent protein sensor. J Am Chem Soc. 2011;133(26):10034–10037. doi:10.1021/ja202902d
20. Salaun M, Peng J, Hensley HH, et al. MMP-13 in-vivo molecular imaging reveals early expression in lung adenocarcinoma. PLoS One. 2015;10(7):e0132960. doi:10.1371/journal.pone.0132960
21. Freskos JN, Asmelash B, Gaston KR, et al. Design and synthesis of MMP inhibitors with appended fluorescent tags for imaging and visualization of matrix metalloproteinase enzymes. Bioorg Med Chem Lett. 2013;23(20):5566–5570. doi:10.1016/j.bmcl.2013.08.050
22. Sang Kyoon Kim MBF, Huang L. Targeted delivery of EV peptide to tumor cell cytoplasm using lipid coated calcium carbonate nanoparticles. Cancer Letters. 2012;334(2):311–318. doi:10.1016/j.canlet.2012.07.011
23. Aggarwal N, Sloane BF. Cathepsin B: multiple roles in cancer. Proteomics Clin Appl. 2014;8(5–6):427–437. doi:10.1002/prca.201300105
24. Bian B, Mongrain S, Cagnol S, et al. Cathepsin B promotes colorectal tumorigenesis, cell invasion, and metastasis. Mol Carcinog. 2016;55(5):671–687. doi:10.1002/mc.22312
25. Ruan J, Zheng H, Rong X, et al. Over-expression of cathepsin B in hepatocellular carcinomas predicts poor prognosis of HCC patients. Mol Cancer. 2016;15(17):17. doi:10.1186/s12943-016-0503-9
26. Gondi CS, Rao JS. Cathepsin B as a cancer target. Expert Opin Ther Targets. 2013;17(3):281–291. doi:10.1517/14728222.2013.740461
27. Habibollahi P, Figueiredo JL, Heidari P, et al. Optical imaging with a cathepsin B activated probe for the enhanced detection of esophageal adenocarcinoma by dual channel fluorescent upper GI endoscopy. Theranostics. 2012;2(2):227–234. doi:10.7150/thno.4088
28. Kisin-Finfer E, Ferber S, Blau R, Satchi-Fainaro R, Shabat D. Synthesis and evaluation of new NIR-fluorescent probes for cathepsin B: ICT versus FRET as a turn-ON mode-of-action. Bioorg Med Chem Lett. 2014;24(11):2453–2458. doi:10.1016/j.bmcl.2014.04.022
29. Zhou C, Chen T, Wu C, et al. Aptamer CaCO3 nanostructures: a facile, pH-responsive, specific platform for targeted anticancer theranostics. Chem Asian J. 2015;10(1):166–171. doi:10.1002/asia.201403115
30. He X, Li J, An S, Jiang C. pH-sensitive drug-delivery systems for tumor targeting. Ther Deliv. 2013;4(12):1499–1510. doi:10.4155/tde.13.120
31. Maleki Dizaj S, Barzegar-Jalali M, Zarrintan MH, Adibkia K, Lotfipour F. Calcium carbonate nanoparticles as cancer drug delivery system. Expert Opin Drug Deliv. 2015;12(10):1649–1660. doi:10.1517/17425247.2015.1049530
32. Som A, Raliya R, Tian L, et al. Monodispersed calcium carbonate nanoparticles modulate local pH and inhibit tumor growth in vivo. Nanoscale. 2016;8(25):12639–12647. doi:10.1039/c5nr06162h
33. Min KH, Min HS, Lee HJ, et al. pH-controlled gas-generating mineralized nanoparticles: a theranostic agent for ultrasound imaging and therapy of cancers. ACS Nano. 2015;9(1):134–145. doi:10.1021/nn506210a
Supplementary materials
Scheme S1. Synthesis of JF-1.
Chemical synthesis
2-(6-(((2-((((4-(2-(2-(((benzyloxy)carbonyl)amino)-3-phenylpropanamido)-6-((1-(4,4-dimethyl-2,6-dioxocyclohexylidene)-3-methylbutyl)amino)hexanamido)benzyl)oxy)carbonyl)(methyl)amino)ethyl)(methyl)carbamoyl)oxy)-2,7-difluoro-3-oxo-3H-xanthen-9-yl)benzoic acid (3).
To a solution of 1 (132.7 mg, 0.145 mmol) in pyridine (3.0 mL) was added 2 (53.5 mg, 0.145 mmol). The resulting mixture was stirred at room temperature overnight until TLC indicated the reaction was completed. The reaction mixture was diluted with EtOAc and washed with 1N HCl followed by brine. The organic layer was separated and dried over anhydrous MgSO4, filtered and the solvent was evaporated under reduced pressure. The crude product was purified by column chromatography on silica gel to give compound 3 (95.3 mg, 52.7%) as a yellow solid. 1H NMR (400 MHz, CDCl3, δ): 13.58 (1H, brs), 8.05 (1H, d, J = 7.1), 7.76-7.60 (4H, m), 7.40-7.16 (13H, m), 6.93 (2H, m), 6.51-6.40 (2H, m), 5.18-5.03 (4H, m), 4.66 (2H, m), 3.69-3.41 (6H, m), 3.18-2.96 (10H, m), 2.37 (4H, s), 2.03 −1.97 (2H, m), 1.77-1.73 (1H, m), 1.68-1.62 (2H, m), 1.53 (2H, m), 1.02 (6H, d, J = 6.6), 0.95 (6H, s); MS (ESI) m/z: 1247.4 [M+H]+.
(Z)-2-(6-(((2-((((4-(6-amino-2-(2-(((benzyloxy)carbonyl)amino)-3-phenylpropanamido)hexanamido)benzyl)oxy)carbonyl)(methyl)amino)ethyl)(methyl)carbamoyl)oxy)-2,7-difluoro-3-hydrazineylidene-3H-xanthen-9-yl)benzoic acid (JF-1).
To a solution of 3 (95.3 mg, 0.076 mmol) in DMF (2.0 mL) was added 15 μL of hydrazine monohydrate (64–65% solution in water). The reaction mixture was then stirred for 2 hrs at room temperature and monitored by TLC. Upon completion, the solvent was removed under reduced pressure and the crude product was purified by preparative HPLC to afford JF-1 (23.1 mg, 28.8%) as a yellow solid. 1H NMR (400 MHz, CD3OD, δ): 7.92 (1H, s), 7.58-7.28 (16H, m), 7.06 (2H, d, J = 16.4), 6.83 (1H, m), 6.46 (1H, d, J = 9.2), 6.32 (1H, d, J = 10.4), 5.05 (4H, d, J = 10.4), 4.49-4.28 (2H, m), 3.65-3.48 (8H, m), 3.00-2.88 (8H, m), 1.78 (1H, d, J = 6.0), 1.57-1.44 (4H, m); 13C NMR (125 MHz, CD3OD, δ): 175.48, 172.25, 170.01, 156.39, 155.97, 155.26, 154.65, 154.55, 153.38, 143.93, 142.62, 141.95, 138.30, 134.04, 131.89, 129.90, 128.45, 128.39, 128.70, 127.98, 128.60, 128.19, 120.79, 115.03, 115.12, 108.83, 100.62, 67.54, 67.34, 54.03, 53.29, 50.88, 49.02, 40.62, 38.63, 32.43, 32.26,30.49, 27.33, 23.72; MS (ESI): 1055.5[M+H]+.
Prepare frozen tissue sections
Tumor was resected and was used for the preparation of frozen tissue sections immdetaly as in the following:
- Place the freshly dissected tumor tissue on to a pre-labeled tissue base mold.
- Cover the entire tissue with cryo-embedding media.
- Transfer the frozen tissue to a cryotome cryostat to equilibrate the temperature of the tissue.
- Section the frozen tissue into a 5 µm using the cryotome.
- Fixation with 75% ethanol and observed under fluorescence microscope.
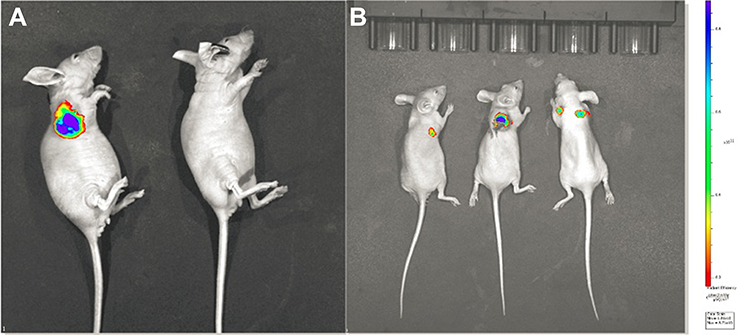 | Figure S1 The fluorescence intensity of mice with different tumor loads. (A). Mouse without tumor shows no fluorescence (left) and tumor-bearing mouse has high fluorescence. (B). Fluorescence intensity is higher in larger tumor (middle) than in the smaller ones. |
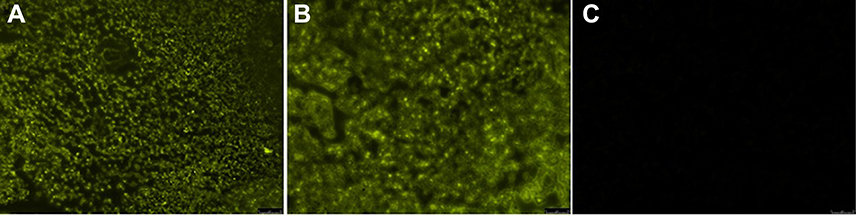 | Figure S2 Frozen section of tumor tissue and adjacent normal tissue. (A). Tumor tissue with 20× magnification. (B). Tumor tissue with 40× magnification. (C). Adjacent normal tissue. |
 © 2019 The Author(s). This work is published and licensed by Dove Medical Press Limited. The
full terms of this license are available at https://www.dovepress.com/terms
and incorporate the Creative Commons Attribution
- Non Commercial (unported, 3.0) License.
By accessing the work you hereby accept the Terms. Non-commercial uses of the work are permitted
without any further permission from Dove Medical Press Limited, provided the work is properly
attributed. For permission for commercial use of this work, please see paragraphs 4.2 and 5 of our Terms.
© 2019 The Author(s). This work is published and licensed by Dove Medical Press Limited. The
full terms of this license are available at https://www.dovepress.com/terms
and incorporate the Creative Commons Attribution
- Non Commercial (unported, 3.0) License.
By accessing the work you hereby accept the Terms. Non-commercial uses of the work are permitted
without any further permission from Dove Medical Press Limited, provided the work is properly
attributed. For permission for commercial use of this work, please see paragraphs 4.2 and 5 of our Terms.