Back to Journals » International Journal of Nanomedicine » Volume 13
Personalized nanomedicine: a rapid, sensitive, and selective UV–vis spectrophotometry method for the quantification of nanostructured PEG-asparaginase activity in children’s plasma
Authors Zhang Y, Wang Y, Wang R, Shen Y, Xu J, Webster TJ ![]() , Fang Y
, Fang Y
Received 6 March 2018
Accepted for publication 10 July 2018
Published 15 October 2018 Volume 2018:13 Pages 6337—6344
DOI https://doi.org/10.2147/IJN.S167380
Checked for plagiarism Yes
Review by Single anonymous peer review
Peer reviewer comments 3
Editor who approved publication: Professor Lei Yang
Yong Zhang,1,* Yongren Wang,2,3,* Ru Wang,4 Yan Shen,4 Jing Xu,1 Thomas J Webster,5 Yongjun Fang2,3
1Department of Pharmacy, Children’s Hospital of Nanjing Medical University, Nanjing 210008, China; 2Department of Hematology and Oncology, Children’s Hospital of Nanjing Medical University, Nanjing 210008, China; 3Key Laboratory of Hematology, Nanjing Medical University, Nanjing 210008, China; 4State Key Laboratory of Natural Medicines, Department of Pharmaceutics, China Pharmaceutical University, Nanjing 210009, China; 5Department of Chemical Engineering, Northeastern University, Boston, MA 02115, USA
*These authors contributed equally to this work
Purpose: PEGylated asparaginase (PEG-ASNase), which hydrolyzes asparagine to ammonia and aspartic acid, is an effective nanostructured antitumor agent for acute lymphoblastic leukemia (ALL). In order to monitor the activity of PEG-ASNase in plasma and design an individualization project, a rapid and sensitive method to determine PEG-ASNase activity in plasma using ultraviolet–visible spectrophotometry was established.
Methods: PEG-ASNase is commonly used in acute lymphoblastic leukemia. With Nessler’s reagent as the chromogenic reagent of ammonia, a stable yellow complex was produced. The units of enzyme activity were defined as micromoles of ammonia released per minute.
Results: Calibration curves fitted by plotting the OD at 450 nm of the Nessler product vs concentration were linear in the range of 27.8–1,111.0 IU/L with r2=0.999. The lower limit of quantification for PEG-ASNase activity in human plasma was 20 IU/L with good accuracy and precision. The intra- and interday precision (relative standard deviation) values were below 10% and accuracy ranged from 90% to 110% at all quality control levels. Analytical recoveries were determined between 90% and 110% for all quality control samples.
Conclusion: This study proved that the Nessler method is well validated and can be successfully applied in the determination of plasma samples in the clinical setting for patients with ALL. It takes personalized nanomedicine to an entirely new level.
Keywords: PEG-ASNase, Nessler’s reagent, UV–vis spectrophotometry, enzyme activity, personalized nanomedicine, ALL, Nessler method, plasma
Introduction
A malignant tumor is one of the main causes of child mortality in China; being the most common malignancy in children, acute lymphoblastic leukemia (ALL) represents 70% of acute leukemia in children who are under 15 years old. The incidence of childhood ALL is three to four cases per 100,000 in children who are under 15 years old. Despite affecting children of all ages, incidence peaks are between 2 and 5 years of age, with a slight predominance among boys.1
L-asparaginase (L-ASNase) is a tetrameric enzyme produced endogenously by Escherichia coli and consists of identical 34.5 kDa subunits, which has become a potent antileukemic enzyme in the treatment of acute lymphoblastic leukemia in children and non-Hodgkin patients.2 After intravenous injection or intramuscular administration, the enzyme catalyzes the hydrolysis of L-asparagine (L-Asn), which is important for the biosynthesis of proteins, DNA, and RNA to ammonia and L-aspartic acid. As a result, asparagine in the plasma and extracellular fluid is eliminated.3 Normal tissue cells can synthesize asparagine in the presence of asparagine synthetase, while tumor cells, which depend on exogenous asparagine to grow, cannot synthesize asparagine due to a lack of asparagine synthetase, and asparaginase selectively blocks protein synthesis from the tumor cells and induces apoptosis.4,5 Moreover, the potential use of L-ASNase as a therapeutic agent against the extracellular pathogenic bacterium group A Streptococcus infections was recently proposed.6
There are three preparations of asparaginase: native enzyme from E. coli, PEGylated asparaginase (PEG-ASNase) from E. coli (Oncaspar® [Pegasparagase injection]), and native erwinia enzyme from Erwinia chrysanthemi asparaginase (Erwinaze).4 Different ASNase preparations from various biological sources (such as E. coli and Erwinia) have different pharmacokinetic properties (half-life from 16 hours for Erwinia to 33 hours for E. coli),7,8 even if E. coli ASNase obtained from different strains have different pharmacokinetic properties.9 The PEG-ASNase is L-ASNase, which is covalently conjugated to monomethoxypolyethylene glycol, and has a higher bioavailability with an extended blood circulating half-life (t1/2) and minimal immunogenicity10,11 compared with L-ASNase. Recently, a novel preparation GRASPA® (Erythrocyte encapsulated asparaginase) with L-ASNase encapsulated in erythrocytes appears to be a promising product with a good safety profile for the treatment of ALL relapse and refractory.12
Nanostructured PEG-ASNase first entered clinical trials in 1984 as the conjugate could be safely used by patients who already developed allergic reactions to E. coli or Erwinia asparaginase due to low immunogenicity. However, treatment with PEG-ASNase is also accompanied with side effects, such as leukopenia, neurological seizures, anaphylaxis, coagulation abnormalities, and pancreatitis, which restrict its clinical applications.13 Therefore, conducting clinical drug monitoring and pharmacokinetic studies on the children who received a PEG-ASNase injection can ensure clinical safety and efficacy for early interventions. Even though PEG-ASNase is a clinically life-rescuing nanomedicine with preferable bioavailability, pharmaceutical quality control (QC) methods for determining the activity of PEG-ASNase in children’s plasma were hardly ever reported. Only L-ASNase activity determination methods in plasma samples have already been described14–17 by the glutamate dehydrogenase method,14 the Nessler method,15 the Berthelot method,16 and a gas-sensing electrode method.17 However, the reported analytical methods that refer to the determination of L-ASNase in plasma have numerous drawbacks, such as low selectivity, insufficient practical simplicity, and a relatively high, expensive cost with complicated biosample pretreatment.18 The Nessler method is most commonly used in clinical detection for its cost-effectiveness and convenience. In this method, PEG-ASNase catalyzes the hydrolysis of the generally nonessential amino acid Asn to aspartate acid and ammonia. The enzyme activity was determined by photometric detection of ammonia release after reaction with Nessler’s reagent. Using Nessler’s reagent as the chromogenic reagent of ammonia, a stable yellow complex is produced (Figure 1). Units of enzyme activity are defined as micromoles of ammonia released per minute at 37°C.
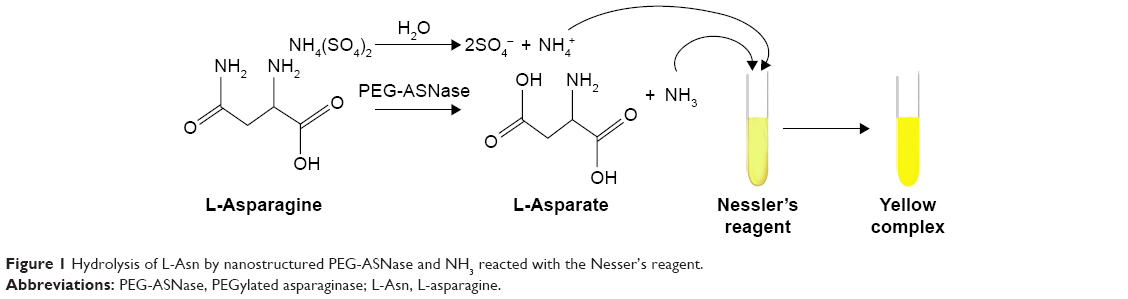 | Figure 1 Hydrolysis of L-Asn by nanostructured PEG-ASNase and NH3 reacted with the Nesser’s reagent. |
The goal of this study was to develop an accurate and precise activity assay of nanostructured PEG-ASNase in children’s plasma for pharmaceutical QC and as a model of personalized nanomedicine. Personalized nanomedicine refers to assays that can tailor the nano-biomolecular treatment of diseases through apriori approaches. The ammonium sulfate standard solutions are usually used to establish a calibration curve for determining the activity of the PEG-ASNase according to previously published references.19,20 In order to validate the recovery and reproducibility of this method, both ammonium sulfate and PEG-ASNase were utilized for this method evaluation.
Materials and methods
Materials
Ammonium sulfate, asparagine, trichloroacetic acid (TCA), potassium hydroxide monosodium phosphate, and disodium hydrogen phosphate were obtained from Chemical Reagent Co., Ltd (Nanjing, China, Analysis Grade). PEG-ASNase (3,750 IU, 5 mL) was purchased from Jiangsu Hengrui Medicine Co., Ltd (Jiangsu, China); mercury (II) iodide (purity >99%, 19270), and potassium iodide (AR) were provided by Xiya Reagent. Deionized (DI) water was freshly made in the laboratory. All other reagents were of analytical grade. The plasma samples were collected from the Children’s Hospital of Nanjing Medical University and kept at −20°C.
Nessler method
In a glass flask volumetric, 7 g of sodium iodide and 10 g of mercury (II) iodide were weighed with a BSA124S electronic balance [Sartorius Scientific Instruments (Beijing) Co., Limited, Beijing, China] and dissolved in 10 mL of water. Then, 24 g of sodium hydroxide was dissolved in 70 mL of water. The above two solutions were mixed to obtain Nessler’s reagent. 0.50 mL of ammonium sulfate solution was pipetted into a test tube, followed by 4.0 mL DI water and 0.5 mL of Nessler’s reagent. The optical density (OD) was measured by spectrophotometry (752 ultraviolet–visible [UV–vis] Spectrophotometer, Shanghai Jinghua Technology Instrument Co., Ltd, Shanghai, China) at 450 nm after 15 minutes of reaction time.
Determination of nanostructured PEG-ASNase activity in plasma
The substrate solution consisted of 0.6630 g L-Asn dissolved in a 100 mL phosphate buffer solution previously adjusted to pH 8.0 with disodium hydrogen phosphate (0.2 M) by a PHS-3C Ph meter (Shanghai INESA Analytical Instrument Co., Ltd, Shanghai, China). As shown in Figure 2, 0.9 mL of the substrate solution was pipetted into a 2.0 mL Eppendorf tube and kept warm at 37°C in a HH-2 Intelligent digital thermostat water bath (Nan Jing Keer Equipment PTY., Ltd, Nanjing, China). A milliliter aliquot of the PEG-ASNase plasma sample was added and kept at 37°C for 45 minutes to fully consume the PEG-ASNase. Then, a quarter of milliliter aliquot of 25% (w/w) TCA was added for deproteination. The sample was mixed vigorously for 15 minutes and centrifuged at 5,000×g for 15 minutes (KDC-140HR high-speed refrigerated centrifuge, Anhui Zhongke Intelligent Hi-Tech Co., Ltd , Hefei, China). The supernatant 0.5 mL was taken and diluted with 4.0 mL of water, then 0.5 mL of Nessler’s reagent was added. The mixture was kept for 15 minutes at room temperature, and the OD sample was measured at 450 nm. To eliminate the matrix effect of the plasma, a quarter of a milliliter aliquot of 25% (w/w) TCA was mixed with 0.9 mL of the substrate at 37°C for 45 minutes, then a 0.1 mL aliquot of the PEG-ASNase plasma sample was added. After centrifugation (5,000×g for 15 minutes), 0.5 mL of the supernatant was taken and diluted with 4.0 mL of water, then 0.5 mL of Nessler’s reagent was added. The mixture was left to stand for 15 minutes at room temperature and the ODmatrix measured by spectrophotometry at 450 nm. Finally, the PEG-ASNase activity (ODsample−ODmatrix) was calculated by the calibration curves described below.
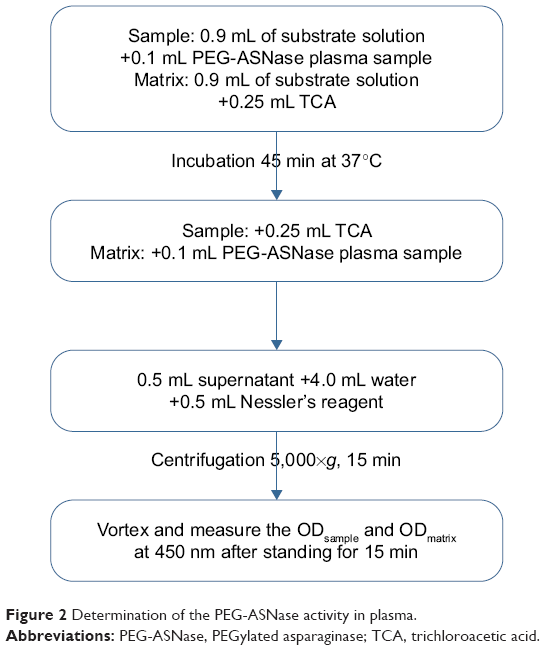 | Figure 2 Determination of the PEG-ASNase activity in plasma. |
Method evaluation
Selectivity
The selectivity indicates the extent the Nessler method can determine ammonia without interference from the enzyme reaction. The UV–vis scanning spectra between 200 and 600 nm of the sample solutions and the blank solution (matrix), which reacted with Nessler’s reagents, were both recorded on an Agilent 8453 scanning UV–vis spectrophotometer (Agilent Technologies, Santa Clara, CA, USA).
Linearity and lower limit of quantification (LLOQ)
Calibration curves were prepared by assaying standard plasma samples at nine concentrations of ammonium sulfate ranging from 0.05 to 2.00 mM. The linearity of each calibration curve was determined by plotting the nominal activity (x) of ammonium sulfate to the absorption (y, OD) of ammonium sulfate standard samples. Units of enzyme activity were defined as micromoles of ammonia released per minute.20 The LLOQ is defined as the lowest activity on the calibration curve; it was validated using an LLOQ sample for which an acceptable accuracy (%) ranged from 90% to 110% and a coefficient of variation <15% was obtained.
Precision and recovery
A stock solution of (25 mM) ammonium sulfate was obtained with 0.3303 g of ammonium sulfate dissolved and diluted in water. Different volumes of the stock solution were spiked into the blank plasma to obtain concentration levels of ammonium sulfate QC samples (0.25, 1.00, and 2.00 mM). Meanwhile, PEG-ASNase was diluted in water to obtain a stock solution (1,000 IU/mL). Different volumes of the stock solution were spiked into the blank plasma to obtain three different activity levels of PEG-ASNase QC samples (102.5, 550.5, and 966.9 IU/L).
Within a day, precision and accuracy were determined by analyzing five sets of spiked plasma samples of ammonium sulfate and PEG-ASNase at each QC level. The interday precision and accuracy were determined by analyzing five sets of spiked plasma samples of ammonium sulfate and PEG-ASNase at each QC level for 5 days. The concentration of each sample was calculated using the standard curve prepared and analyzed on the same day. The precision was expressed as the relative standard deviation (RSD). The accuracy of the method was evaluated by analyzing the QC samples spiked with standard solutions and expressed as a percentage error of measured concentrations (or activity) vs nominal concentrations (or activity).
To obtain the recovery and accuracy of ammonia from the plasma, comparison of the spiked value with the measured value at 0.25, 1.00, and 2.00 mM (n=5 for each concentration of ammonium sulfate used) was conducted. To obtain the recovery and accuracy of PEG-ASNase from the plasma, comparison of the spiked activity (102.5, 550.5, and 966.9 IU/L) of the QC samples with the measured QC samples (n=5 for each activity level of PEG-ASNase used) was conducted.
Stability
The short-term stability of the nanostructured PEG-ASNase QC samples and ammonium sulfate QC samples was assessed by determining the OD of the QC plasma samples, which were kept at room temperature for 24 hours with the Nessler’s reagent; the time far exceeded the routine preparation time of the samples. The long-term stability was evaluated by determining QC of the plasma samples, which were kept at low temperature (−4°C) for 7 days. All the experimental values were compared with the nominal values.
Sample collection
All procedures followed were in accordance with the ethical standards of the responsible committee on human experimentation (approval number: 201403001), which was approved by the Children’s Hospital of Nanjing Medical University Institutional Review Board. Written informed consent was obtained from the patients and their parents for being included in the study. Blood samples for the nanostructured PEG-ASNase activity were obtained from children who received the treatment with PEG-ASNase (dose: 2,500 IU/m2, for children with a body surface area <0.6 m2, the dose should be adjusted to 82.5 IU/kg, every 14 days). Blood samples were collected from 45 patients collected at predetermined time intervals and stored in heparinized tubes. Two milliliters of whole blood was drawn and centrifuged at 3,000 rpm for 5 minutes immediately. The supernatant was obtained and frozen at −20°C for asparaginase activity determination.
Results and discussion
Selectivity
Absorption spectra of the blank and sample solutions were obtained and shown in Figure 3A. The selectivity indicates the extent to which the Nessler method can determine the ammonia concentration without interference from the enzyme reaction. The noise of the equipment was strong at wavelengths <400 nm. The absorbance of the blank solution was negligible at 450 nm, while an obvious absorbance was observed for sample solutions; 450 nm was chosen as the specific wavelength for asparaginase detection, this is consistent with many other reports.18–20
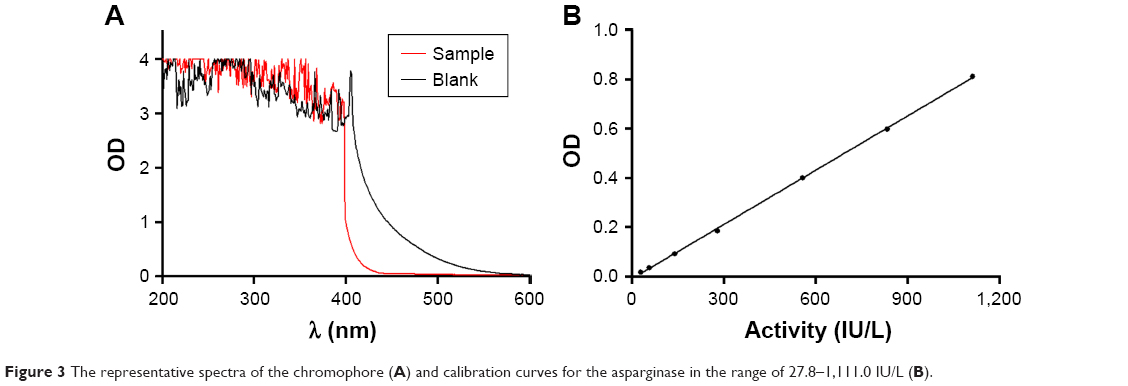 | Figure 3 The representative spectra of the chromophore (A) and calibration curves for the asparginase in the range of 27.8–1,111.0 IU/L (B). |
Linearity and LLOQ
The units of enzyme activity were defined as micromoles of ammonia released per minute at 37°C; the ammonia concentrations could convert to enzyme activity according to the calculations below:
|

where C is the concentration of the ammonium sulfate solutions, Vs is the volume of the supernatant used to react with the Nessler’s reagent, Vt is the total volume of the reaction mixture, Vp is the volume of the PEG-ASNase plasma sample, and t represents the reaction time between the supernatant and Nessler’s reagent.
The calibration graph (Figure 3B) was obtained by plotting OD with SD of the products of ammonium sulfate with Nessler’s reagent vs its concentration. A calibration curve was obtained by the linear regression analysis. Good linearity between OD and activity of the Nessler’s reagent was obtained for PEG-ASNase (Y=7.792*10^(−4)X−0.01913, r=0.999, n=7) in the range of 27.8–1,111.0 IU/L. The LLOQ for PEG-ASNase activity in human plasma was 20 IU/L with a coefficient of variation <15%.
Precision and recovery
For ammonium sulfate QC samples, the within-day precision, with RSD ranging from 1.1% to 2.1%, and the interday precision, with RSD ranging from 3.0% to 3.4%, indicated very good reproducibility of this method (Table 1). For the nanostructured PEG-ASNase QC samples, the within-day precision, with RSD ranging from 2.4% to 4.4%, and the interday precision, with RSD ranging from 5.1% to 10.0%, also had a good reproducibility. Also, high-recovery data were achieved at 0.25, 1.00, and 2.00 mM and 102.5, 550.5, and 966.9 IU/L, respectively.
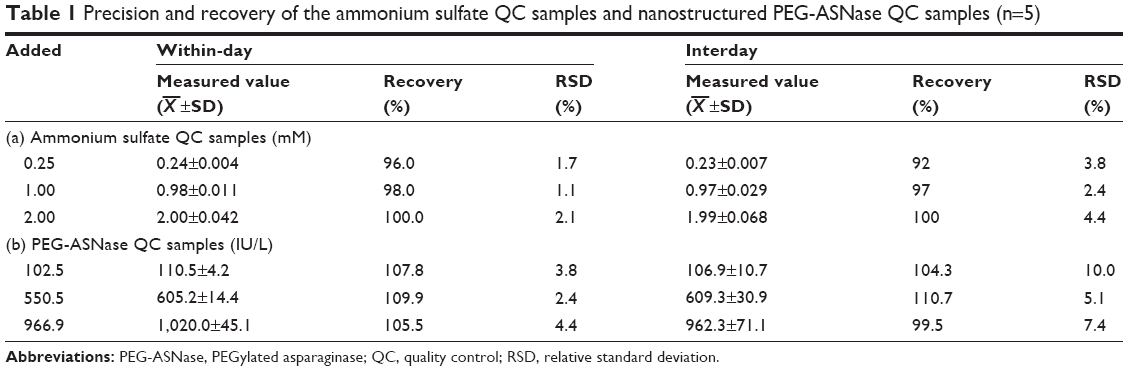 | Table 1 Precision and recovery of the ammonium sulfate QC samples and nanostructured PEG-ASNase QC samples (n=5) |
Stability
Table 2 shows that the short-term and long-term stability of both the products of the Nessler’s reagent with ammonium sulfate QC samples and the nanostructured PEG-ASNase QC samples were stable enough.
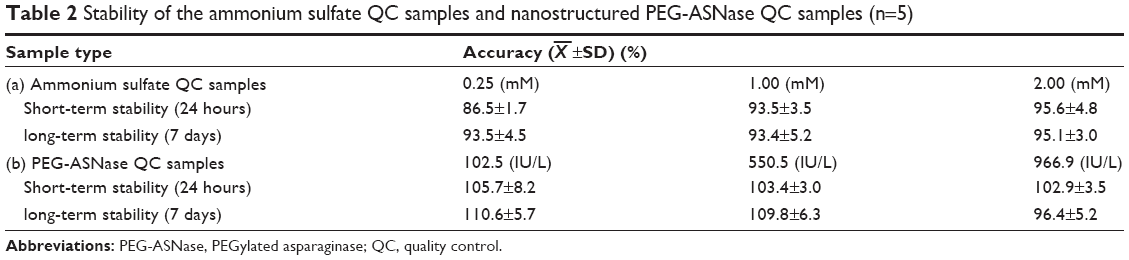 | Table 2 Stability of the ammonium sulfate QC samples and nanostructured PEG-ASNase QC samples (n=5) |
Sample collection
According to previous research,19,21 the limit of detection of the Nessler method is 20 IU/L, and plasma PEG-ASNase levels with activities over 100 IU/L were necessary for effective treatment. Table 3 shows 172 plasma PEG-ASNase activity levels collected from 45 patients, with about 82.6% of the sample activities exceeding the recommended plasma level of 100 IU/L, which could secure Asn depletion.
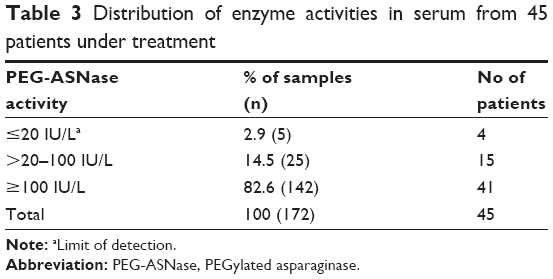 | Table 3 Distribution of enzyme activities in serum from 45 patients under treatment |
Figure 4 shows the representative nanostructured PEG-ASNase activity variations of eight patients during the treatment; there were seven patients with PEG-ASNase activity higher than 100 IU/L until 14 days. Moreover, the effective level could last for 20 days in four patients. This was consistent with the literature22 that the PEG-ASNase could maintain a relatively stable plasma concentration after intravenous administration. There was a significant difference in plasma PEG-ASNase activities individually, even if they were administered by the same dose. As a consequence, it is important to detect the real-time enzyme activity for effective individualized drug monitoring. In the present study, we found that there was no significant increase in the activity of asparaginase in one patient after the injection of PEG-ASNase, of whom the activity was always lower than the trough enzyme activities, which could guarantee the free Asn to was fully hydrolyzed. We thought the reason for this phenomenon was that the anti-PEG antibody23 was produced, which resulted in an alternative therapy for ALL. The activity of PEG-ASNase in the patients fluctuated considerably; this result was probably due to not only the individual variability but also the patients were too young.
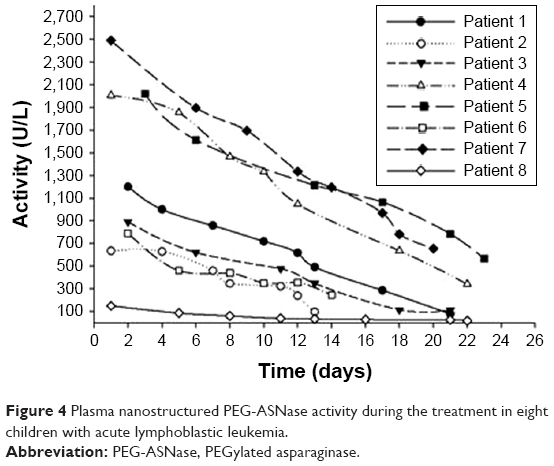 | Figure 4 Plasma nanostructured PEG-ASNase activity during the treatment in eight children with acute lymphoblastic leukemia. |
Conclusion
Glutamine is a conditionally essential acid and considered to be an important fuel for immune cells. It is the richest amine acid in human body. However, glutamine is a second substrate for asparaginase, and changes in glutamine metabolism have been considered as contributing to asparaginase-associated side effects.24,25 Ollenschläger et al26 observed that the concentration of glutamine fell to nearly undetectable levels after therapy. The hepatic protein synthesis is affected by glutamine deficiency, and they first demonstrated the deleterious effect of L-ASNase on glutamine homeostasis. The normal plasma concentration is 0.6–0.9 mM,27 which could be negligible in the determination of PEG-ASNase activity. The enzyme activity determined in our study was the remaining PEG-ASNase activity in the plasma during the whole ALL treatment, which was not related to the level of the amino acid concentration in the plasma. Additionally, we set the blank blood sample as a control group to minimize the impact of other substances such as glutamine in the plasma. The units of enzyme activity were defined as micromoles of ammonia released per minute. In this experiment, we used excess L-Asn as a substrate to detect the enzyme activity in the plasma; even if the glutamine existed, it could be hydrolyzed by PEG-ASNase, which was not related to the remaining PEG-ASNase activity in the plasma. Although PEG-ASNase was an essential element with proven therapeutic efficacy in the treatment of ALL, the adverse effect restricted its application.23 Besides, individual cases revealed considerable variation in the amount of serum enzyme activity. It would be a significant breakthrough for the therapeutic drug monitoring the concentration. PEG-ASNase was a sustained-release preparation of recombinant L-ASNase and had a relatively long half-life. It was injected every 2 weeks and could maintain a stable blood concentration (>100 IU/L) in theory.28 It was the key factor whether the activity of the PEG-ASNase could maintain above the trough enzyme activities for effective treatment. Moreover, physiological and pathological conditions can affect ammonia levels and cause significantly different individual plasma concentrations. Therefore, therapeutic drug monitoring could ensure the effectiveness of the clinical treatment. Furthermore, it is crucial to make clinical adjustment based on the potential pharmacokinetic differences between the courses of treatment.
In this study, a rapid, sensitive, and selective UV–vis spectrophotometry method for the quantification of nanostructured PEG-ASNase activity in plasma was established. Based on the results presented here, this method had a simple biosample pretreatment and short analysis time with good recovery and reproducibility. Additionally, this method met the requirements of desired throughput, speed, and sensitivity in the biosample analysis.19 In summary, this study was definitely applicable to monitor the activity of nanostructured PEG-ASNase in plasma and improve the safety and efficacy of drug therapy, as well as provide insights into how personalized nanomedicine be used for ALL treatment monitoring.
Acknowledgment
This work was funded by the Key Project supported by the Medical Science and Technology Development Foundation, Nanjing Department of Health (number YKK14112).
Disclosure
The authors report no conflicts of interest in this work.
References
Lustosa de Sousa DW, de Almeida Ferreira FV, Cavalcante Félix FH, de Oliveira Lopes MV. Acute lymphoblastic leukemia in children and adolescents: prognostic factors and analysis of survival. Rev Bras Hematol Hemoter. 2015;37(4):223–229. | ||
Kawedia JD, Rytting ME. Asparaginase in acute lymphoblastic leukemia. Clin Lymphoma Myeloma Leuk. 2014;14(Suppl):S14–S17. | ||
Appel IM, Kazemier KM, Boos J, et al. Pharmacokinetic, pharmacodynamic and intracellular effects of PEG-asparaginase in newly diagnosed childhood acute lymphoblastic leukemia: results from a single agent window study. Leukemia. 2008;22(9):1665–1679. | ||
Panetta JC, Gajjar A, Hijiya N, et al. Comparison of native E. coli and PEG asparaginase pharmacokinetics and pharmacodynamics in pediatric acute lymphoblastic leukemia. Clin Pharmacol Ther. 2009;86(6):651–658. | ||
Qiao J, Qi L, Mu X, Chen Y. Monolith and coating enzymatic microreactors of L-asparaginase: kinetics study by MCE-LIF for potential application in acute lymphoblastic leukemia (ALL) treatment. Analyst. 2011;136(10):2077–2083. | ||
Baruch M, Belotserkovsky I, Hertzog BB, et al. An extracellular bacterial pathogen modulates host metabolism to regulate its own sensing and proliferation. Cell. 2014;156(1–2):97–108. | ||
Rizzari C, Zucchetti M, Conter V, et al. L-asparagine depletion and L-asparaginase activity in children with acute lymphoblastic leukemia receiving i.m. or i.v. Erwinia C. or E. coli L-asparaginase as first exposure. Ann Oncol. 2000;11(2):189–193. | ||
Avramis VI, Panosyan EH. Pharmacokinetic/pharmacodynamic relationships of asparaginase formulations: the past, the present and recommendations for the future. Clin Pharmacokinet. 2005;44(4):367–393. | ||
Albertsen BK, Schrøder H, Jakobsen P, Müller H-J, Carlsen NT, Schmiegelow K. Monitoring of Erwinia asparaginase therapy in childhood ALL in the Nordic countries. Br J Clin Pharmacol. 2015;52(4):433–437. | ||
Ho DH, Brown NS, Yen A, et al. Clinical pharmacology of polyethylene glycol-L-asparaginase. Drug Metab Dispos. 1986;14(3):349. | ||
Ye L, Gh Y, Pan M, Ding MQ, Guo F. Adverse effect of L-asparaginase during its treatment of childhood acute lymphoblastic leukemia. Anhui Med Pharm J. 2011;15:365–366. | ||
Dinndorf PA, Gootenberg J, Cohen MH, Keegan P, Pazdur R. FDA drug approval summary: pegaspargase (Oncaspar) for the first-line treatment of children with acute lymphoblastic leukemia (ALL). Oncologist. 2007;12(8):991–998. | ||
Chen FX, Cui YQ, Wu ZL, et al. Research on the pharmacokinetics and pharmacodynamics of L-asparaginase during its treatment of childhood acute lymphoblastic leukemia. Zhonghua Xue Ye Xue Za Zhi. 2005;26(2):100. | ||
Balcão VM, Mateo C, Fernández-Lafuente R, Malcata FX, Guisán JM. Structural and functional stabilization of L-asparaginase via multisubunit immobilization onto highly activated supports. Biotechnol Prog. 2001;17(3):537–542. | ||
Stecher AL, de Deus PM, Polikarpov I, Abrahão-Neto J. Stability of L-asparaginase: an enzyme used in leukemia treatment. Pharm Acta Helv. 1999;74(1):1–9. | ||
Afkhami A, Norooz-Asl R. Micelle-mediated extraction and spectrophotometric determination of ammonia in water samples utilizing indophenol dye formation. J Braz Chem Soc. 2008;19(8):1546–1552. | ||
Tagami S, Matsuda K. An enzymatic method for the kinetic measurement of L-asparaginase activity and L-asparagine with an ammonia gas-sensing electrode. Chem Pharm Bull. 1990;38(1):153–155. | ||
Yao H, Vancoillie J, D’Hondt M, Wynendaele E, Bracke N, de Spiegeleer B. An analytical quality by design (aQbD) approach for a L-asparaginase activity method. J Pharm Biomed Anal. 2016;117:232–239. | ||
Boos J, Werber G, Ahlke E, et al. Monitoring of asparaginase activity and asparagine levels in children on different asparaginase preparations. Eur J Cancer. 1996;32A(9):1544–1550. | ||
Werber G, Ahlke E, Nowak-Göttl U, Jürgens H, Verspohl EJ, Boos J. Asparaginase Activities In Vitro Are Highly Sensitive to Different Buffer Conditions. Berlin, Heidelberg: Springer; 1997. | ||
Lanvers C, Vieira Pinheiro JP, Hempel G, Wuerthwein G, Boos J. Analytical validation of a microplate reader-based method for the therapeutic drug monitoring of L-asparaginase in human serum. Anal Biochem. 2002;309(1):117–126. | ||
Silverman LB, Supko JG, Stevenson KE, et al. Intravenous PEG-asparaginase during remission induction in children and adolescents with newly diagnosed acute lymphoblastic leukemia. Blood. 2010;115(7):1351–1353. | ||
Armstrong JK, Hempel G, Koling S, et al. Antibody against poly(ethylene glycol) adversely affects PEG-asparaginase therapy in acute lymphoblastic leukemia patients. Cancer. 2007;110(1):103–111. | ||
Villa P, Corada M, Bartosek I. L-asparaginase effects on inhibition of protein synthesis and lowering of the glutamine content in cultured rat hepatocytes. Toxicol Lett. 1986;32(3):235–241. | ||
Miller HK, Salser JS, Balis ME. Amino acid levels following L-asparagine amidohydrolase (EC.3.5.1.1) therapy. Cancer Res. 1969;29(1):183. | ||
Ollenschläger G, Roth E, Linkesch W, Jansen S, Simmel A, Mödder B. Asparaginase-induced derangements of glutamine metabolism: the pathogenetic basis for some drug-related side-effects. Eur J Clin Invest. 1988;18(5):512–516. | ||
Fuchs BC, Bode BP. Stressing out over survival: glutamine as an apoptotic modulator. J Surg Res. 2006;131(1):26–40. | ||
Müller HJ, Beier R, da Palma JC, et al. PEG-asparaginase (Oncaspar) 2500 U/m(2) BSA in reinduction and relapse treatment in the ALL/NHL-BFM protocols. Cancer Chemother Pharmacol. 2002;49(2):149–154. |
 © 2018 The Author(s). This work is published and licensed by Dove Medical Press Limited. The
full terms of this license are available at https://www.dovepress.com/terms
and incorporate the Creative Commons Attribution
- Non Commercial (unported, 3.0) License.
By accessing the work you hereby accept the Terms. Non-commercial uses of the work are permitted
without any further permission from Dove Medical Press Limited, provided the work is properly
attributed. For permission for commercial use of this work, please see paragraphs 4.2 and 5 of our Terms.
© 2018 The Author(s). This work is published and licensed by Dove Medical Press Limited. The
full terms of this license are available at https://www.dovepress.com/terms
and incorporate the Creative Commons Attribution
- Non Commercial (unported, 3.0) License.
By accessing the work you hereby accept the Terms. Non-commercial uses of the work are permitted
without any further permission from Dove Medical Press Limited, provided the work is properly
attributed. For permission for commercial use of this work, please see paragraphs 4.2 and 5 of our Terms.