Back to Journals » Clinical Ophthalmology » Volume 19
Pericentral Scotometry Guided by Standard Perimetry Using Microperimetry in Glaucoma Patients
Authors Caiado GC ![]() , Samico GA
, Samico GA ![]() , Silva Filho GV, Teixeira SH, Prata TS
, Silva Filho GV, Teixeira SH, Prata TS ![]() , Gracitelli CPB, Paranhos A Jr
, Gracitelli CPB, Paranhos A Jr ![]()
Received 13 August 2025
Accepted for publication 3 November 2025
Published 6 November 2025 Volume 2025:19 Pages 4085—4097
DOI https://doi.org/10.2147/OPTH.S560415
Checked for plagiarism Yes
Review by Single anonymous peer review
Peer reviewer comments 2
Editor who approved publication: Dr Scott Fraser
Gustavo Coelho Caiado,1 Gustavo Albrecht Samico,1 Gilvan Vilarinho da Silva Filho,1 Sergio Henrique Teixeira,1 Tiago Santos Prata,1,2 Carolina Pelegrini Barbosa Gracitelli,1 Augusto Paranhos Jr1
1Department of Ophthalmology and Visual Science, Federal University of São Paulo, São Paulo, Brazil; 2Department of Ophthalmology, Mayo Clinic, Jackonville, FL, USA
Correspondence: Augusto Paranhos Jr, Department of Ophthalmology and Visual Science, Federal University of São Paulo, Rua Botucatu, 821, Vila Clementino, São Paulo, CEP: 04023-062, Brazil, Tel +55 11 99144 4176, Fax +55 11 5085 2000, Email [email protected]
Purpose: To evaluate whether regionally customized high-density MP-3 microperimetry guided by regions of interest (ROIs) derived from standard automated perimetry (SAP) provides stronger structure–function correlations with ganglion cell layer thickness (GCLT) than conventional SAP in glaucoma.
Methods: This cross-sectional study included 85 eyes of 55 glaucoma patients. All participants underwent SAP (Octopus 900) and MP-3 microperimetry (Nidek Co. Ltd). Individual high-density grids were customized to target the quadrant of lowest mean sensitivity on SAP. Optical coherence tomography (DRI-OCT Triton) was used to measure mean GCLT in the corresponding quadrant (GCLTq). Structure–function relationships between GCLTq and visual field (VF) sensitivity indices were analyzed with linear mixed-effects models accounting for inter-eye correlation. VF sensitivities were expressed on logarithmic and linear scales. Comparative model performance was assessed using Akaike’s Information Criterion (AIC), ΔAIC, and Akaike weights (wi).
Results: All VF indices correlated significantly with GCLTq (p < 0.05). MP-3 mean sensitivity on the linear scale (MS-MP3) showed the strongest association (R2 = 0.139; p = 0.003), followed by MS-MP3 in dB (R2 = 0.134; p = 0.003), SAP in dB (R2 = 0.111; p = 0.008), and SAP on the linear scale (R2 = 0.062; p = 0.021). Model comparison indicated a better fit for MP-3 on the linear scale (ΔAIC = 8; wi = 0.982) than SAP, while differences on the dB scale were minor (ΔAIC = 2). The ROI-guided approach provided a wider sensitivity range and stronger spatial correspondence between functional and structural damage.
Conclusion: ROI-guided MP-3 microperimetry yielded a statistically supported yet modest improvement in structure–function correlation compared with SAP. The AIC-based analysis confirms that ROI targeting enhances the reliability and topographic accuracy of structure–function mapping in glaucoma.
Keywords: glaucoma, microperimetry, visual field, region of interest, optical coherence tomography
Introduction
Glaucoma is a chronic, progressive, potentially blinding, irreversible eye disease that causes optic nerve rim, retinal nerve fiber layer (RNFL) and ganglion cell layer (GCL) loss with related visual field (VF) defects.1 Many patients remain undiagnosed or continue to progress despite currently available diagnostic and therapeutic modalities.2 Glaucomatous VF defects correspond to the pattern of the RNFL and GCL, affecting both the peripheral and central VF.3,4 Although a range of structural and functional assessments are employed to diagnose and follow glaucoma, achromatic standard automated perimetry (SAP) remains the most widely adopted approach for assessing visual loss.5,6
Microperimetry (MP) has emerged as a robust tool for assessing retinal sensitivity and VF defects while the fundus of the eye is directly visualized and tracked.7 The autotracking system makes it possible to adjust the stimulus points to predefined retinal positions and perform reliable field testing even in eyes with unstable fixation.8–10 Additionally, MP testing demonstrates no evident learning effect over repeated testing sessions.11 These features may contribute to a better test–retest variability of this method compared with a conventional SAP approach.12 Moreover, high reproducibility was shown for healthy and glaucoma subjects, patients suffering from macular disease and patients with retinitis pigmentosa.13–16 Furthermore, it has been reported that microperimetry has the potential to detect VF defects earlier than SAP and these findings showed to be consistent with alterations on optical coherence tomography (OCT).15,17–19
Region-of-interest (ROI) and high-density sampling strategies have been proposed to improve the topographic correspondence between structural metrics and functional sensitivity in glaucoma, thereby addressing part of the known variability in structure–function relationships.20–23 ROI methods on OCT enhance signal-to-noise for detecting localized damage compared with global averages,24–26 and high-density test patterns capture central and paracentral defects that may be under-sampled by conventional grids.23,27 Studies comparing microperimetry with standard perimetry at the macula report similar or improved structure–function associations when testing is spatially aligned to the structural map, particularly in central regions.21,28–31 The present cross-sectional study applies an ROI-guided, high-density MP-3 protocol targeted to the paracentral region (10°–20°) identified on SAP, with the specific aim of refining regional structure–function correlations with GCLT rather than assessing longitudinal progression. This approach is intended to provide a more anatomically targeted comparison that could inform future longitudinal applications.
The region of interest (ROI) approach in glaucoma is a method used in medical imaging and analysis to focus on specific areas of the eye that are most relevant for diagnosing and monitoring the disease.24 This ROI approach is advantageous because it allows for a more focused and detailed analysis of the areas most affected by glaucoma, improving the accuracy and efficiency of diagnosis and monitoring.19,23–26 Previous studies have shown that evaluating the progression in such ROI performed better than using average measurements.25,26 The predominant pattern observed in the progression of glaucomatous VF is a simultaneous increase on both the depth and size of an existing VF defect.32 Applying individually condensed test grids remarkably enhance the detection rate of glaucomatous VF deterioration compared to conventional stimulus arrangements.32
Previous studies have demonstrated that increasing the density of VF test points in central regions improves the ability to detect glaucomatous progression.17,18 By concentrating on specific regions, subtle changes that might be missed in a more generalized analysis may be detected, leading to earlier intervention and better management of the disease.27,33–36 Based on this rationale, our study sought to investigate whether a customized, high-density microperimetry approach—focusing on the pericentral ROI—could yield a stronger structure–function association compared to conventional SAP.
To better characterize localized structure–function relationships in glaucoma, we propose a personalized approach using microperimetry guided by regions of interest (ROIs) derived from conventional perimetry. Specifically, we targeted the pericentral VF area between eccentricities of 10° and 20° from the fovea. This zone was selected because it is adjacent to the central macular region already covered by standard grids such as 10–2 and other macular programs and is known to be highly relevant in early and moderate glaucoma because of its anatomical and functional significance in the papillomacular bundle and paracentral field.21,22,37 Areas beyond 20° were not included because the MP-3 microperimeter (Nidek Co. Ltd, Aichi, Japan) does not support testing in more peripheral zones, and OCT resolution and segmentation reliability decrease significantly at higher eccentricities.
We hypothesized that microperimetry would demonstrate a higher correlation with GCLT thickness (GCLT) because the analyzed region could contain a greater number of test locations with MP-3 than with SAP, thereby enhancing the spatial resolution for capturing localized glaucomatous damage. The purpose of our study was to evaluate whether high-density perimetry using MP-3 microperimetry in the area of worst sensitivity on the Octopus G program provides a stronger structure–function association with GCLT than with SAP in patients with glaucoma.
Materials and Methods
Study Population
This cross-sectional prospective study of glaucoma patients was approved by the Ethics Committee of the Federal University of São Paulo (approval number: 35713820.2.0000.5505). Written informed consent was obtained from all participants before the commencement of the study. This study was conducted in accordance with the tenets of the Declaration of Helsinki. Glaucomatous subjects were recruited from the Glaucoma Division of Ophthalmology and Visual Sciences at the Federal University of São Paulo, São Paulo, Brazil. Patients with glaucoma were enrolled in the study based on clinical findings consistent with glaucomatous optic neuropathy, such as a vertical cup-to-disc ratio >0.6, asymmetry of cup-to-disc ratio >0.2 between eyes, and the presence of localized RNFL or neuroretinal rim defects corresponding to the loss of VF in SAP in the absence of any other abnormalities that could explain the findings on fundus examination.
Glaucoma was confirmed by the presence of repeated abnormal SAP results defined as follows:18 glaucoma hemifield test values outside the normal limits, a probability of less than 5% demonstrated by the pattern standard deviation (PSD) index or three or more points in clusters, on the PSD plot, with a probability of less than 5%.
All participants underwent a comprehensive ophthalmic examination, which included best-corrected visual acuity and refraction, intraocular pressure measurement using Goldmann applanation tonometry, slit lamp examination of the anterior segment, fundoscopy, gonioscopy and swept-source OCT (DRI OCT Triton, Topcon Inc, Tokyo, Japan) examination. The patients underwent standard VF examination using the static automated white-on-white G Program (Octopus 900, Haag-Streit, AG, Koeniz, Switzerland) and an MP-3 Microperimeter (Nidek Co. Ltd, Aichi, Japan). All patients underwent at least two VF examination using Octopus 900 (Haag-Streit, AG, Koeniz, Switzerland) and MP-3 (Nidek Co. Ltd, Aichi, Japan) prior to the study. All imaging and functional examinations included in the study were performed within a maximum interval of one month.
The exclusion criteria were as follows: (1) age under 18 years and older than 80 years; (2) eyes with spherical equivalent outside the glaucoma of +3.0 to –6.0 diopters; (3) best corrected visual acuity >1.0 logMAR; (4) non-glaucomatous optic neuropathy and retinopathy, previous or active uveitis, hypertensive retinopathy, diabetic retinopathy, age-related macular degeneration, pathological myopia with epiretinal membrane, macular hole, retinal detachment or ocular trauma; (5) neurodegenerative diseases such as Parkinson’s or Alzheimer’s diseases, (6) history of stroke; (7) any other known disease that may cause optic neuropathy, retinopathy or VF loss; (8) an unreliable VF; and (9) poor-quality OCT scans as described later.
OCT Imaging Acquisition and Assessment
All subjects were examined using 3D WIDE scanning protocol (DRI OCT Triton, Topcon Inc, Tokyo, Japan). DRI-OCT (DRI-OCT, Triton, Topcon, Tokyo, Japan) is an SS-OCT with a longer wavelength of 1,050 nm, a sweeping range of approximately 100 nm and a scanning speed of 100,000 A-scans per second. The 3D WIDE scan protocol covers a large area just beyond the optic nerve head (ONH) and arcades (12 × 9 mm), which comprises 256 B-scans, each with 512 A-scans (resolution 512×256). Automated segmentation of the retinal layers using built-in software was used for quantitative (GCLT measurements) and qualitative tissue evaluation. OCT was used to evaluate GCLT in the ROI quadrant (GCLTq). The ROI quadrant (ROIq) was defined as the worst mean sensitivity quadrant (MSq) between 10° and 20° on the G Program (three or four points were included in each quadrant, nasal and temporal). OCT images with poor image quality or significant image artifacts were excluded before the quantitative analysis, including: (1) image quality score less than 40, (2) inaccurate segmentation of tissue layers, (3) motion artifacts (eg, vessel discontinuity), (4) blurry images, (5) poor centration, and (6) signal loss (eg, due to eye blinking).
We utilized Python software from Python Software Foundation, version 3.9.23 (available at http://www.python.org), in conjunction with the Seaborn library, to generate a heat map based on raw data extracted from OCT scans. The heat map visually represents the GCLT, with regions of higher thickness indicated by increased intensity (hotter areas). A semi-circle equation was employed to determine the coordinates of the OCT data matrix, enabling calculation of the mean GCLT within this specified region. This region was aligned with the area analyzed in the VF test.
Visual Field Assessment
The Octopus 900 (Octopus 900, Haag-Streit, AG, Koeniz, Switzerland), was used to evaluate VF in patients with. G program was used. The G program had a physiology-based grid of 59 test locations within the central 30° of the center. Locations are spaced peripherally apart with emphasis on locations in the nasal step regions and with more test locations nasally than temporally. Goldmann size III stimuli (200 ms) against a photopic background luminance of 31.4 apostilbs (10 candela/m2), TOP strategy, and white-to-white, were used. VF measurements were considered reliable when false-positive results were less than 15%, false-negative results were less than 15% and fixation losses were less than 20%. The VF variables analyzed were the mean sensitivity of the ROIq from the G program (MSq), mean defect from the G program (MDg) and retinal sensitivity threshold of each point tested.
The MP-3 Microperimeter (Nidek Co. Ltd, Aichi, Japan) measures VF sensitivity by projecting a target light directly onto the retina rather than onto a screen. The position of the retina was automatically tracked, and the target was aligned accordingly. As a result, the retinal location stimulated at each target presentation is precisely determined, which may be advantageous for measuring VF sensitivity more accurately.16 MP-3 was used to evaluate the retinal sensitivities of ROIq. ROIq was defined as the worst mean sensitivity (MS) quadrant between 10° and 20° in the G Program (three or four points were included in each quadrant, nasal and temporal respectively). The project grid of MP-3 included high-density stimuli: 21 points two-degree spacing from 10° to 14° from the fovea. This grid was manually customized to target the specific ROIq identified in each patient and is herein referred to as the manual ROI grid (ROIm). Prior to the measurements, the LED lamp captured a reference infrared image of the retina to generate landmark regions. On this basis, horizontal and vertical shifts of patients’ fixation were registered and compensated at 30 frames per second in real time to enable precise projection of stimuli at predefined positions. At the end of the examination, the built-in charge-coupled device camera captures a color image of the fundus to visualize topographical alignment.28 A 4–2 full threshold staircase strategy with the standard Goldmann III stimulus size (200 ms) against a photopic background luminance of 31.4 apostilbs (10 candela/m2) were used.28,38 VF measurements were considered to be reliable when false-positive results were less than 15%, false-negative results were less than 15% and fixation losses were classified as “stable”. The VF variables analyzed were MS-MP3 and the retinal sensitivity threshold at each point tested.
Both the Octopus and MP-3 examinations were performed on the same day, with a minimum interval of one hour between tests to minimize fatigue. The order of testing (Octopus vs MP-3) was randomized across patients.
Glaucoma severity was classified according to the Glaucoma Staging System (GSS) proposed by Brusini,39 which provides a quantitative and topographical assessment of VF damage based on Octopus perimetry indices. This system uses the MD and the PSD or Corrected Loss Variance (CLV) values plotted on a logarithmic coordinate system to define the degree and type of glaucomatous damage. Each eye is automatically allocated into one of several stages ranging from “Stage 0” (normal VF) to “Stage 5” (end-stage glaucoma), with additional subcategories for “Borderline” and “Diffuse” defects.
This classification provides an integrated representation of both the severity and the pattern of VF impairment, facilitating comparisons across subjects and enhancing the interpretability of structure–function analyses. In the present study, GSS values were obtained directly from the Octopus 900 output using the G Program, and the corresponding stages were tabulated for descriptive purposes.
Statistical Analysis
The sample size was calculated using G Power 3.1 for a simple linear regression model (F-test, R2 deviation from zero), assuming a medium effect size (f2 = 0.15), a significance level of α = 0.05, and a statistical power of 80%. The calculation indicated the required sample size of 55 eyes (28 patients). As the study included 85 eyes (55 patients), the power achieved exceeded 80%.
Descriptive statistics were used to summarize the demographic and clinical characteristics of the study population. Continuous variables were reported as means and standard deviations (SD). Categorical variables are presented as absolute frequencies and percentages. The MD values on a logarithmic scale were converted to a linear scale using the equation.40 MD(1/Lambert) = 10MD(dB)/10.
The association between the dependent variables (retinal sensitivity measured with Octopus and MP-3) and the independent variable (mean GCLT within the ROI) was assessed using mixed-effects models to account for inter-eye dependency. All statistical analyses were performed using the available software IMB SPSS Statistics (version 29.0.2.0) and JAMOVI (version 2.4.7.0). The alpha level (type I error) was set at 0.05.
For model comparisons, since MP-3 and SAP test non-nested point distributions within the same macular region, analyses were performed in paired fashion (linear vs linear, dB vs dB) using ΔR2, ΔAIC, and Akaike weights (wi), according to the model selection criteria proposed by Burnham and Anderson.41
Results
About 33 women (58.18%) and 22 men (41.82%) were included in this study. The mean age was 66.00±7.67 years old. The mean values of the GCLTq, MS-MP3, MSq and MDg are listed in Table 1.
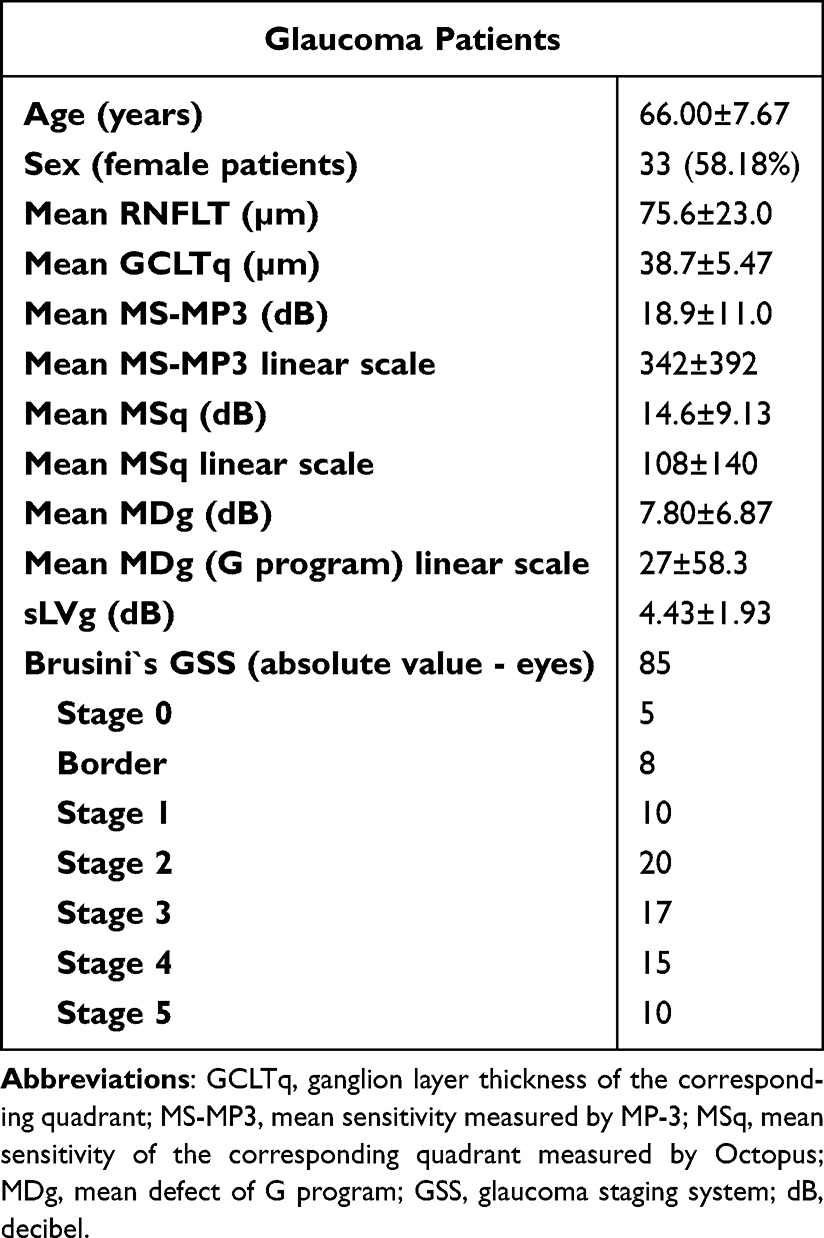 |
Table 1 Clinical Characteristics of the Study Sample |
Significant associations were observed between GCLTq and all VF indices (p < 0.05). The MS-MP3 linear scale demonstrated a better correlation with GCLTq (R2 = 0.139; p = 0.003), while MS-MP3 in dB was weakly associated (R2 = 0.134; p = 0.003). For SAP, the R2 values were lower both on the dB scale (R2 = 0.111; p = 0.008) and on the linear scale (R2 = 0.062; p = 0.021). Although all correlations were statistically significant, their magnitudes were modest, with small differences among modalities (ΔR2 < 0.08). On the linear scale, the MP-3 model showed a ΔAIC of 8 relative to SAP, indicating strong evidence of a better fit, with ΔR2 marginal = 0.077 and ΔR2 conditional = 0.167. On the dB scale, the difference between models was small (ΔAIC = 2; ΔR2 marginal = 0.023; ΔR2 conditional = 0.026), suggesting comparable performance. These results indicate that ROI-guided MP-3 microperimetry provides a modest but statistically supported improvement in structure–function correspondence compared with SAP. The associations between GCLTq and VF indices are shown in Table 2. These comparative model statistics are summarized in Table 3.
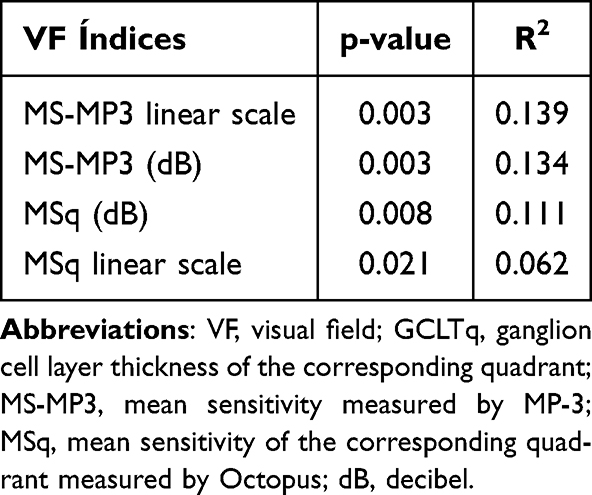 |
Table 2 Association Between GCLTq and VF Indices |
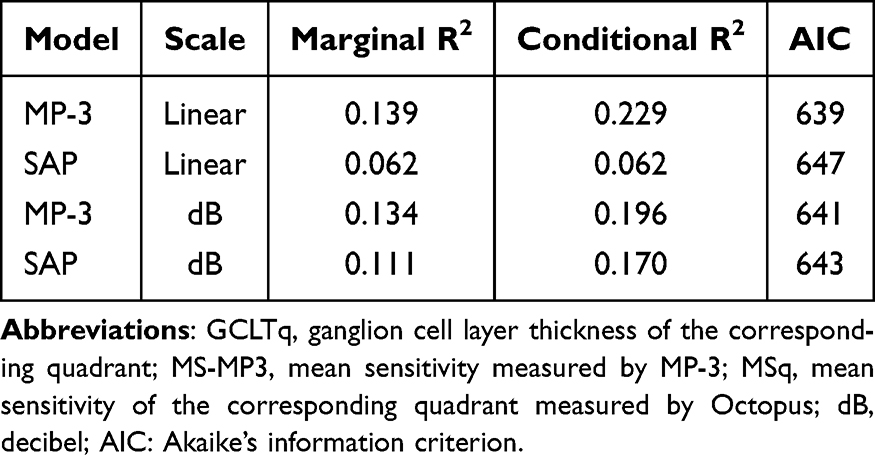 |
Table 3 Comparative Model Statistics (ΔAIC, ΔR2 and Akaike Weights) for Structure-Function Associations Between GCLTq and Visual-Field Indices |
Figure 1 illustrates the relationship between GCLTq and functional sensitivity, assessed using both the Octopus G program and MP-3. A clear positive trend was observed for both methods, with MP-3 values showing a steeper regression slope and wider distribution, suggesting a broader dynamic range and stronger structure–function association. This observation is consistent with the statistical models presented in Table 2, in which MP-3 demonstrated higher coefficients of determination (R2) compared with SAP.
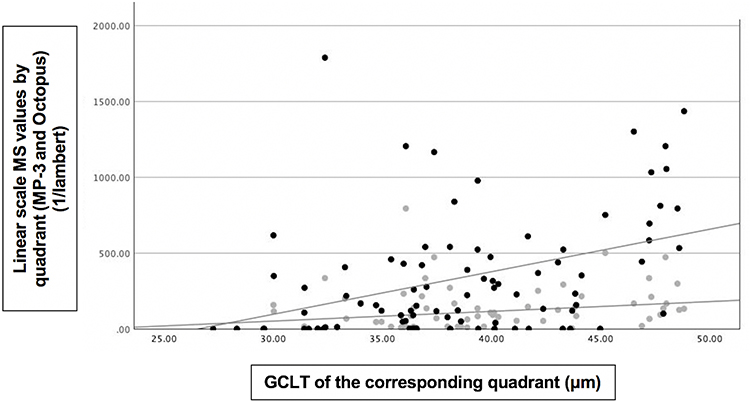 |
Figure 1 Scatter plot illustrating the relationship between mean sensitivity (MS) in linear scale and ganglion cell layer thickness (GCLT) of the corresponding quadrant. Grey dots represent MSq values obtained from standard automated perimetry (SAP), and black dots represent MS-MP3 values obtained from MP-3 microperimetry.The x-axis denotes the corresponding sectoral GCLT (in µm) obtained from swept-source OCT, and the y-axis shows the corresponding linear-scale MS (in 1/Lambert units) for each visual-field test. The steeper regression slope and wider distribution of MP-3 data suggest a stronger dynamic range and enhanced structure–function correlation. Abbreviations: GCLT, ganglion cell layer thickness; MS, mean sensitivity; MP-3, microperimeter; SAP, standard automated perimetry; OCT, optical coherence tomography. |
All mixed-effects models converged successfully and confirmed that including GCLTq as a fixed effect significantly improved model fit. MP-3 measurements, particularly on the linear scale, yielded the highest coefficients of determination (R2) and a ΔAIC of 8 relative to SAP, indicating greater explanatory power for structural variance compared with SAP. A representative case illustrating the structure–function correspondence within the ROI quadrant, evaluated by MP-3 sensitivity and GCLT, is shown in Figure 2A–D.
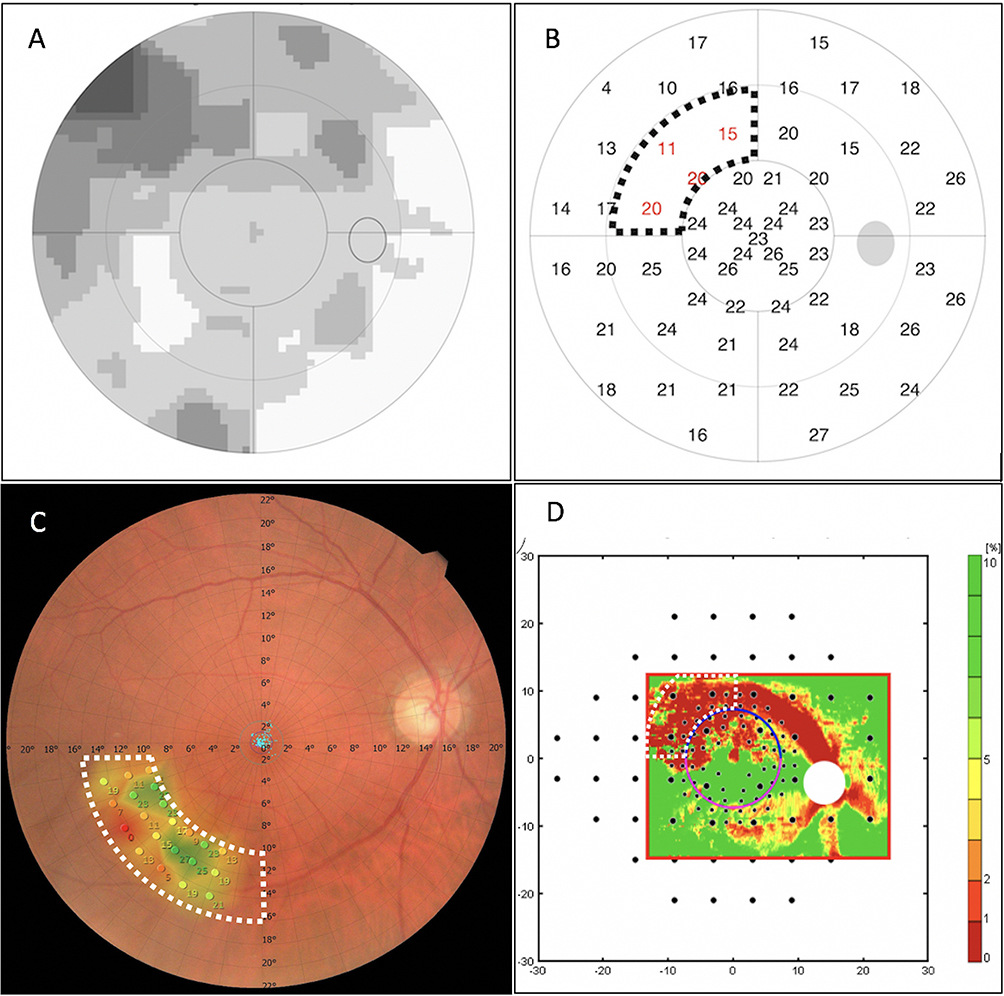 |
Figure 2 Representative case of a glaucoma patient illustrating multimodal imaging: (A) Octopus Visual Field (VF) G-Program greyscale map, where darker areas represent regions of lower retinal sensitivity (greater visual-field loss) and lighter areas represent regions of higher sensitivity (better preserved function); (B) Octopus VF G-Program threshold sensitivity map, where numerical values in red correspond to retinal sensitivity (in decibels, dB) at each tested point, with lower numbers indicating deeper functional loss. The black-dotted contour delineates the region of interest from SAP (ROIq), defined as the quadrant between 10° and 20° eccentricity showing the lowest mean sensitivity (MS); (C) MP-3 fundus image with sensitivity color grid, where red and Orange areas correspond to lower sensitivities, and green areas indicate normal or preserved sensitivities. The colored circles represent individual test points, with adjacent numerical values showing the retinal sensitivity (in dB) measured at each location.The numerical scales along the horizontal and vertical axes indicate retinal coordinates in degrees (°) of visual angle relative to the foveal center. The white dashed line outlines the region of interest from microperimetry (ROIm), manually delineated to match the area of lowest sensitivity (region of interest from SAP, ROIq); (D) RNFL probability map superimposed with perimetric test points, where warmer colors (red–yellow) denote greater RNFL loss probability and cooler colors (green) indicate preserved nerve-fiber thickness. The lateral numerical scale (–30 to 30) represents horizontal eccentricity in degrees from the foveal center, while the lower scale represents vertical eccentricity in degrees. The vertical color bar on the right shows the probability scale for RNFL loss, with darker red tones representing areas of higher probability of damage and green tones representing normal thickness values. The spatial overlap between the structural defect and the functional loss region is evident. Abbreviations: VF, visual field; ROIq, region of interest from perimetry; ROIm, region of interest from microperimetry; RNFL, retinal nerve fiber layer; dB, decibels; SAP, standard automated perimetry. |
Discussion
Identifying progressive glaucomatous VF defect remains a challenging task because of wide-ranging individual intra- and inter-test variability, large number of different methods of progression analysis and different criteria for progression.32,42–44 Using high density stimuli can shorten the detection of VF progression.17,18,33–35,44,45 Because glaucomatous VF defects typically advance in areas that are already impaired,32,46–48 it is appropriate to locally intensify the grid in regions deemed to be at higher risk of progression. Determining the strength of structure–function relationships in glaucoma with different methods of structural and functional assessments has significant clinical implications.19,20,49 This not only helps in a better understanding of structural and functional progression in glaucoma but also in deciding appropriate diagnostic tests during follow-up in glaucoma patients.19,20,49 In this study, significant structure–function correlations were observed between GCLTq and VF indices. MS-MP3 in a linear scale showed a stronger association than the other VF índices and MP-3 consistently outperformed SAP, with higher coefficients of determination. These findings further support a consistent topographic correspondence between GCL thickness (GCLT) and functional sensitivity in glaucoma, reinforcing the applicability of both MP-3 and SAP for structure–function analysis. Moreover, model comparison based on Akaike’s Information Criterion (ΔAIC = 8 on the linear scale) provided strong statistical evidence that the MP-3 model achieved a superior fit relative to SAP, strengthening the reliability of the observed structure–function relationship.
Although the correlations between GCLT and VF indices in our study were statistically significant, their magnitudes were modest, consistent with previous cross-sectional reports evaluating structure–function relationships in glaucoma.7,19,21,25 Weak or moderate coefficients are common in this context and are largely explained by biological variability in retinal architecture, floor effects of advanced damage, and the nonlinear nature of the dB scale used in perimetry.20,48,49 Moreover, differences in test–retest variability between OCT and perimetric measurements can further reduce correlation strength, even when a true topographic relationship exists.20 Importantly, model comparison using Akaike’s Information Criterion (AIC) provided a more robust statistical assessment of the relative performance of MP-3 and SAP. On the linear scale, the MP-3 model showed a substantially lower AIC (ΔAIC = 8; Akaike weight = 0.982) and higher marginal and conditional R2 values (ΔR2 = 0.077 and 0.167, respectively), indicating a better fit and greater explanatory power compared to SAP. In contrast, differences were minor on the dB scale (ΔAIC = 2; ΔR2 < 0.03), suggesting comparable behavior. The use of AIC is particularly suitable for comparing non-nested models, as it provides a more objective criterion for model selection than direct R2 comparison.41 In this framework, a ΔAIC greater than 4 indicates substantial evidence favoring one model over another, reinforcing that the ROI-guided MP-3 approach offers a statistically superior fit to the data.41 Thus, although the absolute effect size was modest, the strength of evidence based on information-theoretic metrics supports the robustness and consistency of our findings.
Several studies have shown significant structure-function correlations with MP.7,16–19,28–30,38,45,50–54 Kita et al51 showed that circumpapillary RNFLT (cpRNFLT) and circumpapillary ganglion cell complex (cpGCC) showed statistically significant correlations with the corresponding cirumpapillary MP in glaucoma patients. While their analysis focused on the peripapillary region, our study differed by assessing the GCLT and pericentral ROI’s, highlighting central rather than circumpapillary relationships. Rao et al21 found that the visual sensitivity measurements of both SAP and MP demonstrated a similar relationship with the GCLT. Unlike their study, which used a conventional macular grid, we employed a personalized ROI-based grid centered on regions of glaucomatous damage, potentially enhancing the sensitivity to localized deficits. Kulkarni et al29 showed that macular sensitivity determined by both the Humphrey (HFA) 10–2 Swedish Interactive Thresholding Algorithm (SITA) Standard and MP correlated significantly with the mean macular RNFLT measured by OCT in advanced glaucoma. However, their approach used a global macular measure, whereas our study provided a more topographically specific analysis by correlating MS-MP3 with its corresponding GCLT region, potentially improving the spatial resolution of structure–function mapping. Shin et al31 reported that the MS of MP had a significantly greater correlation coefficient with cpRFNFLT than with SAP in eyes with open angle glaucoma (OAG) with myopia. Our results are in agreement with the superior structure–function relationship observed with MP but focus on the macular region and high-density test grids rather than the peripapillary region, and our cohort was not limited to myopic patients. Akar et al30 found that VF defects detected by MP and HFA 10–2 tests were strongly correlated with a large optic disc size, disc cupping, peripapillary RNFLT and GCIPLT using OCT. While their analysis covered both macular and disc parameters, our study focused on structure–function correlation using a more refined testing strategy based on an ROI-defined MP-3 grid, targeted to areas of reduced visual sensitivity. Georgiev et al28 evaluated central glaucomatous VF defects and reported that Octopus perimetry and MP-3 values were well-correlated, and the structure-function analysis for both methods was similar in glaucoma. In contrast to their use of standard grids, our study leveraged a customized high-density grid, potentially improving the precision of its structure and function. Matsuura et al16 emphasized MP-3’s stronger structure–function relationship and reproducibility compared to HFA. Our findings are consistent with those of previous studies. However, we advanced the current literature by assessing MP-3’s correlation with GCLT through a spatially detailed, high-density, ROI-based approach. While the above studies support the utility of MP in structure–function evaluation, our study adds novel insights by combining high-density, ROI-targeted MP-3 testing with spatially matched GCLT, providing a refined model for understanding localized glaucomatous damage.
The use of ROI has been reported in several previous studies. Studies have shown that the manual ROI approach—which makes use of prior knowledge of the nature of glaucomatous damage during the qualitative evaluation, was superior in detecting progressive cpRNFL thinning when compared with the conventional global measure and an automatic ROI approach.24–26 Our study builds on this concept by applying a manually defined, patient-specific ROI grid centered on the area of lowest MS between 10° and 20° of eccentricity. This approach allows for targeted structure–function analysis by correlating functional impairment with local GCLT measurements. Several studies have identified earlier macular function damage33,53 or enhanced scotoma detection using high density stimuli in a ROI compared with SAP.17,18,33–35,44,45 These findings support the rationale behind our methodological approach, which combines both ROI targeting and high spatial resolution in microperimetry. In contrast to previous studies, we employed a high-density ROI grid customized for each patient, potentially enhancing the sensitivity to localized defects beyond what was observed in studies using fixed high-density patterns.
A factor contributing to the poor sensitivity of conventional perimetry for detecting early glaucoma is its relatively low resolution. This decrease in resolution related to spatial and depth dimensions not only affects the ability to detect scotomas but also undermines the demonstration of subtle changes in follow-up assessments. Several studies have addressed this problem by performing perimetry at a higher spatial resolution and have identified retinal sensitivity loss in glaucoma patients with normal corresponding conventional perimetry results.17,18,33–36,45 Previous studies indicated that glaucomatous progression occurs in the vicinity of already affected visual neurons, thereby inducing a local progression of scotoma depth and/or size.32,47 As a logical consequence, perimetric techniques should enhance resolution with respect to both the above-mentioned parameters, additionally, referring to a reliable (as well as comparable) perimetric baseline result.32 In 20 glaucomatous eyes with paracentral VF defects (defects involving the central 10° of VF on a 24° test), Lima et al18 found that the visual sensitivities of MP in the central 10° of VF not only correlated significantly with those from 10–2 SAP but also detected abnormal areas of retinal sensitivity in quadrants with normal SAP values. They also found that 75% of the areas showing abnormal visual sensitivity with MP and normal sensitivity with SAP showed a corresponding reduction in macular thickness on OCT;18 These findings were concordant with Orzalesi et al,17 who found a reduction in visual sensitivity with MP in areas of localized RNFL defects but the SAP results were normal. They also found a deep or mild scotoma on MP in 100% of eyes with focal RNFL defects, as compared to a significant defect seen in only 56% of eyes on SAP.17 Yusuf et al45 showed reduced retinal sensitivity on microperimetry in 81% eyes with normal SAP examination. Nevalainen et al32 reported that conventional grids found less than half of the progressive VF confirmed with spatially condensed grids. Liang et al54 found that MP reveals variations in macular sensitivity in patients with early glaucoma earlier than conventional perimetry, particularly in pre-perimetric glaucoma cases in which it might be undetectable by conventional methods.54 All in all, enhancing the condensation of test points locally is not merely an alternative for achieving a more accurate representation of the current scotoma pattern; it may also yield critical information that allows for earlier detection of progression compared to conventional perimetric grids. The ROIm employed in our study represents a methodological advancement by allowing a tailored and focused assessment of retinal sensitivity in areas most vulnerable to progression. This approach supported by Hood et al24 and Thenappan et al,25 who showed improved performance of ROI strategies over global metrics.
Figure 1 illustrates a scatter plot of the relationship between GCLTq and functional sensitivity, assessed using the Octopus G program and MP-3. A clear positive trend was observed between GCLTq and functional sensitivity for both methods. However, the MP-3 values demonstrated a steeper regression slope and wider distribution, suggesting a stronger dynamic range and more pronounced structure–function association compared to the Octopus G values. This observation is consistent with the statistical models presented in Table 2, where MP-3 showed higher coefficients of determination (R2) in the linear mixed-effects models assessing the GCLTq versus the VF indices. Future studies should assess the longitudinal applicability of ROI-guided microperimetry in detecting glaucomatous progression and its potential to predict functional decline over time.
From a clinical standpoint, ROI-guided, high-density MP-3 microperimetry provides a spatially precise evaluation of macular function, particularly in the paracentral region that is highly relevant for fixation and daily visual performance.55,56 Although the improvement in correlation strength was modest, the use of regionally targeted testing enhances the anatomical correspondence between structural and functional assessments. This methodological refinement may contribute to more accurate characterization of paracentral functional impairment in glaucoma and improve the interpretation of structure–function relationships in clinical and research settings.23–26
The concept underlying this approach is consistent with the rationale behind 10–2 perimetry, which selectively evaluates the macular area and has been shown to detect early or progressive glaucomatous changes that can be missed by standard 24–2 testing.27 Similarly, the use of ROI-guided, high-density testing allows a more localized functional assessment of the area most affected by structural loss.32,47 The present study focuses on a cross-sectional analysis as an essential preliminary step before implementing longitudinal monitoring protocols. Establishing whether increased testing density within the area of greatest sensitivity loss improves structure–function correlation is a necessary prerequisite for justifying prospective evaluations of progression.
Beyond glaucoma, ROI-based microperimetry has demonstrated improved performance in several other retinal diseases. In macular degeneration and diabetic macular edema, ROI-targeted testing aligned with OCT or autofluorescence maps has yielded superior sensitivity for detecting localized functional loss and monitoring treatment response compared with fixed grid approaches.57,58 Similarly, in retinitis pigmentosa and hereditary dystrophies, customized microperimetric grids centered on preserved retinal islands have provided a more accurate estimation of residual visual function and progression rate.59,60 These findings highlight the versatility of ROI-guided analysis as a strategy to enhance structure–function correspondence across distinct ocular conditions. The consistency of results across pathologies supports the idea that anatomically tailored testing—whether in glaucomatous, degenerative, or vascular diseases—can optimize microperimetry’s diagnostic precision and longitudinal monitoring potential.
This study has several limitations. First, its cross-sectional design prevents longitudinal evaluation of progression over time. Second, although the ROI-based approach enhances the spatial correlation between structure and function, it relies on a predefined area of interest based on the current sensitivity loss, which may limit its applicability to eyes with atypical or widespread patterns of damage. Moreover, because the ROI is defined manually and is based on current deficits, newly emerging defects outside this region may not be captured. Third, the study was conducted at a single tertiary center with a relatively small sample size. External validation in independent populations and across different clinical settings is required to confirm the generalizability of our findings. Fourth, at the time of our investigation, the MP did not have an implemented normative database; therefore only the MS values between both devices were compared. Fifth, a limitation of this study is the absence of a control group. Although our aim was to evaluate structure–function correspondence exclusively in glaucomatous eyes, including healthy subjects in future studies could help quantify normal variability in microperimetric sensitivity and strengthen the establishment of normative references for ROI-based analysis.
Conclusions
This study demonstrated that regionally customized high-density microperimetry (MP-3) yields stronger structure–function associations with GCLT than SAP in glaucoma, particularly when analyses are performed on a linear sensitivity scale. Although the absolute gain in correlation was modest, model selection based on AIC provided robust statistical support for the superiority of the ROI-guided MP-3 model over SAP. These findings indicate that the benefit of ROI targeting lies not in producing a large numerical increase in correlation, but in achieving a more reliable and anatomically consistent structure–function mapping. By enhancing the spatial alignment between functional loss and local structural thinning, ROI-guided microperimetry refines clinical interpretation and may serve as a practical step toward personalized functional monitoring in glaucoma. Future longitudinal studies are warranted to assess whether this approach improves progression detection and predictive modeling of visual decline.
Data Sharing Statement
Data generated during this study are available from the corresponding author on reasonable request.
Ethics Approval Statement
This was a cross-sectional study of glaucoma patients. This study was approved by the Ethics Committee of Federal University of São Paulo (approval number: 35713820.2.0000.5505). Written informed consent was obtained from all participants before commencement of the study. This study was conducted in accordance with the tenets of the Declaration of Helsinki.
Author Contributions
All authors made a significant contribution to the work reported, whether in the conception, study design, execution, acquisition of data, analysis, or interpretation; took part in drafting, revising, or critically reviewing the article; gave final approval of the version to be published; have agreed on the journal to which the article has been submitted; and agree to be accountable for all aspects of the work.
Funding
The authors received no specific grant or financial support from any funding agency or commercial or not-for-profit sector for this research.
Disclosure
Dr Augusto Paranhos Jr reports grants, personal fees from Topcon, during the conduct of the study; personal fees from Topcon, Haag Streit; grants from Quantel, outside the submitted work. The authors declare no other conflicts of interest in this work.
References
1. Spaeth GL. European glaucoma society terminology and guidelines for glaucoma, 5th edition. Br J Ophthalmol. 2021;105(Suppl 1):1–169. doi:10.1136/bjophthalmol-2021-egsguidelines
2. Quigley HA. Glaucoma. Lancet. 2011;377(9774):1367–1377. doi:10.1016/S0140-6736(10)61423-7
3. Weinreb RN, Shakiba S, Sample PA, et al. Association between quantitative nerve fiber layer measurement and visual field loss in glaucoma. Am J Ophthalmol. 1995;120(6):732–738. doi:10.1016/s0002-9394(14)72726-6
4. Wu JH, Moghimi S, Nishida T, Mahmoudinezhad G, Zangwill LM, Weinreb RN. Association of macular vessel density and ganglion cell complex thickness with central visual field progression in glaucoma. Br J Ophthalmol. 2023;107(12):1828–1833. doi:10.1136/bjo-2022-321870
5. Heijl A, Bengtsson B, Chauhan BC, et al. A comparison of visual field progression criteria of 3 major glaucoma trials in early manifest glaucoma trial patients. Ophthalmology. 2008;115(9):1557–1565. doi:10.1016/j.ophtha.2008.02.005
6. Bengtsson B, Heijl A. A visual field index for calculation of glaucoma rate of progression. Am J Ophthalmol. 2008;145(2):343–353. doi:10.1016/j.ajo.2007.09.038
7. Acton JH, Greenstein VC. Fundus-driven perimetry (microperimetry) compared to conventional static automated perimetry: similarities, differences, and clinical applications. Can J Ophthalmol. 2013;48(5):358–363. doi:10.1016/j.jcjo.2013.03.021
8. Kameda T, Tanabe T, Hangai M, Ojima T, Aikawa H, Yoshimura N. Fixation behavior in advanced stage glaucoma assessed by the MICROPERIMETER MP-1. Jpn J Ophthalmol. 2009;53(6):580–587. doi:10.1007/s10384-009-0735-y
9. Zabel K, Zabel P, Suwala K, et al. Alterations in fixation indices in primary open-angle glaucoma by microperimetry. JCM. 2022;11(9):2368. doi:10.3390/jcm11092368
10. Fragiotta S. Microperimetric biofeedback training fundamentals strategies and perspectives. Front Biosci. 2018;10(1):48–64. doi:10.2741/s500
11. Wong E, Morgan W, Chen F. Intersession test–retest variability of 10-2 MAIA microperimetry in fixation-threatening glaucoma. OPTH. 2017;11:745–752. doi:10.2147/OPTH.S131371
12. Montesano G, Bryan SR, Crabb DP, et al. A comparison between the compass fundus perimeter and the humphrey field analyzer. Ophthalmology. 2019;126(2):242–251. doi:10.1016/j.ophtha.2018.08.010
13. Igarashi N, Matsuura M, Hashimoto Y, et al. Assessing visual fields in patients with retinitis pigmentosa using a novel microperimeter with eye tracking: the MP-3. PLoS One. 2016;11(11):e0166666. doi:10.1371/journal.pone.0166666
14. Palkovits S, Hirnschall N, Georgiev S, Leisser C, Findl O. Test–retest reproducibility of the microperimeter MP3 with fundus image tracking in healthy subjects and patients with macular disease. Trans Vision Sci Technol. 2018;7(1):17. doi:10.1167/tvst.7.1.17
15. Leisser C, Palkovits S, Hirnschall N, Georgiev S, Findl O. Reproducibility of Microperimeter 3 (MP-3) microperimetry in open-angle glaucoma patients. Ophthalmic Res. 2020;63(3):302–308. doi:10.1159/000501693
16. Matsuura M, Murata H, Fujino Y, Hirasawa K, Yanagisawa M, Asaoka R. Evaluating the usefulness of MP-3 microperimetry in glaucoma patients. Am J Ophthalmol. 2018;187:1–9. doi:10.1016/j.ajo.2017.12.002
17. Orzalesi N, Miglior S, Lonati C, Rosetti L. Microperimetry of localized retinal nerve fiber layer defects. Vision Res. 1998;38(5):763–771. doi:10.1016/S0042-6989(97)00171-5
18. Lima VC, Prata TS, De Moraes CGV, et al. A comparison between microperimetry and standard achromatic perimetry of the central visual field in eyes with glaucomatous paracentral visual-field defects. Br J Ophthalmol. 2010;94(1):64–67. doi:10.1136/bjo.2009.159772
19. Sarossy MG, Rezk S, Li D, et al. High‐resolution microperimetry for detecting glaucomatous damage: a prospective evaluation of performance. Clin Exper Ophthalmol. 2025;53(6):602–610. doi:10.1111/ceo.14528
20. Hood DC, Kardon RH. A framework for comparing structural and functional measures of glaucomatous damage. Prog Retinal Eye Res. 2007;26(6):688–710. doi:10.1016/j.preteyeres.2007.08.001
21. Rao HL, Januwada M, Hussain RSM, et al. Comparing the structure–function relationship at the macula with standard automated perimetry and microperimetry. Invest Ophthalmol Vis Sci. 2015;56(13):8063. doi:10.1167/iovs.15-17922
22. Hood DC, Raza AS, De Moraes CGV, Liebmann JM, Ritch R. Glaucomatous damage of the macula. Prog Retinal Eye Res. 2013;32:1–21. doi:10.1016/j.preteyeres.2012.08.003
23. Hood DC, Nguyen M, Ehrlich AC, et al. A test of a model of glaucomatous damage of the macula with high-density perimetry: implications for the locations of visual field test points. Trans Vision Sci Technol. 2014;3(3):5. doi:10.1167/tvst.3.3.5
24. Hood DC, Xin D, Wang D, et al. A region-of-interest approach for detecting progression of glaucomatous damage with optical coherence tomography. JAMA Ophthalmol. 2015;133(12):1438. doi:10.1001/jamaophthalmol.2015.3871
25. Thenappan A, De Moraes CG, Wang DL, et al. Optical coherence tomography and glaucoma progression: a comparison of a region of interest approach to average retinal nerve fiber layer thickness. J Glaucoma. 2017;26(5):473–477. doi:10.1097/IJG.0000000000000654
26. Wu Z, Thenappan A, Weng DSD, Ritch R, Hood DC. Detecting glaucomatous progression with a region-of-interest approach on optical coherence tomography: a signal-to-noise evaluation. Trans Vision Sci Technol. 2018;7(1):19. doi:10.1167/tvst.7.1.19
27. De Moraes CG, Hood DC, Thenappan A, et al. 24-2 visual fields miss central defects shown on 10-2 tests in glaucoma suspects, ocular hypertensives, and early glaucoma. Ophthalmology. 2017;124(10):1449–1456. doi:10.1016/j.ophtha.2017.04.021
28. Georgiev S, Palkovits S, Hirnschall N, Schlatter A, Leisser C, Findl O. Structure-function analysis of MP-3 microperimetry versus octopus perimetry in central glaucomatous visual field defects. Ophthalmic Res. 2022;65(4):437–445. doi:10.1159/000524005
29. Kulkarni SV, Coupland SG, Stitt DM, Hamilton J, Brownstein JJ, Damji KF. Efficacy of SLO-microperimetry and Humphrey for evaluating macular sensitivity changes in advanced glaucoma. Can J Ophthalmol. 2013;48(5):406–412. doi:10.1016/j.jcjo.2013.08.001
30. Akar S, Tekeli O, Ozturker ZK. Macular integrity assessment microperimeter, Humphrey field analyzer and OCT in glaucoma practice: a correlation study. Can J Ophthalmol. 2023;58(1):18–26. doi:10.1016/j.jcjo.2021.07.004
31. Shin JW, Lee J, Kwon J, et al. Relationship between macular vessel density and central visual field sensitivity at different glaucoma stages. Br J Ophthalmol. 2019:
32. Nevalainen J, Paetzold J, Papageorgiou E, et al. Specification of progression in glaucomatous visual field loss, applying locally condensed stimulus arrangements. Graefes Arch Clin Exp Ophthalmol. 2009;247(12):1659–1669. doi:10.1007/s00417-009-1134-2
33. Schiefer U, Malsam A, Flad M, et al. Evaluation of glaucomatous visual field loss with locally condensed grids using Fundus-Oriented Perimetry (FOP). Eur J Ophthalmol. 2001;11(2_suppl):57–62. doi:10.1177/112067210101102S07
34. Westcott MC, McNaught AI, Crabb DP, Fitzke FW, Hitchings RA. High spatial resolution automated perimetry in glaucoma. Br J Ophthalmol. 1997;81(6):452–459. doi:10.1136/bjo.81.6.452
35. Westcott MC, Garway-Heath DF, Fitzke FW, Kamal D, Hitchings RA. Use of high spatial resolution perimetry to identify scotomata not apparent with conventional perimetry in the nasal field of glaucomatous subjects. Br J Ophthalmol. 2002;86(7):761–766. doi:10.1136/bjo.86.7.761
36. Westcott MC, Fitzke FW, Hitchings RA. Abnormal motion displacement thresholds are associated with fine scale luminance sensitivity loss in glaucoma. Vision Res. 1998;38(20):3171–3180. doi:10.1016/S0042-6989(98)00038-8
37. Hood DC, La Bruna S, Leshno A, et al. A model of progression to help identify macular damage due to glaucoma. Invest Ophthalmol Vis Sci. 2023;64(15):8. doi:10.1167/iovs.64.15.8
38. Scuderi L, Gattazzo I, De Paula A, Iodice CM, Di Tizio F, Perdicchi A. Understanding the role of microperimetry in glaucoma. Int Ophthalmol. 2022;42(7):2289–2301. doi:10.1007/s10792-021-02203-3
39. Brusini P. Clinical use of a new method for visual field damage classification in glaucoma. Eur J Ophthalmol. 1996;6(4):402–407. doi:10.1177/112067219600600411
40. Liebmann K, De Moraes CG, Liebmann JM. Measuring rates of visual field progression in linear versus nonlinear scales: implications for understanding the relationship between baseline damage and target rates of glaucoma progression. J Glaucoma. 2017;26(8):721–725. doi:10.1097/IJG.0000000000000710
41. Burnham KP, Anderson DR. Model Selection and Multi-Model Inference: A Practical Information-Theoretic Approach.
42. Katz J. Comparison of analytic algorithms for detecting glaucomatous visual field loss. Arch Ophthalmol. 1991;109(12):1684. doi:10.1001/archopht.1991.01080120068028
43. Lee AC, Sample PA, Blumenthal EZ, Berry C, Zangwill L, Weinreb RN. Infrequent confirmation of visual field progression1 1The authors do not have any commercial or proprietary interest in the products discussed in this article. Ophthalmology. 2002;109(6):1059–1065. doi:10.1016/S0161-6420(02)01043-6
44. Schiefer U. Increased detection rate of glaucomatous visual field damage with locally condensed grids: a comparison between fundus-oriented perimetry and conventional visual field examination. Arch Ophthalmol. 2003;121(4):458. doi:10.1001/archopht.121.4.458
45. Yusuf IH, Jolly JK, Ratnarajan G, Salmon JF. Microperimetry and optical coherence tomography imaging in the fellow eye of patients with unilateral focal ischaemic glaucoma. Eye. 2018;32(8):1372–1379. doi:10.1038/s41433-018-0094-3
46. Mikelberg FS, Schulzer M, Drance SM, Lau W. The rate of progression of scotomas in glaucoma. Am J Ophthalmol. 1986;101(1):1–6. doi:10.1016/0002-9394(86)90457-5
47. Boden C, Blumenthal EZ, Pascual J, et al. Patterns of glaucomatous visual field progression identified by three progression criteria. Am J Ophthalmol. 2004;138(6):1029–1036. doi:10.1016/j.ajo.2004.07.003
48. Pascual JP, Schiefer U, Paetzold J, et al. Spatial characteristics of visual field progression determined by Monte Carlo simulation: diagnostic innovations in glaucoma study. Invest Ophthalmol Vis Sci. 2007;48(4):1642. doi:10.1167/iovs.06-0966
49. Medeiros FA, Alencar LM, Zangwill LM, et al. Detection of progressive retinal nerve fiber layer loss in glaucoma using scanning laser polarimetry with variable corneal compensation. Invest Ophthalmol Vis Sci. 2009;50(4):1675. doi:10.1167/iovs.08-2712
50. Kita Y, Hollό G, Saito T, Murai A, Kita R, Hirakata A. Circumpapillary microperimetry to detect glaucoma: a pilot study for sector-based comparison to circumpapillary retinal nerve fiber layer measurement. Int Ophthalmol. 2019;39(1):127–136. doi:10.1007/s10792-017-0796-8
51. Kita Y, Holló G, Murai A, Kita R, Saito T, Hirakata A. Circumpapillary structure-function relationships with microperimetry and spectral domain optical coherence tomography in glaucoma: a pilot study. OPTH. 2018;12:2535–2544. doi:10.2147/OPTH.S186739
52. Tepelus TC, Song S, Nittala MG, Nassisi M, Sadda SR, Chopra V. Comparison and correlation of retinal sensitivity between microperimetry and standard automated perimetry in low-tension glaucoma. J Glaucoma. 2020;29(10):975–980. doi:10.1097/IJG.0000000000001599
53. Phuljhele S, Angmo D, Aalok L, et al. Functional evaluation of the macular area in early glaucoma using microperimetry. Ind J Ophthalmol. 2021;69(4):876–881. doi:10.4103/ijo.IJO_1199_20
54. Liang S, Liu XL, Duan J-L, et al. MP-3 microperimeter in early primary open angle glaucoma with a new pattern. Int J Ophthalmol. 2024;17(5):861–868. doi:10.18240/ijo.2024.05.10
55. Traynis I, De Moraes CG, Raza AS, Liebmann JM, Ritch R, Hood DC. Prevalence and nature of early glaucomatous defects in the central 10° of the visual field. JAMA Ophthalmol. 2014;132(3):291. doi:10.1001/jamaophthalmol.2013.7656
56. Hood DC, Raza AS, De Moraes CGV, et al. Initial arcuate defects within the central 10 degrees in glaucoma. Invest Ophthalmol Vis Sci. 2011;52(2):940. doi:10.1167/iovs.10-5803
57. Ţurcaş C, Nicoară SD. A comprehensive review of structure-function correlations in age-related macular degeneration: contributions of microperimetry. Surv Ophthalmol. 2025;70(3):426–450. doi:10.1016/j.survophthal.2025.01.009
58. Ihsan G, Kwartika A, Widyanatha MI, Virgana R, Iskandar E, Kartasasmita AS. Early response of anti-vascular endothelial growth factor (anti-VEGF) in diabetic macular edema (DME) management: microperimetry and optical coherence tomography (OCT) findings: a pilot study at national eye center of third world country. BMC Ophthalmol. 2024;24(1):551. doi:10.1186/s12886-024-03744-8
59. Buckley TMW, Jolly JK, Josan AS, Wood LJ, Cehajic‐Kapetanovic J, MacLaren RE. Clinical applications of microperimetry in RPGR ‐related retinitis pigmentosa: a review. Acta Ophthalmologica. 2021;99(8):819–825. doi:10.1111/aos.14816
60. Xu Y, Liu X, Wu N, et al. Investigating microperimetric features in bietti crystalline dystrophy patients: a cross-sectional longitudinal study in a large cohort. Invest Ophthalmol Vis Sci. 2024;65(13):27. doi:10.1167/iovs.65.13.27
 © 2025 The Author(s). This work is published and licensed by Dove Medical Press Limited. The
full terms of this license are available at https://www.dovepress.com/terms
and incorporate the Creative Commons Attribution
- Non Commercial (unported, 4.0) License.
By accessing the work you hereby accept the Terms. Non-commercial uses of the work are permitted
without any further permission from Dove Medical Press Limited, provided the work is properly
attributed. For permission for commercial use of this work, please see paragraphs 4.2 and 5 of our Terms.
© 2025 The Author(s). This work is published and licensed by Dove Medical Press Limited. The
full terms of this license are available at https://www.dovepress.com/terms
and incorporate the Creative Commons Attribution
- Non Commercial (unported, 4.0) License.
By accessing the work you hereby accept the Terms. Non-commercial uses of the work are permitted
without any further permission from Dove Medical Press Limited, provided the work is properly
attributed. For permission for commercial use of this work, please see paragraphs 4.2 and 5 of our Terms.