Back to Journals » Journal of Pain Research » Volume 12
Pediatric Chronic Postsurgical Pain And Functional Disability: A Prospective Study Of Risk Factors Up To One Year After Major Surgery
Authors Rosenbloom BN, Pagé MG ![]() , Isaac L
, Isaac L ![]() , Campbell F
, Campbell F ![]() , Stinson JN
, Stinson JN ![]() , Wright JG
, Wright JG ![]() , Katz J
, Katz J ![]()
Received 30 March 2019
Accepted for publication 7 October 2019
Published 12 November 2019 Volume 2019:12 Pages 3079—3098
DOI https://doi.org/10.2147/JPR.S210594
Checked for plagiarism Yes
Review by Single anonymous peer review
Peer reviewer comments 3
Editor who approved publication: Dr Erica Wegrzyn
Brittany N Rosenbloom,1 M Gabrielle Pagé,2 Lisa Isaac,3 Fiona Campbell,3 Jennifer N Stinson,4 James G Wright,5 Joel Katz1,6
1Department of Psychology, York University, Toronto, ON, Canada; 2Centre de recherche du Centre hospitalier de l’Université de Montréal and Department of Anesthesiology and Pain Medicine, Faculty of Medicine, Université de Montréal, Montréal, QC, Canada; 3Department of Anesthesia and Pain Medicine, The Hospital for Sick Children and University of Toronto, Toronto, ON, Canada; 4Department of Anesthesia and Pain Medicine, Hospital for Sick Children, and Lawrence S Bloomberg Faculty of Nursing, University of Toronto, Toronto, ON, Canada; 5Department of Surgery, University of Toronto and the Hospital for Sick Children, Toronto, ON, Canada; 6Department of Psychology, The Hospital for Sick Children, Toronto, ON, Canada
Correspondence: Brittany N Rosenbloom; Joel Katz
Department of Psychology, York University, 4700 Keele St., Toronto, ON M3J 1P3, Canada
Email [email protected]; [email protected]
Background: Chronic postsurgical pain (CPSP) is a surgical complication associated with increased functional disability, psychological distress, and economic costs. The aims of this paper were to prospectively: (1) examine the incidence of CPSP 6 and 12 months after pediatric major surgery; (2) identify pain intensity and pain unpleasantness trajectories before, and up to 12 months after, surgery; (3) identify pre-operative factors that predict pain trajectory group membership; and (4) identify predictors of 12-month functional disability.
Methods: This study followed 265 children aged 8–17 years at four time points (pre-surgical [T0], in-hospital [T1], 6 [T2] and 12 [T3] months after surgery). Children and parents completed pain and psychological questionnaires. In-hospital physical activity was monitored using actigraphy.
Results and discussion: The incidence of moderate-to-severe CPSP at 6 and 12 months was 35% (95% CI 29.1% to 41.9%) and 38% (95% CI 32.4% to 45.1%), respectively. Three percent (95% CI 1.17% to 6.23%) and 4% (95% CI 1.45% to 6.55%) of children reported using opioids to manage pain at 6 and 12 months, respectively. Growth mixture modeling revealed a two-class trajectory model with a quadratic slope best fit the data for both pain intensity (Bayesian information criterion [BIC] = 3977.03) and pain unpleasantness (BIC = 3644.45) over the 12 months. Preoperative functional disability and cumulative in-hospital opioid consumption predicted pain intensity trajectories. Preoperative functional disability predicted pain unpleasantness trajectories. Preoperative functional disability (OR: 1.05, 95% CI: 1.01 to 1.09) and pain unpleasantness trajectories (OR: 2.59, 95% CI: 1.05 to 6.37) predicted 12-month moderate-to-severe functional disability.
Conclusion: Pre-surgical functional disability is the only factor that predicts both 12-month functional disability and the course of pain intensity and pain unpleasantness ratings over the 12-month period.
Keywords: pain, pediatrics, surgery, trajectory analysis, functional disability, anxiety, depression, parents
Introduction
Chronic postsurgical pain (CPSP) is a surgical complication that occurs in approximately 20–50% of the children after major surgeries.1,2 It is associated with longer recovery, higher risk of infection, greater functional disability, missed school days, psychological distress, and economic costs.1–5 CPSP is defined as pain that: develops after a surgical procedure; is a continuation of acute post-surgical pain or develops after an asymptomatic period; is localized to the surgical site or projected to a referred area; persists for at least 3–6 months after surgery; and affects quality of life. Importantly, other causes of the pain must be excluded.6
While there is extensive literature on the transition from acute to chronic post-surgical pain in adults,7 far fewer pediatric studies have been published on the topic. As with adults, the transition to CPSP in children is thought to follow a biopsychosocial model8 that includes child factors, such as genetics, sex, pre-surgical pain, sleep, anxiety, and pain catastrophizing, but parent factors as well, such as parent cognitive appraisals of their child’s pain9 and parent pain catastrophizing.2 The main outcome in many of the biopsychosocial models of chronic pain is functional disability (ie, disability in doing activities of everyday life) or pain-related disability (ie, difficulty due to pain engaging in everyday activities, including social, emotional, cognitive, physical, and recreational aspects).8,10
Pain is an important driver of pain-related disability11 and general functional disability12,13 though not all studies of pediatric CPSP have measured this construct. Of the studies that actually measured functional disability2,14,15 or a proxy variable, such as number of days of school missed16 or activity limitations;15 only three2,14,15 reported on the predictive relationship between pain and functional disability2 or the proxy variable.15 This is an important omission since disability is the main outcome variable in biopsychosocial models of chronic pain. Both Pagé et al2 and Chidambaran et al14 report similar findings: the presence of moderate/severe CPSP2 or persistent pain14 one year after surgery was not accompanied by high levels of functional disability (or scores on the Functional Disability Index of 13 or more17). Moreover, functional disability inventory scores did not differ significantly between children with moderate-to-severe pain and those with no-to-low CPSP2 or between those with and without persistent pain.14 In contrast, Rabbitts et al15 found that one year after surgery, the late pain recovery group showed worse health-related quality of life, as measured by the Pediatric Quality of Life Scale, and greater activity limitations than the early pain recovery group after controlling for age and sex, but importantly the authors did not control for baseline quality of life or baseline activity limitations. It is therefore not clear whether pain trajectory group membership in fact predicts greater activity limitations one year after surgery when taking into account the variance contributed by the pre-operative values of these variables. That is, it may be that children with worse quality of life and greater activity limitations before surgery have the worst outcome regardless of their pain scores over the year after surgery.
The aims of the present study were to prospectively: (1) examine the incidence of CPSP 6 and 12 months after pediatric major orthopedic or general surgery; (2) identify pain intensity and pain unpleasantness trajectories before, and up to 12 months after, surgery; (3) identify pre-operative psychosocial and demographic factors that predict pain trajectory group membership; and (4) identify predictors of 12-month functional disability after controlling for pre-operative functional disability.
Materials And Methods
Participants
Participants aged 8–18 years undergoing either orthopedic surgery (ie, osteotomy, plate insertion tibial/femur, surgery for scoliosis) or general surgery (ie, thoracotomy, thoracoabdominal surgery, Nuss/Ravitch pectus repair, sternotomy, laparotomy, laparoscopic-assisted; colectomy, ileostomy, J-pouches) and one of their parents were eligible to participate in this study. Children were excluded if (1) they had a documented developmental or cognitive delay, (2) they had a diagnosis of cancer, (3) they did not speak or read English, or (4) their parent or guardian did not speak or read English.
Questionnaires
Table 1 lists the complete study measures and their timing of administration across the study period for children and their parents.
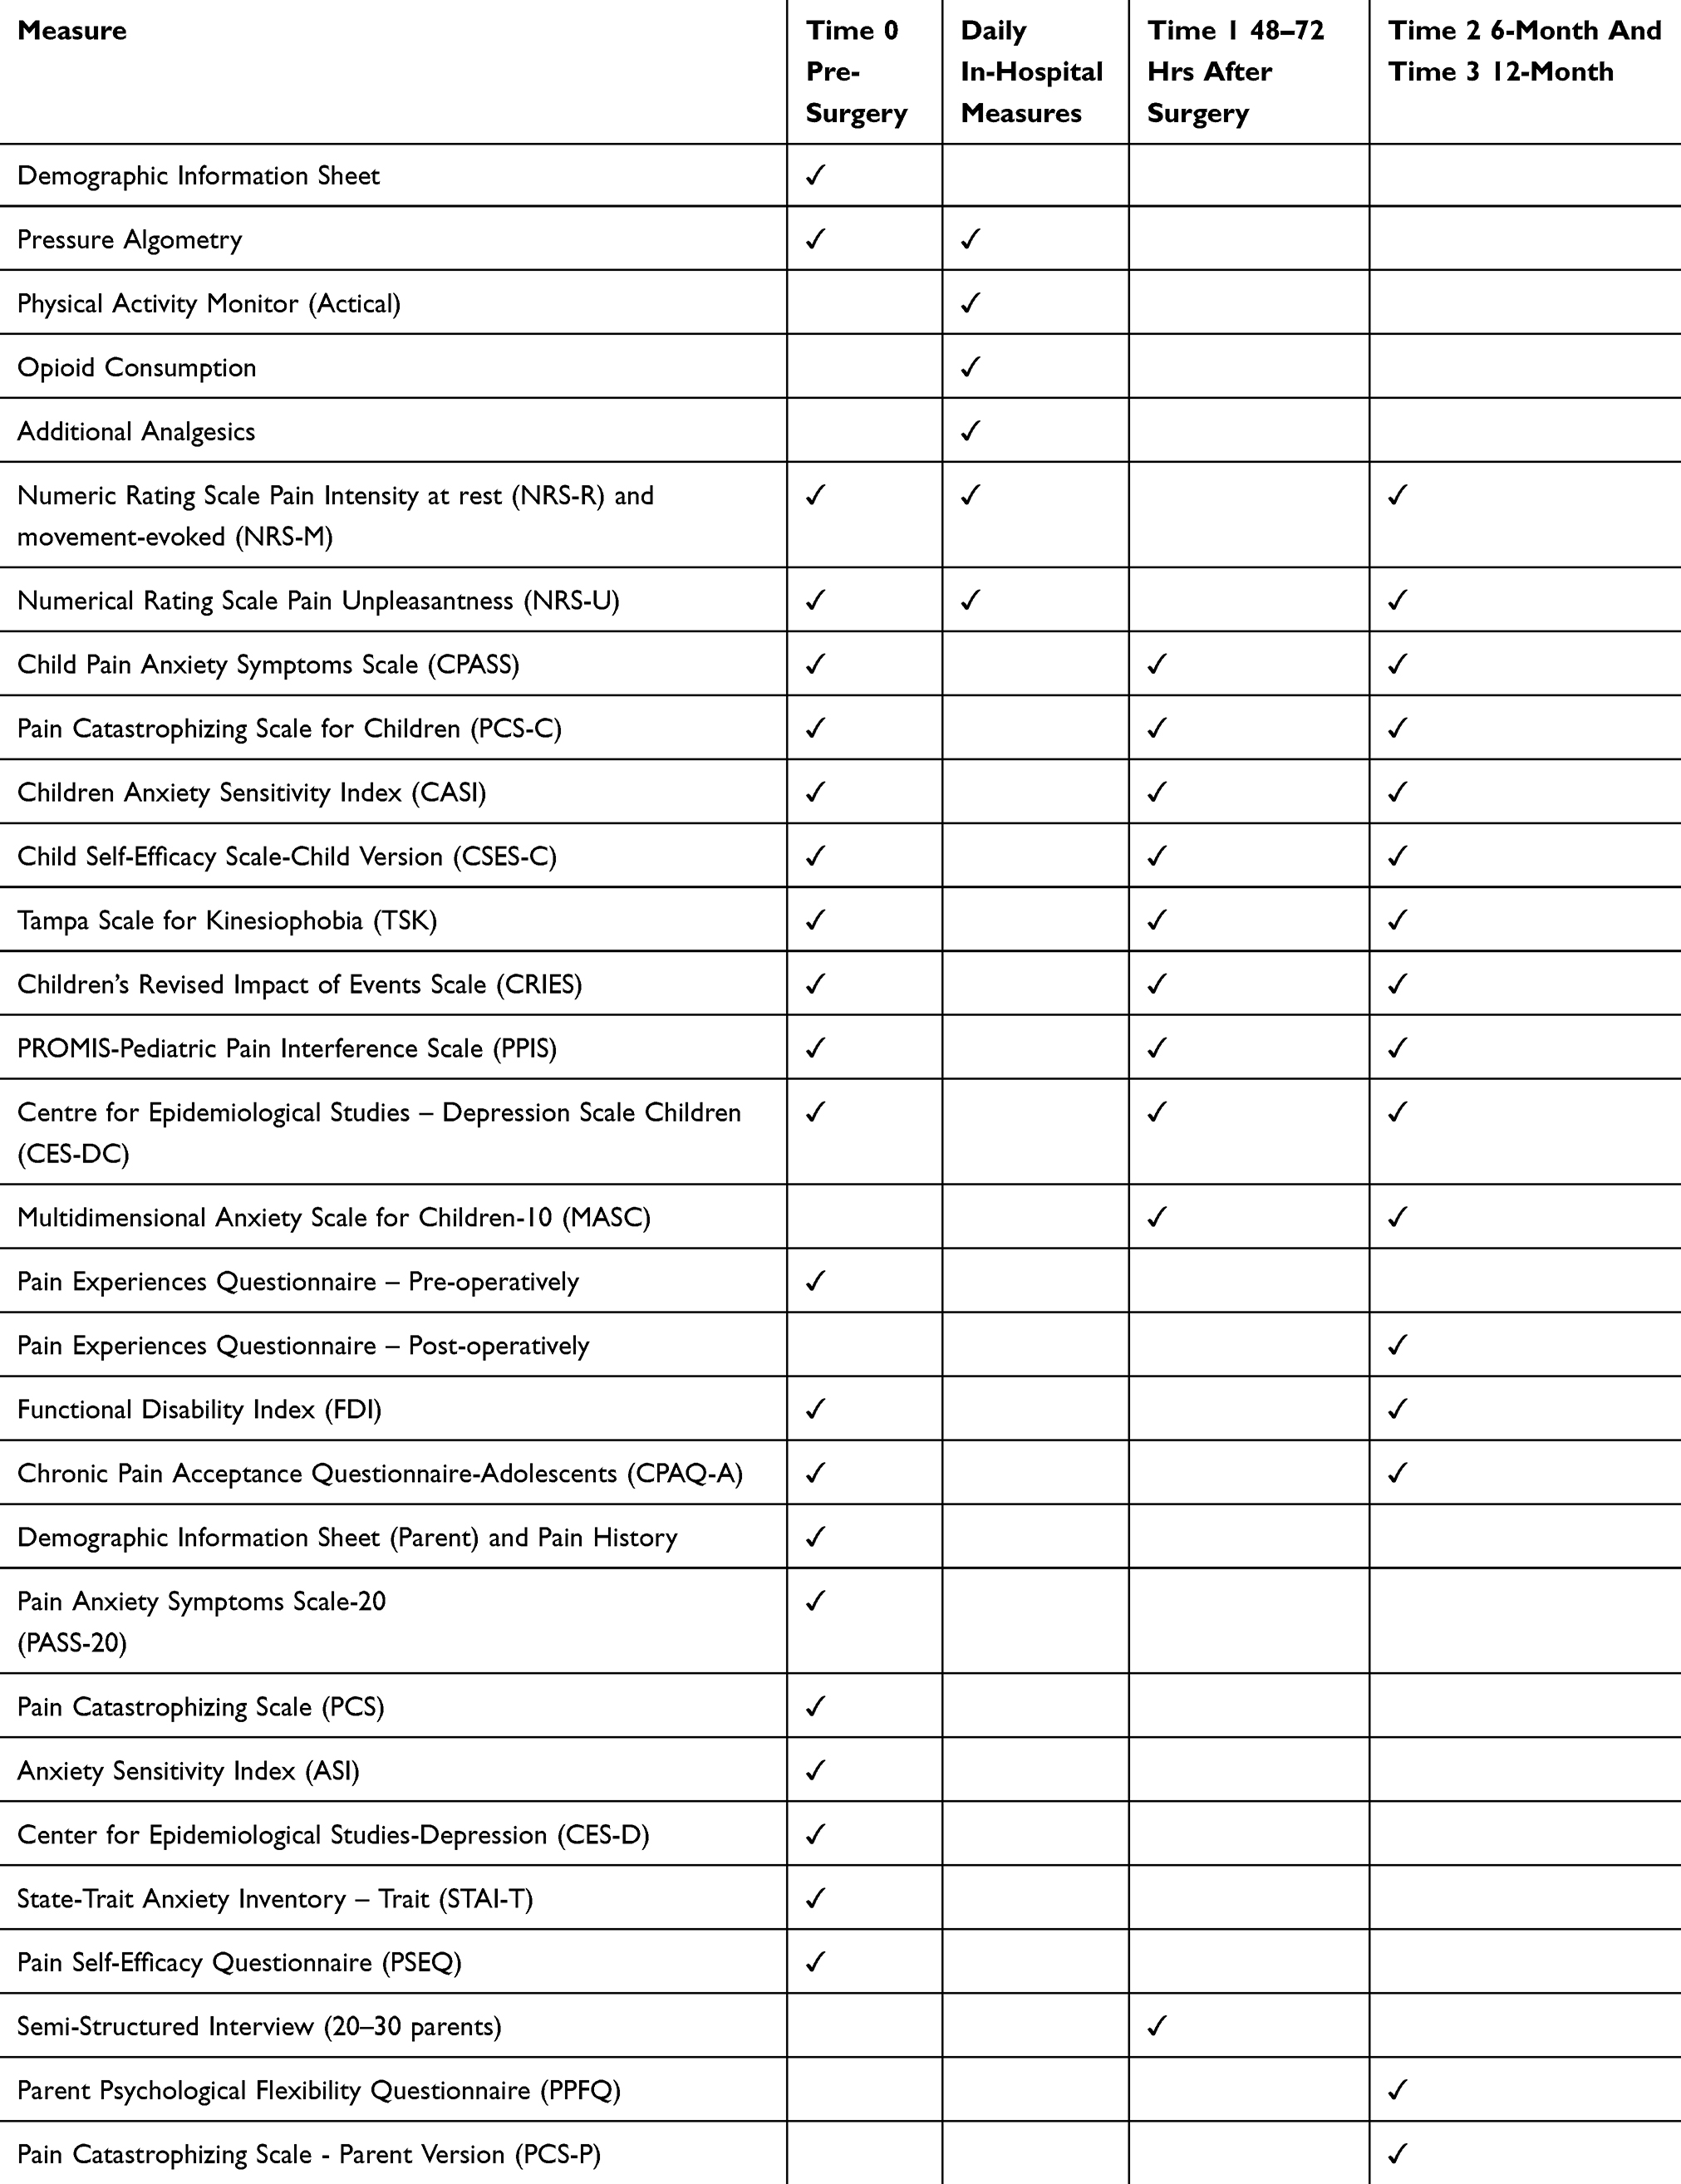 |
Table 1 Study Time Chart Depicting When Each Measure Was Administered To Children And Parents Over The Course Of The Study |
Child Measures
Physical Measures
Pain thresholds in response to mechanical pressure applied to the skin were obtained using a Pressure Algometer, a hand-held device consisting of a 1.5 cm rubber tip attached to a spring-loaded gauge with an analog display that registers the applied force in lbs/sq in and kg/sq cm (Baseline® Dolorimeter, Model PR0379 and PR0376, Algeos Ltd, Liverpool, UK). The algometer was applied with a constantly increasing pressure to a point on the skin over muscle at a rate of 0.5 kg/second. The participant indicated when the pressure first became painful. Pressure pain threshold (PPT) was defined as the force (pressure/unit area) at which the participant first reported pain. Participants were then asked to rate the intensity of the pain using an 11-point NRS. Baseline PPTs were obtained at the pre-admission visit, from the proposed incision site and at control sites on the right and left forearm (anterior aspect midway between the wrist and elbow). PPTs were obtained postoperatively on a daily basis 5 cm from the edge of the wound dressing (to assess secondary mechanical hyperalgesia) and at control points on both forearms (anterior aspect midway between the wrist and elbow). Pain pressure thresholds have been tested and validated in a pediatric sample with orthopedic disorders.18 PPT results are not reported in the present article and will be the subject of a subsequent report.
The Actical Physical Activity Monitor (Respironics, Inc., Bend, Oregon) is a small, non-invasive, wrist watch-sized device that contains an omnidirectional accelerometer designed to measure physical activity and caloric expenditure on a continuous basis. The physical activity monitor provides an objective, quantifiable measure of average activity levels and changes in activity levels. The physical activity monitor was attached to the child’s non-dominant wrist in the Post-Anesthetic Care Unit (PACU) after surgery and remained attached until hospital discharge, thereby providing a continuous measure of physical activity throughout the hospital stay. The Actical physical activity monitor has been used in past studies of children in a post-surgical hospital setting.19 Total daily (24 hr) activity counts were computed for the days following surgery starting on post-operative day one. Total counts were used because the children were not on regular sleep-wake cycles.
Questionnaires
The NRS is an 11-point verbally administered scale that measures the subjective experience of pain intensity (I) or pain unpleasantness (U). The NRS-I ranged from 0 (no pain at all) to 10 (worst possible pain). The NRS-U ranged from 0 (not at all unpleasant/horrible/yucky) to 10 (most unpleasant/horrible/yucky). The NRS has excellent reliability and validity and has been validated for acute postsurgical pain in children aged 7–17 years.20
The CPASS21 is a 20-item scale that measures the fear and anxiety-related thoughts, feelings, behaviors, and physical sensations that accompany the experience and anticipation of pain. It is a modified version of the adult PASS-2022 and can be administered to children as young as eight years old.22 Each item is rated on a scale of 0 (never) to 5 (always) and overall scores range from 0 to 100 with higher scores indicative of greater pain-related anxiety. CPASS has excellent internal consistency (α = 0.89 to 0.903) and strong construct validity.21,23,24 Internal consistency for the present study was excellent at T0 (α = 0.920), T1 (α = 0.941), T2 (α = 0.925), and T3 (α = 0.932).
The 13-item PCS-C is a child version of the PCS26 that measures the thoughts and feelings children may experience when they are in pain, including unrealistic beliefs that the current situation will lead to the worst possible pain outcome, negative thoughts about the future and self, and “an exaggerated negative ‘mental set’ brought to bear during actual or anticipated pain experience” (p. 53,27). Each item is rated on a 5-point scale ranging from not at all (0) to all the time (4). The PCS-C yields a total score and three subscale scores assessing (1) rumination, (2) magnification, and (3) helplessness. The PCS-C has excellent internal consistency (α = 0.90) and strongly correlates with pain intensity (r=0.49) and disability (r=0.50).25 Internal consistency for the present study was excellent at T0 (α = 0.935), T1 (α = 0.942), T2 (α = 0.926), and T3 (α = 0.932).
The CASI28 is an 18-item scale that measures the extent to which the symptoms of anxiety (eg, increased heart rate, shortness of breath, racing thoughts) are feared due to the belief that they will have harmful somatic, psychological, and/or social consequences. Each item is rated on a scale of 1 (none) to 3 (a lot). Total scores range from 18 to 54 with higher scores indicative of greater anxiety sensitivity. The CASI has very good internal consistency (α = 0.87), satisfactory test–retest reliability (r = 0.76) and adequate construct validity.28 Internal consistency for the present study was very good T0 (α = 0.864), T1 (α = 0.872), T2 (α = 0.850), and T3 (α = 0.856).
The CSEC-C29 is a 7-item measure of a child’s belief that they can engage in specific activities, such as going to school, taking care of him/herself, and participating in activities with family or friends, without assistance. Each item is rated on a 5-point scale ranging from 1 (very sure) to 5 (very unsure). Total scores range from 7 to 35 with lower scores indicative of greater self-efficacy. The CSES-C has good internal consistency (α = 0.80 to 0.83).29 Internal consistency for the present study was excellent at T2 (α = 0.901), and very good at T0 (α = 0.877), T1 (α = 0.891), and T3 (α = 0.860).
The TSK30 is a 17-item scale that measures fear of movement-evoked pain and injury. Scale items ranges from 0 (strongly disagree) to 4 (strongly agree) with 4 reversed-scored items. Total scores range from 25 to 56 with higher scores indicative of a greater fear of movement. The TSK has good internal consistency (α = 0.83) and validity.31 Internal consistency for the present study was good at T0 (α = 0.921), T1 (α = 0.878), T2 (α = 0.851), and T3 (α = 0.866).
The CRIES is a 13-item scale that measures posttraumatic stress disorder (PTSD) symptoms in the previous six months. Each item is rated based on its frequency of occurrence on a 4-point scale, from 0 (none) to 5 (a lot). A score of 30 or higher indicates a very likely presence of PTSD. The CRIES has good reliability (α=0.80)33 and high validity as a screening measure for PTSD.34 Internal consistency for the present study was excellent at T0 (α = 0.906), and very good at T1 (α = 0.881), T2 (α = 0.879), and T3 (α = 0.894).
The 8-item PPIS35 assesses how the child’s pain has interfered with certain aspects of their life over the past 7 days (eg, sleep, attention, schoolwork, physical activities, emotion). Each item is rated on a 5-point scale ranging from “never” to “almost always”. Scores range from 0 to 32 where higher scores indicate greater pain-related functional impairment. The PPIS consistently achieves a reliability of 0.85.35,36 Internal consistency for the present study was excellent at T0 (α = 0.933) and T3 (α = 0.919) and very good at T2 (α = 0.896).
Derived from the CES-D for adults,37 the CES-DC38 was developed to assess depressive symptoms in children and adolescents. The CES-DC consists of 20 items that examine depressed mood, worthlessness, helplessness, psychomotor retardation, and eating and sleeping problems. Items are rated on a scale from 0 (not at all) to 3 (a lot) to indicate how frequently each statement was experienced “in the past week”. Total scores range from 0 to 60 with higher scores indicating more severe depressive symptoms. The CES-DC has excellent internal consistency (α = 0.89) and good convergent validity.38 Internal consistency for the present study was excellent at T0 (α = 0.921) and T1 (α = 0.900), and very good at T2 (α = 0.894) and T3 (α = 0.898).
The MASC-1039 is a 10-item, shortened version of the 39-item MASC-39.40 Both versions measure self-reported physiological responses, harm avoidance, social and separation anxiety.40 Items are rated on a scale from 0 (never true about me) to 3 (often true about me). Total scores range from 0 to 30 (MASC-10) and from 0 to 117 (MASC-39), with higher scores indicating more symptoms of anxiety. The MASC-39 has good internal consistency (α = 0.60 to 0.85), strong test–retest reliability (r = 0.79 to 0.93), good convergent validity (correlates significantly with the Revised Children’s Manifest Anxiety Scale), and also has good discriminant validity.40 Internal consistency of the MASC-39 for the present study was excellent (α = 0.906). The MASC-10 has excellent internal consistency (α = 0.89), strong test–retest reliability (r = 0.86), and good convergent and discriminant validity.39,40 Internal consistency of the MASC-10 for the current study was poor at T1 (α = 0.796), T2 (α = 0.780), and T3 (α = 0.794).
The FDI41 is a 15-item scale that measures the extent to which children experience difficulties in completing daily tasks and activities (eg, “Walking to the bathroom”, “Eating regular meals”, and “Being at school all day”). Each item is rated on a 5-point Likert Scale, which ranges from 0 (no trouble) to 4 (impossible). The total score ranges from 0 to 60 with higher scores indicative of increasing difficulty engaging in the activities. A score of 13 or more indicates moderate-to-severe disability and a score of less than 13 indicates no-to-mild disability.17 FDI has excellent internal consistency (α = 0.90) and has good concurrent validity.41 The internal consistency of the FDI for the present study was excellent at T0 (α = 0.919) and T3 (α = 0.910) and very good at T2 (α = 0.864).
The CPAQ-A42 is a 20-item scale that measures an adolescent’s acceptance of chronic pain. Items are rated on a 5-point scale ranging from 0 (never true) to 4 (always true). The CPAQ-A has two subscales: activity engagement and pain willingness. The internal consistency for the activity engagement subscale has been shown to be good (α = 0.86) and also adequate for pain willingness (α = 0.75).42 Internal consistency for the present study was very good at T0 (α = 0.876), T2 (α = 0.866), and T3 (α = 0.878).
Parent Measures
PASS-2022 consists of 20 items that measure the fear and anxiety-related thoughts, feelings, behaviors, and physical sensations that accompany the experience and anticipation of pain. Each item is rated on a scale of 0 (never) to 5 (always) and total scores range from 0 to 100. The PASS-20 has four subscales: cognitive, escape/avoidance, fear, and physiological anxiety. The PASS-20 has good internal consistency (α = 0.81) and good construct validity. Internal consistency for the present study was excellent (α = 0.950).
The PCS26 is a 13-item self-report scale that measures the thoughts and feelings that individuals may experience when they are in pain, including unrealistic beliefs that the current situation will lead to the worst possible pain outcome, negative thoughts about the future and self, and “an exaggerated negative ‘mental set’ brought to bear during actual or anticipated pain experience” (p. 53,27). Each item is rated on a 5-point scale ranging from 0 (not at all) to 4 (all the time). The PCS yields a total score and three subscale scores assessing rumination, magnification, and helplessness. The PCS has high internal consistency and validity.43 The PCS-P44 is the parent version of the PCS that measures the extent to which a parent catastrophizes about their child’s pain. The PCS-P has both strong construct validity and internal consistency (α = 0.81 to 0.93).44 The internal consistency of the PCS for the present study was excellent (α = 0.937). Internal consistency for the PCS-P was excellent at T0 (α = 0.923) and T3 (α = 0.924).
The ASI is a 16-item self-report measure assessing the extent to which participants fear the potentially negative consequences of symptoms and sensations related to anxiety. Each item is rated on a scale from 0 (very little) to 4 (very much), for a total score ranging from 0 to 64. Higher scores indicate greater anxiety sensitivity. The ASI has high internal consistency for the total score (α=0.83) and has good convergent and discriminant validity.46 Internal consistency for the present study was very good (α = 0.896).
The CES-D37 consists of 20 items and assesses depressive symptoms in adults. The measure surveys the following symptoms: depressed mood, worthlessness, helplessness, psychomotor retardation, and eating and sleeping problems. Items are rated on a scale from 0 (not at all) to 3 (a lot) to indicate how frequently each statement was experienced “in the past week”. Total scores range from 0 to 60. CES-D has shown to have high internal consistency (α = 0.85 to 0.90) and strong construct validity.37 Internal consistency for the present study was good (α = 0.803).
The STAI-T47 is a 20-item scale that measures a wide range of anxiety features. Items are rated on a scale from 0 (almost never) to 4 (almost always). It has shown to have great internal consistency (α = 0.86 to 0.95) and satisfactory test–retest reliability (r = 0.69 to 0.89).47 It also has good construct and concurrent validity.48 Internal consistency for the present study was excellent (α = 0.916).
The PSEQ49 is a 10-item measure that assesses an individual’s belief about their ability to engage in activities despite the pain they experience. Total scores range from 0 to 60; higher scores reflect higher self-efficacy beliefs. The PSEQ has shown to have excellent internal consistency (α = 0.93).50 Internal consistency for the present study was excellent (α = 0.948).
The PPFQ51 measures the ability of a parent to manage their distress about their child’s pain. The questionnaire consists of 17-items that are to be rated on a scale of 0 (never true) to 6 (always true). This measure showed to have excellent internal consistency (α = 0.91).51 Internal consistency for the present study was good at T0 (α = 0.892) and excellent at T3 (α = 0.903).
Semi-Structured Interview
Semi-structured interviews were conducted with a purposive sample of 36 parents 48–72 hrs after their child’s surgery. Parents were targeted for variation in child age [eg, child age (older (13–18 years old) and younger (8–12 years old)) and sex (male and female)]. Interested parents were asked to sign an additional consent form before beginning the interview. Each interview took approximately 30–45 mins to complete. All of the interviews were audio recorded after written consent was obtained from each participant. Questions in the interview guides were based on our combined experiences, through a literature search and based on our previous work. Questions moved from the more general to the more specific with the overall goal of being able to describe parents’ perspectives of their child’s post-operative pain experience with probes used to fully explore their experience. The interview questions were pilot tested with 4 participants to further refine the interview guide. As such the interview guide was modified according to previous interviews in order to capture new themes that emerged. Results from these interviews will be reported in another manuscript.
Procedure
The study was reviewed and approved by the Research Ethics Boards at The Hospital for Sick Children (SickKids) (REB file # 1000019644) and the Human Participants Review Committee at York University (Certificate # 2010-276). The study was conducted in accordance with the Declaration of Helsinki. Parents provided informed written consent to participate and children provided informed assent for their participation.
Eligible children and their parents, who had been pre-screened by an operating room nurse in the patients’ circle of care, were approached by the research assistant. Children and their parents were recruited to participate either at the pre-operative assessment clinic visit or by telephone if they did not attend the pre-operative clinic. This prospective, longitudinal study involved four assessment time points over the course of a year: pre-operative, in-hospital, and 6 and 12 months post-operative.
The baseline assessment included administration of child and parent questionnaires and child pressure pain thresholds using pressure algometry by the research assistant as described earlier. The child completed questionnaires (see Table 1) asking about previous and current pain experiences, as well as relevant psychological and emotional functioning. Parents completed questionnaires about their psychological functioning (PASS-20, PCS, ASI, CES-D, STAI-T, PSEQ). The order of questionnaire administration was randomized within subjects to minimize fatigue and order effects. The child’s pre-operative medication use (analgesics and others) was obtained from the parents and confirmed by the patient’s hospital medical record.
Each patient received a general anesthetic. The following intraoperative factors were extracted from the surgical and anesthetic records: duration of surgery, analgesic/anesthetic regime including use of epidural/regional anesthetic techniques, systemic opioids, and non-opioid adjuvants.
Physical activity was measured continuously while in hospital using a non-invasive Actical physical activity monitor. Pain intensity scores (NRS-I), pain unpleasantness scores (NRS-U), and pressure pain thresholds were obtained daily by a research assistant. NRS-I, NRS-U, and pressure pain thresholds were also obtained by a research assistant on one occasion between 48 and 72 hrs postoperative at the same time that the T1 self-report measures were administered. Postoperative analgesic use (eg, opioid consumption, adjunct analgesics) was recorded from the child’s medical record. In addition, 48–72 hrs after surgery children completed self-report measures and a purposive sample of parents completed a semi-structured interview conducted by Rosenbloom (See Table 1).
Six and 12 months after surgery, the research assistant followed up with participants by telephone to complete a set of measures to determine pain (NRS-I, NRS-U) psychological and emotional adaptation, current pain medications, incidence, intensity, quality of chronic postsurgical pain and the extent to which it interferes with daily activity. At the 12-month follow-up, a research assistant conducted a pain memory interview with children and their parents. At the 12-month telephone follow-up, the research assistant orally led parents through two questionnaires measuring their psychological flexibility and pain catastrophizing about their child’s pain.
All of the questionnaires were self-administered. However, we cannot exclude the possibility that the child/adolescent might not have completed them by themselves in the pre-operative period when participants either took them home to complete and return on the day of surgery. Otherwise, for participants who completed the questionnaires in the pre-anesthesia clinic, a research assistant was present and could see that the participants were completing the forms themselves and was available to help if needed. For the remaining time points, the child/adolescent alone completed the questionnaires: For the in-hospital time point, questionnaires were completed by the child/adolescent and, at times, the questionnaires were read to the participants who responded verbally (eg, when the surgery type made it difficult for the child to write). The 6- and 12-month questionnaires were completed over the phone with the research assistant reading the questions to the children. This was done to be sure that the child was the one completing the questionnaires and also to avoid missing data.
Data Analysis
A growth mixture model (GMM) was used to characterize pain intensity and pain unpleasantness trajectories for adolescents over four time points including pre-surgical, in-hospital post-surgical, and 6 and 12 months post-surgical. Participants with three or more time points completed were included in the analysis. Previous research in adult surgical populations has shown linear and quadratic shaped post-operative pain trajectories.52,53 Therefore, we tested a total of 14 different models each for pain intensity and pain unpleasantness that varied based on the number of trajectories (up to 7), and the presence of a linear and a quadratic term. All models were tested using the latent class mixed model (lcmm) package in R version 3.5.1. Model selection was based on the Bayesian information criterion (BIC) and Akaike Information Criterion (AIC), where lower values indicate better model fit. An additional indicator of model fit included a minimum of 5% of the participants classified in each trajectory. Local maxima were tested in the final model.
Once the best-fitting trajectory model was selected, the following biopsychosocial child pre-surgical and surgical variables were individually entered into univariate logistic regressions to predict trajectory class membership for pain intensity and for pain unpleasantness: age, sex, functional disability, fear of movement, pre-surgical pain-related anxiety and worry (pain catastrophizing, pain anxiety), general anxiety and worry (anxiety sensitivity, general anxiety), depression, pre-surgical pain self-efficacy, pain acceptance, symptoms of posttraumatic stress, surgery type, regional anesthesia, activity level on post-operative days 2 and 3, and cumulative five-day opioid consumption. The following parental factors were individually entered into the logistic regression to predict class membership: pre-surgical pain catastrophizing, pre-surgical anxiety sensitivity, pre-surgical pain anxiety, pre-surgical pain psychological flexibility, and pre-surgical depression. We tested for collinearity among variables. Significant predictors (p <0.20) were chosen for inclusion in the multivariable model.
A logistic regression was used to predict moderate-to-severe functional disability on the FDI. The FDI was split by a previously established cut off score of 13 or more indicating moderate-to-severe disability and a score of less than 13 indicating no-to-mild disability.17 The same predictors as described earlier as well as the trajectory groups for pain intensity and pain unpleasantness were individually entered into the model. Significant (p<0.20) variables were then entered into the multivariable model.
Results
Recruitment And Retention Of Participants
Recruitment took place between February 2011 and August 2015. Figure 1 shows recruitment details and participant flow through the study. Records of children who were assessed and found not eligible between February 2011 and August 2014 were lost; therefore, Figure 1 shows eligibility numbers between September 2014 and August 2015.
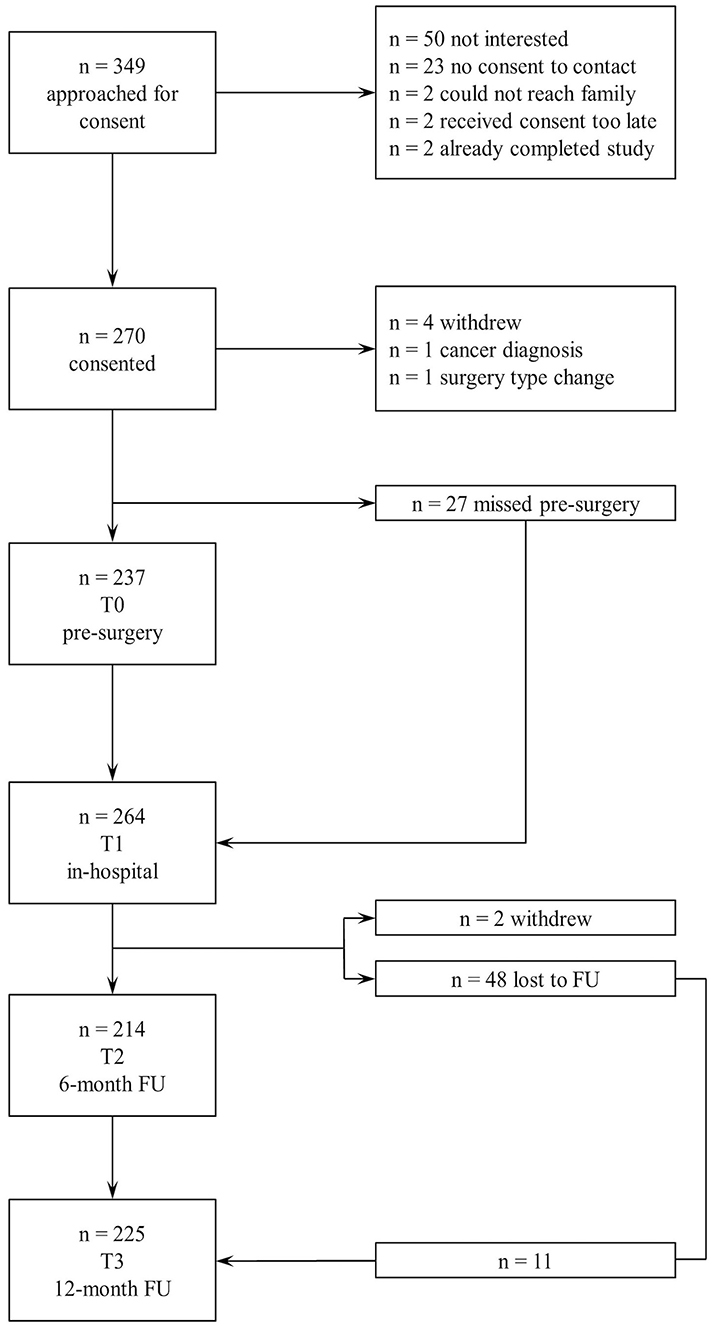 |
Figure 1 Participant recruitment and flow through the study. |
Of the 349 approached for consent, 270 children and their parents consented to participate. Three children withdrew consent before participating in any part of the study, one patient’s surgical procedure was changed and no longer met study criteria, and 27 children were missed (ie, the research assistant was unable to locate or reach them) for their T0 assessment. One patient was diagnosed with cancer after consent and was withdrawn from the study. A total of 264 participants completed at least some part of the in-hospital (T1) assessment (eg, questionnaire, pressure algometer, actigraphy, daily pain measures). Twenty-seven participants were admitted directly to the intensive care unit (ICU) from the operating room and therefore the research assistant was unable to obtain daily pain measures. The 6- and 12-month retention rates of participants in this study were 81.1% (95% CI 75.9% to 86.4%) and 85.3% (95% CI 80.7% to 89.9%), respectively.
Significant differences at baseline were not found between participants who completed the study at 12 months and those who did not on any of the measures, except the PPIS. Participants who completed the study had significantly lower baseline PPIS scores (M = 14.4, SD = 9.6) than those who did not complete the study (M = 23.0, SD = 5.4), t(162) = 2.162, p = 0.031.
Demographic And Clinical Variables
The final sample consisted of 265 children [n = 155 female (58.5%), M age = 14.1 years (SD = 2.5), range 8–18 years] and their parents or guardians [n = 188 female (83.9%), M age = 45.1 years (SD = 5.9), range 29–70 years, 41 parents did not answer the demographic questionnaire]. The majority of children identified as Caucasian (65.7%; Table 2). Sixty-two percent of participants (n = 166, 62.6%) had a previous surgery, and 61.1% (n = 162) had chronic pain prior to the current surgery. Forty-three percent (n = 103, 43.8%) reported moderate-to-severe pain at the surgical site prior to surgery, and 23.3% (n = 56) also had moderate-to-severe functional disability. Only 8% (n = 21) of participants were taking pain medications prior to their current surgery.
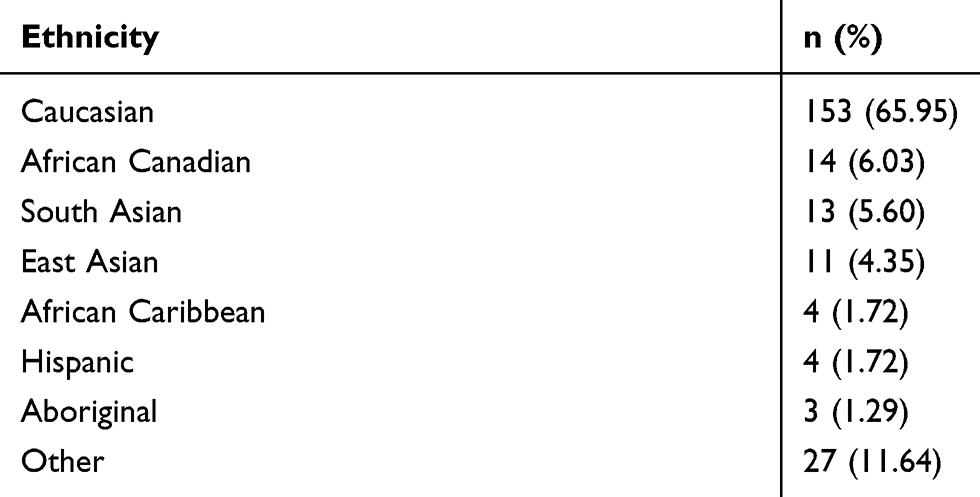 |
Table 2 Ethnicity Of Child And Parents (N = 265; N = 36 Did Not Identify Their Ethnicity) |
The majority of children underwent surgery for scoliosis (n = 133, 50.2%) and 35.5% (n = 94) underwent an osteotomy. Fourteen children (5.3%) had a Ravitch procedure, four had a Nuss procedure (1.5%), four (1.5%) had a thoracotomy, and fifteen (5.7%) had another type of surgery. The mean duration of surgery was 4.59 hrs (SD = 2.07 hrs, range = 0.70–10.70 hrs) and children stayed in hospital an average of 4.9 days [SD = 2.9, range 1–36 days]. Participants who were transferred to the ICU had significantly longer surgical times (p < 0.001) and hospital stays (p = 0.001).
Incidence Of CPSP And Functional Disability
Pain and functional disability outcomes for the total sample can be seen in Table 3. In total, 35.5% (95% CI 29.1% to 41.9%, n = 76/214) of children had moderate-to-severe pain (ie, pain rated at a 4 or more out of 10) 6 months after surgery, and of these, 7.5% (95% CI 3.9% to 11.4%, n = 15/201) had been pain-free prior to surgery. A total of 11.9% (95% CI 7.4% to 16.4%, n = 24/201) of children who had moderate-to-severe pain prior to surgery reported being pain-free at 6 months post-operatively. At 12 months after surgery, 38.7% (95% CI 32.4% to 45.1%, n = 86/226) had moderate-to-severe pain, and of these, 9.2% (95% CI 5.3% to 13.1%, n = 19/207) had been pain-free prior to surgery. A total of 9.2% (95% CI 5.3% to 13.1%, n = 19/207) of children who had moderate-to-severe pain prior to surgery reported being pain-free at 12 months post-operatively. Table 4 shows the number and percentage of participants with and without preoperative pain who developed CPSP with no-to-minimal or moderate-to-severe functional disability.
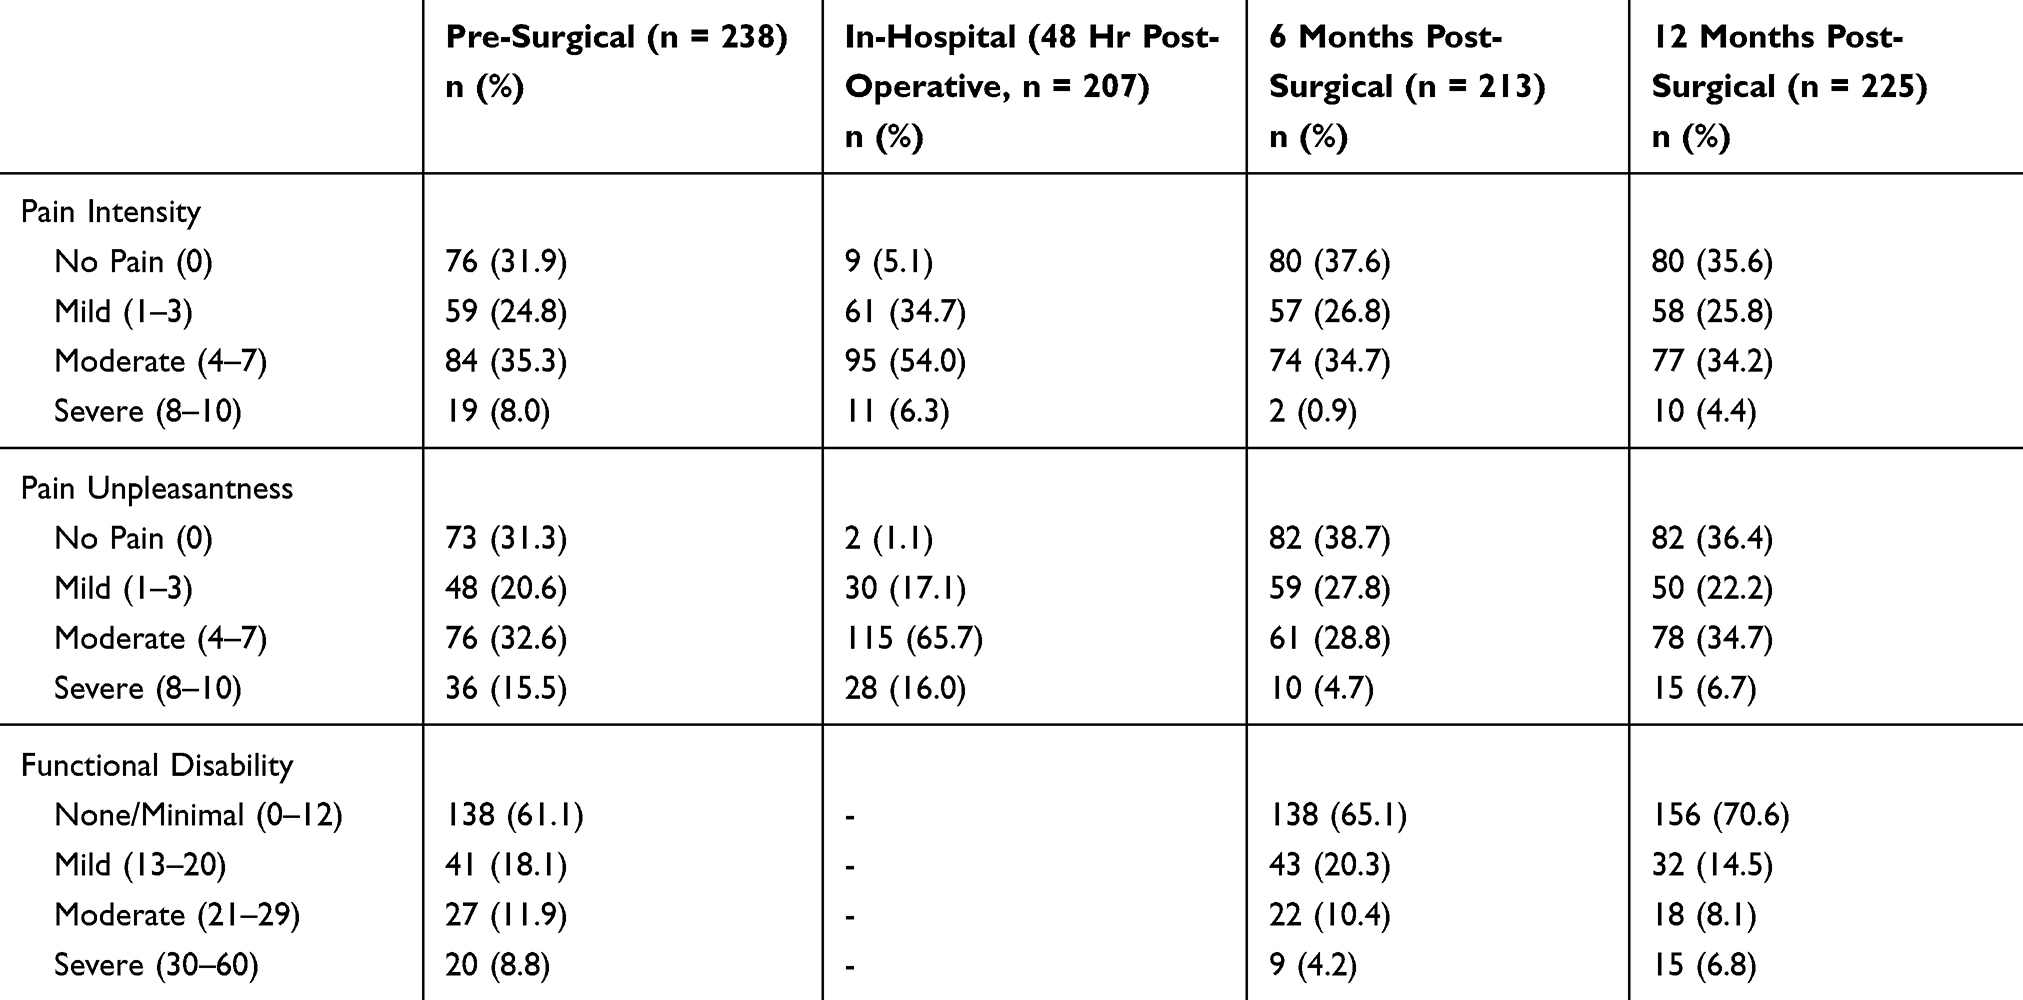 |
Table 3 Pre- And Post-Surgical Pain Intensity, Pain Unpleasantness, And Functional Disability Outcomes Across The Year-Long Period |
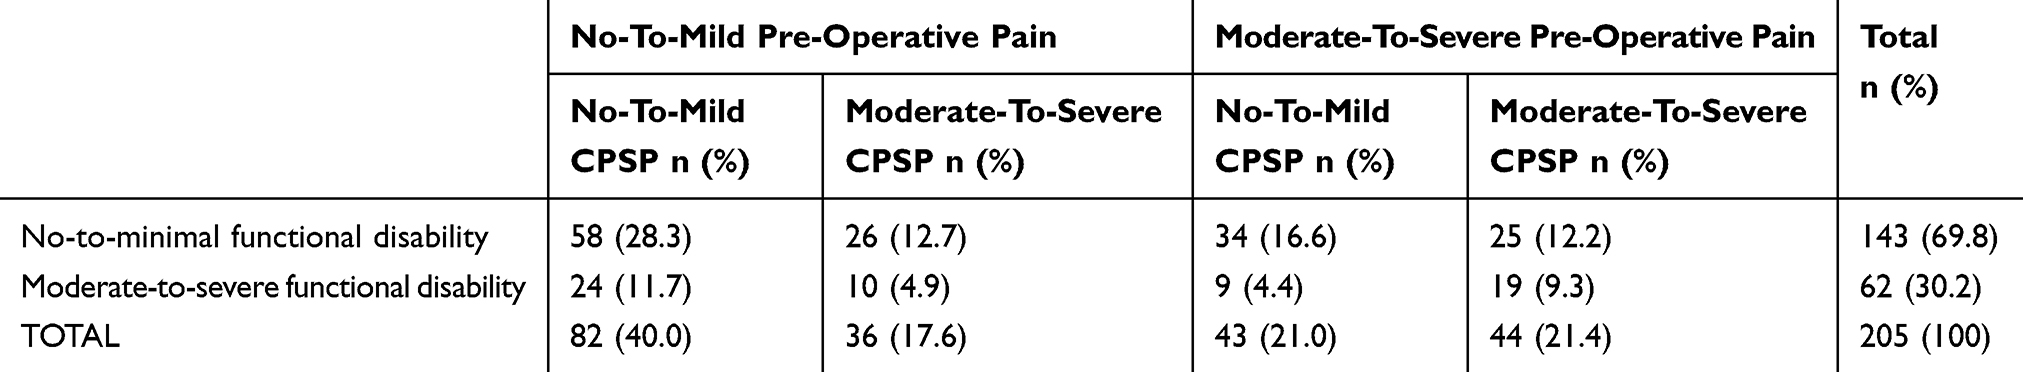 |
Table 4 Number And Percentage (%) Of Children With And Without Preoperative Pain Who Developed Chronic Post-Surgical Pain (CPSP) At 12 Months With No-To-Minimal Or Moderate-To-Severe Functional Disability |
Further, 32.7% (95% CI 26.4% to 39.0%, n = 70) and 29.3% (95% CI 23.4% to 35.3%, n = 66) of children had moderate-to-severe functional disability 6 and 12 months after surgery, respectively. Pain intensity was moderately, positively associated with functional disability at both 6 (r = 0.357, p < 0.001) and 12 months (r = 0.209, p = 0.002) after surgery. In terms of co-occurrence, 17.5% (95% CI 12.4% to 22.6%, n = 37) and 13.8% (95% CI 9.2% to 18.3%, n = 31) had both moderate-to-severe pain and moderate-to-severe disability at 6 and 12 months after surgery, respectively.
Medication Use
Opioid Use
Prior to surgery, three children (1.3%, 95% CI 0% to 2.7%) were using opioids to manage their pain. Two children continued to use opioids after surgery, while one child stopped using opioids. In total, 3.7% (95% CI 1.17% to 6.23%, n = 8) reported using opioids 6 months after surgery and 4.0% (95% CI 1.45% to 6.55%, n = 9) were using opioids at 12 months.
Non-Opioid Medication Use
Prior to surgery, 2.5% (95% CI 0.51% to 4.5%, n = 6) reported using acetaminophen and/or non-steroidal anti-inflammatory agents (NSAIDs) for pain management when needed. After surgery, 27.0% (95% CI 21.1% to 33.0%, n = 58) and 27.0% (95% CI 21.2% to 32.8%, n = 61) reported using acetaminophen and/or NSAIDs when needed 6 and 12 months after surgery, respectively.
Pain Intensity Trajectories
As shown in Table 5, 14 models were tested. The final model was based on the lowest BIC and AIC values, which included a two-class model with a quadric slope. The two different pain intensity trajectories are presented in Figure 2 with the parameters for the final model shown in Table 6. Trajectory one (n = 136) consisted of children who started with mild pain intensity, which remained mild in-hospital, and at 6 and 12 months. Trajectory two (n = 123) consisted of children who started with moderate-to-severe pain intensity and who continued to have moderate-to-severe pain post-surgically. Trajectory two also included a significant decrease in pain intensity from Day 2 to 6 months post-surgically. Table 7 shows the means and standard deviations across time for the two trajectories.
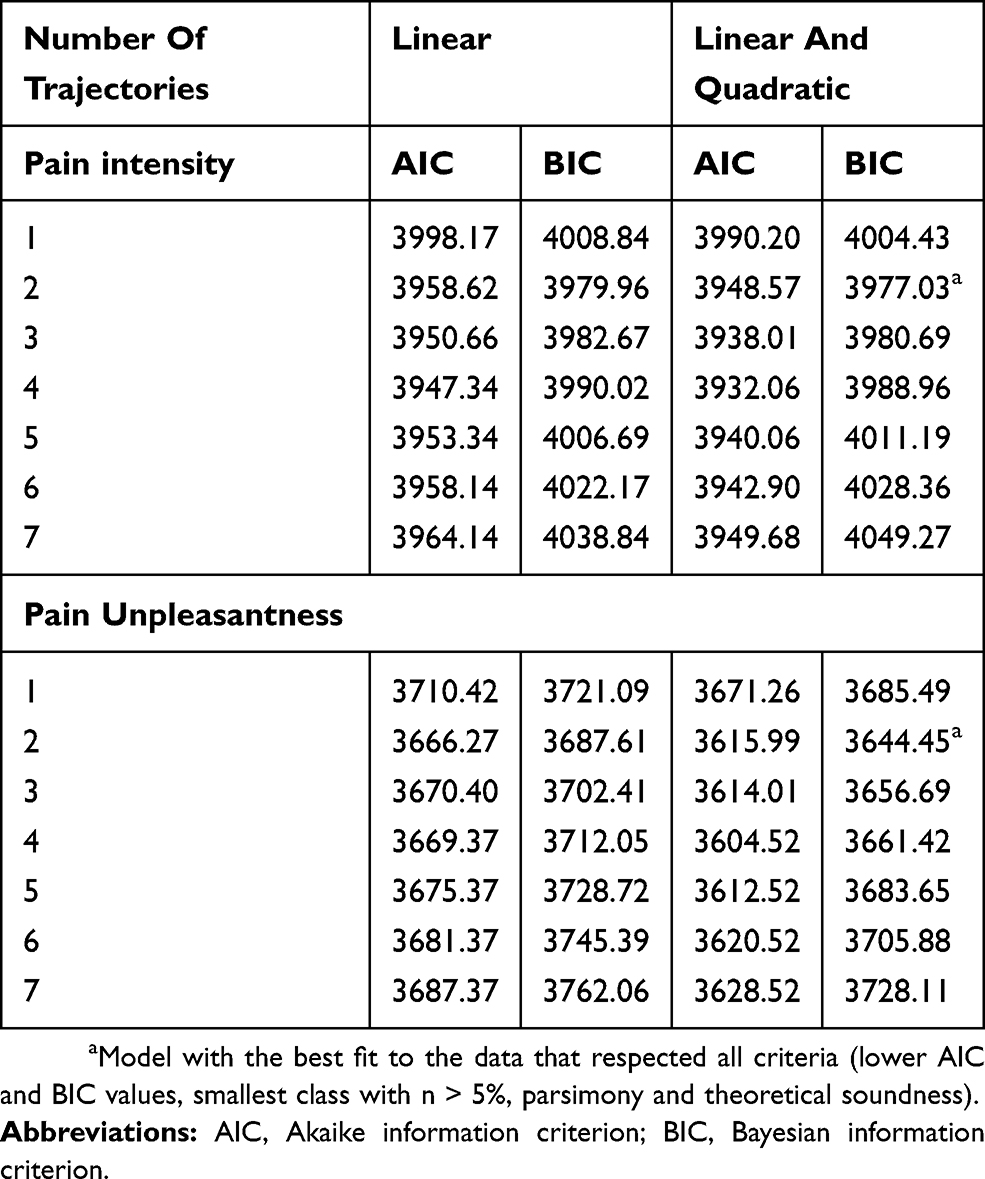 |
Table 5 Model Fit For Pain Intensity And Pain Unpleasantness Trajectories |
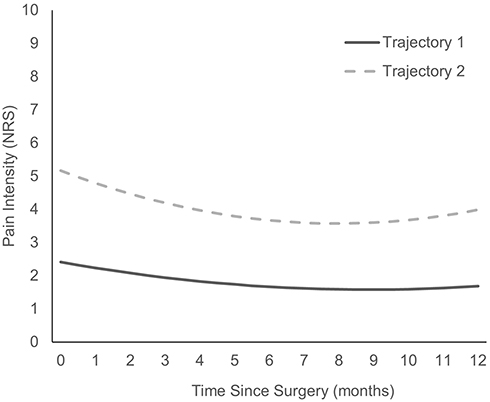 |
Figure 2 Predicted pain intensity trajectories. |
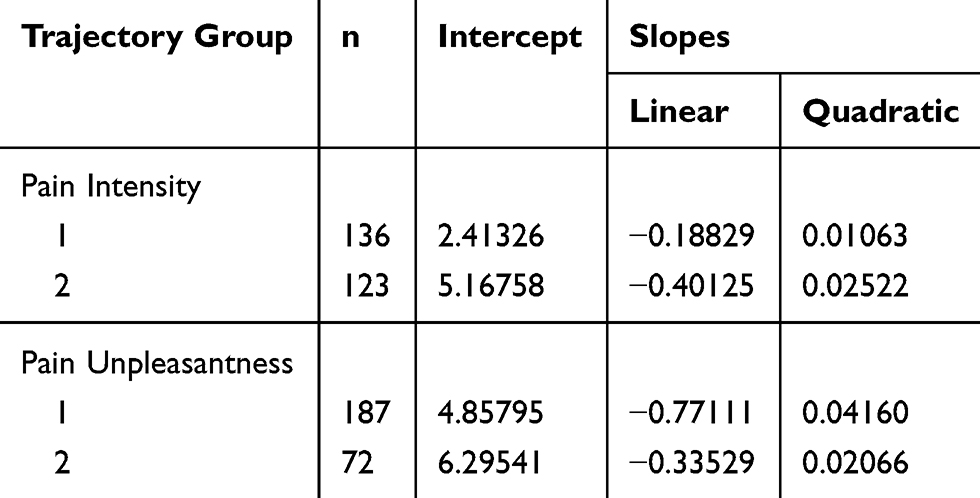 |
Table 6 Pain Intensity And Pain Unpleasantness Trajectory Characteristics And Parameters |
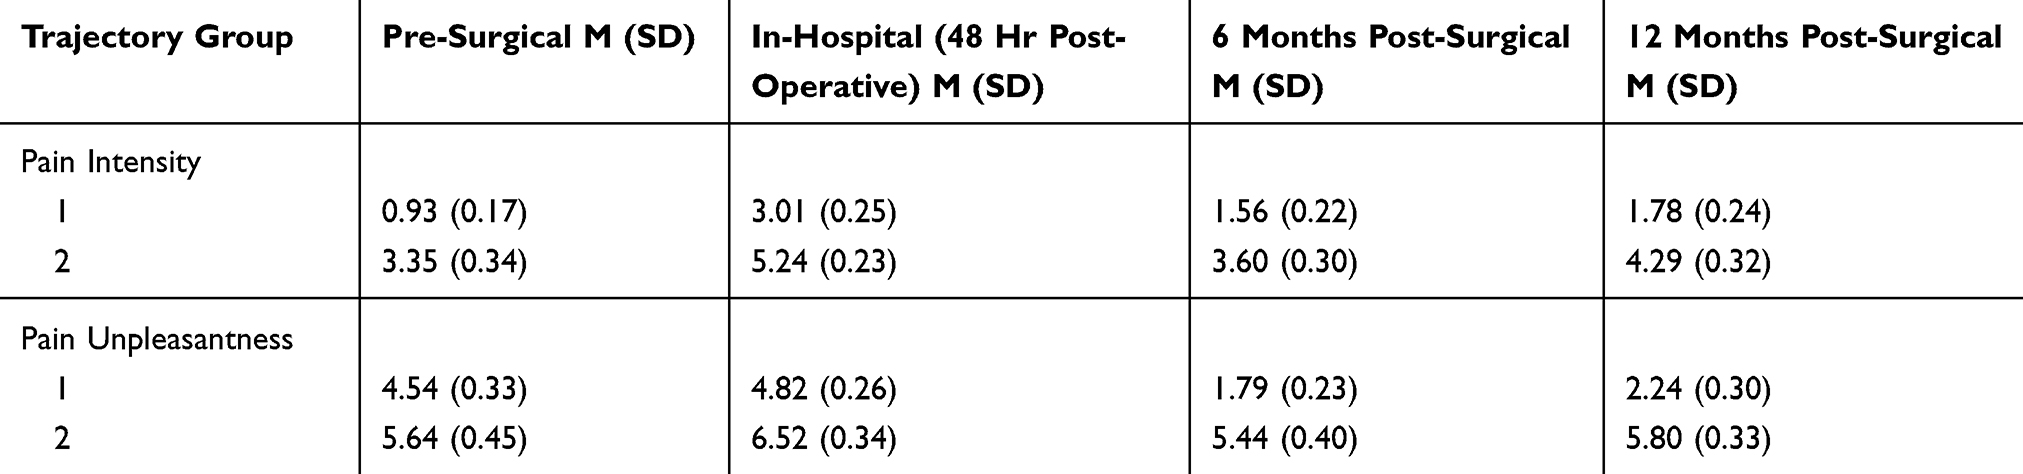 |
Table 7 Mean (Standard Deviation [SD]) Observed Pain Intensity And Pain Unpleasantness Values By Trajectory Group Membership |
Pain Unpleasantness Trajectories
The 14 models for pain unpleasantness are shown in Table 5. The final model was based on the lowest BIC and AIC values, which included a two-class model with a quadric slope. The two pain unpleasantness trajectories are presented in Figure 3. The characteristics and parameters estimated of the regression equation for each trajectory are shown in Table 6. Trajectory one (n = 187) consisted of children who started with lower pain unpleasantness that remained lower in-hospital, as well as at 6 and 12 months. Trajectory two (n = 72) consisted of children who started with higher pain unpleasantness ratings and who continued to have higher pain unpleasantness post-surgically. Trajectories one and two also included a significant decrease in pain unpleasantness from Day 2 post-surgically to 6 months post-surgically, but the decrease in pain unpleasantness was steeper in trajectory one than two. Table 7 shows the means and standard deviations across time for the two pain unpleasantness trajectories.
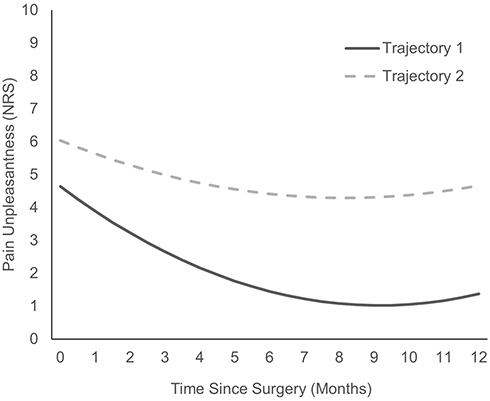 |
Figure 3 Predicted pain unpleasantness trajectories. |
Baseline Predictors Of Pain Intensity Trajectories
There was a high degree of collinearity between pain catastrophizing and pain anxiety scores. To address this, we averaged the total scores on the PCS-C and CPASS to form a pain-related anxiety and worry variable. Similarly, total scores for anxiety sensitivity (CASI) and general anxiety (MASC) were averaged to form a general anxiety variable.
To determine baseline predictors of pain intensity trajectory class membership, univariate logistic regression analyses were conducted (Table 8). Significant factors associated with pain intensity trajectory group membership at the univariate level included: age, sex, PICU admission, surgery type, use of regional analgesia, cumulative 5-day opioid consumption, baseline functional disability, baseline symptoms of post-traumatic stress, baseline symptoms of depression, baseline pain-related anxiety and worry, baseline non-pain-related anxiety, and baseline parent pain flexibility. Six variables (age, PICU admission, surgery type, use of regional analgesia, cumulative 5-day opioid consumption, and baseline parent pain flexibility) were not significant when building the multivariable model (ie, every other factor individually accounted for more of the variance) and therefore we excluded them from the final model. A multivariable logistic regression was conducted with the final model shown in Table 9. The referent class was mild pain intensity. The final model (χ2 (7, n = 208) = 36.659, p < 0.001, Nagelerke R2 = 21.6%) included functional disability, cumulative 5-day opioid consumption, sex, general anxiety, pain-related anxiety and worry, symptoms of depression, and post-traumatic stress symptoms. Greater functional disability prior to surgery predicted a higher likelihood of being in the high pain intensity trajectory group (OR: 1.053, 95% CI: 1.019, 1.089, p = 0.002). In-hospital cumulative 5-day opioid consumption also significantly predicted group membership in the moderate-to-severe pain intensity trajectory (OR: 1.002, 95% CI: 1.001,1.003, p = 0.001). None of the parents, surgical, or activity variables significantly predicted pain intensity trajectory group membership. We conducted logistic regression analyses on 6-month predictors of trajectory membership for both pain intensity and pain unpleasantness. The results from the multivariable analyses revealed the same predictors of group membership, namely FDI, and thus are not reported in full.
 |
Table 8 Univariate Logistic Regression Analysis Showing The Relationship Between Baseline (T0) And Surgical (T1) Predictors And Group Membership In Pain Intensity Trajectories (referent Group Is No-To-Mild Pain Intensity Trajectory) |
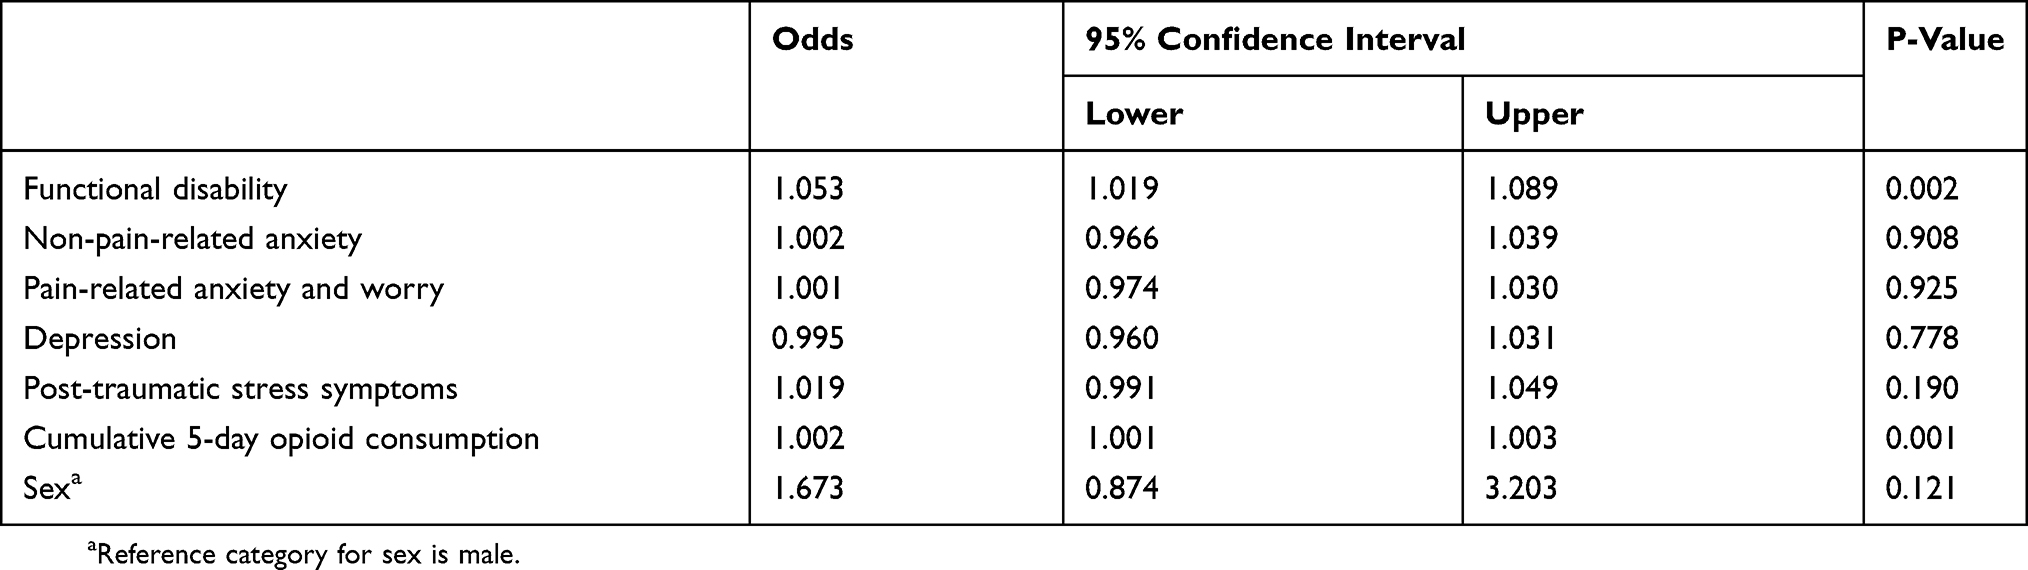 |
Table 9 Logistic Regression Of Baseline Predictors Of High Pain Intensity Trajectory Group (Referent Group Is No-To-Mild Pain Intensity Trajectory) |
Baseline Predictors Of Pain Unpleasantness Trajectories
To determine baseline predictors of pain unpleasantness class membership, univariate logistic regression analyses were conducted (Table 10). Significant factors at the univariate level associated with pain unpleasantness trajectory group membership included: activity level on post-operative days 2–3, baseline functional disability, baseline pain-related anxiety and worry, baseline non-pain-related anxiety, baseline fear of movement, baseline symptoms of post-traumatic stress, and parent pain psychological flexibility. Similar to predicting pain intensity trajectory group membership, the following factors did not contribute significantly to the multivariable model: activity level on post-operative days 2–3, baseline pain-related anxiety and worry, baseline non-pain-related anxiety, baseline symptoms of post-traumatic stress, and parent pain psychological flexibility. Therefore, the final multivariable logistic regression model (χ2 (2, n = 226) = 7.701, p < 0.001, Nagelerke R2 = 4.8%) included functional disability (FDI) and fear of movement (TSK). Greater functional disability prior to surgery predicted a higher likelihood of being in the high pain trajectory group (OR: 1.028, 95% CI: 1.000, 1.056, p = 0.047). Fear of movement did not significantly predict pain unpleasantness trajectory group membership (OR: 1.027, 95% CI: 0.982, 1.073, p = 0.250).
 |
Table 10 Univariate Logistic Regression Analysis Showing The Relationship Between Baseline (T0) And Surgical (T1) Predictors And Group Membership In Pain Unpleasantness Trajectories (Referent Group Is No-To-Mild Pain Unpleasantness Trajectory) |
Predictors Of Functional Disability At 12 Months
To determine factors associated with moderate-to-severe functional disability at 12 months after surgery, univariate logistic regression analyses were conducted (Table 11). Significant factors associated with moderate-to-severe functional disability at 12 months included: age, pain intensity trajectory, pain unpleasantness trajectory, baseline functional disability, pain-related anxiety and worry, non-pain-related anxiety, baseline chronic pain acceptance, baseline symptoms of depression, baseline symptoms of post-traumatic stress, and baseline pain self-efficacy. However, given the wide confidence intervals for age and baseline symptoms of post-traumatic stress, these factors were left out of the final model. A multivariable logistic regression was conducted with the final model shown in Table 12. The final model (χ2 (7, n = 159) = 24.921, p = 0.001, Nagelerke R2 = 20.3%) included baseline functional disability, baseline general anxiety, baseline pain-related anxiety and worry, baseline symptoms of depression, baseline chronic pain acceptance, as well as pain unpleasantness trajectories and pain intensity trajectories. Greater functional disability prior to surgery predicted a higher likelihood of having moderate-to-severe functional disability 12 months after surgery (OR: 1.051, 95% CI: 1.013, 1.091, p = 0.008), while holding all other variables constant. In other words, while controlling for all other variables, a one-point increase on baseline functional disability multiplies the odds of having moderate-to-severe functional disability by 1.051. Pain unpleasantness trajectory was also a significant predictor of moderate-to-severe functional disability (OR: 2.585, 95% CI: 1.049, 6.365, p = 0.039). Compared to children in trajectory one, children with moderate-to-severe pain unpleasantness (Trajectory 2) were more than twice as likely to have moderate-to-severe disability at 12 months, while controlling for all other variables.
 |
Table 11 Univariate Logistic Regression Analysis Showing Baseline (T0) And Surgical (T1) Predictors Of 12-Month Moderate-To-Severe Functional Disability |
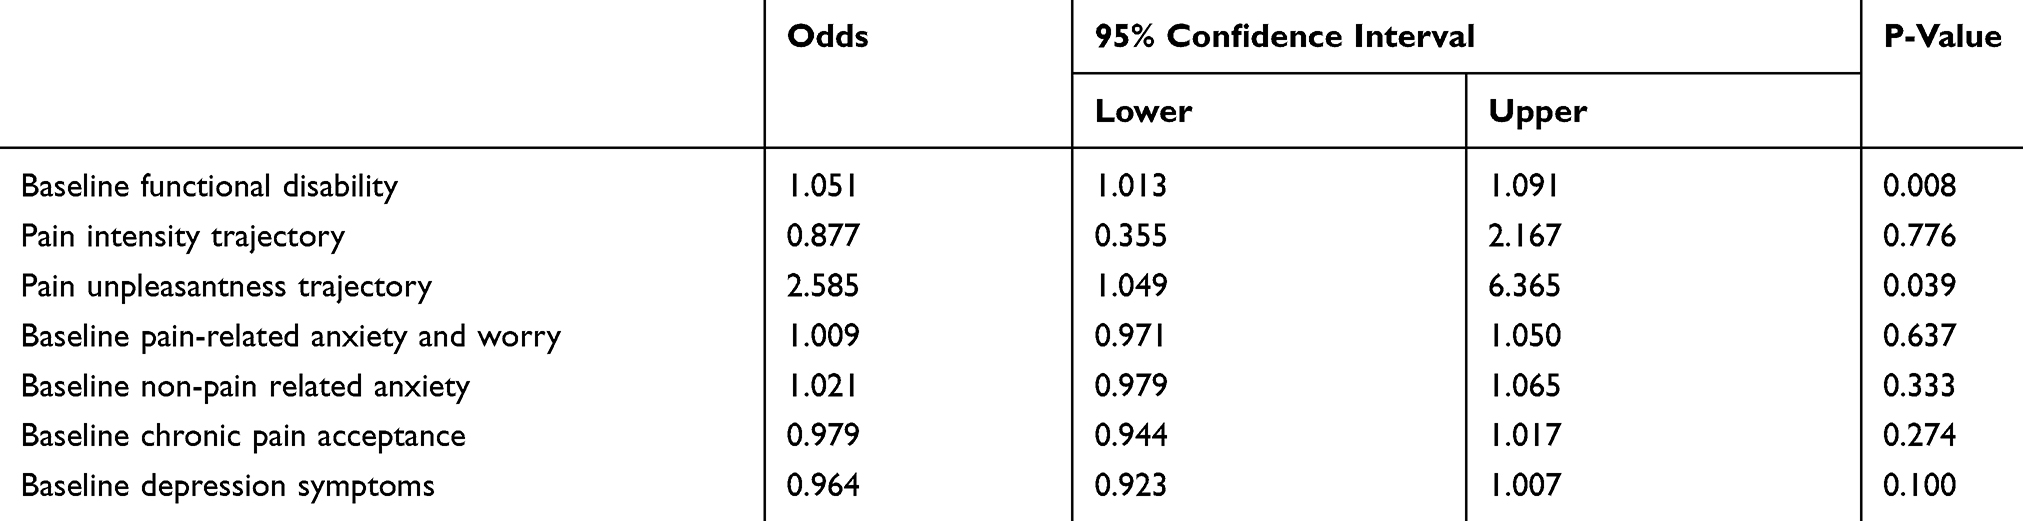 |
Table 12 Logistic Regression Analysis Showing Predictors Of 12-Month Moderate-To-Severe Functional Disability |
Discussion
The results of the present longitudinal study show that 35% and 38% of the children report moderate-to-severe chronic postsurgical pain 6 and 12 months after surgery, respectively. These results are generally consistent with the incidence reported by recent studies. For example, Chidambaran et al14 found that 37.8% (48/127) had chronic pain 2−3 months after spinal fusion surgery and 41.7% (46/110) had persistent pain one year after surgery.14 In another study by Chidambaran et al,54 36% (44/121) of patients had chronic pain 2–3 months after surgery.54 Sieberg et al,16 however, reported a much lower incidence of 16% (27/169) for moderate-to-severe chronic pain one year after spinal fusion surgery,16 which is in line with a recent review of earlier studies of pediatric post-operative pain.1 The differences in incidence rates across studies may be due, in part, to the number of months after surgery when pain is assessed, “caseness” (non-zero vs moderate-to-severe), the pain scales used, and the presence or absence of preoperative pain. Greater incidences are typically found earlier after surgery14,55 and when reporting the incidence of non-zero pain.2,15,55,56 The type of pain scale used may also influence the incidence of CPSP. Sieberg et al16 used (non-numeric) pain items from the Scoliosis Research Society-30 which asks participants directly whether their pain is “mild”, “moderate”, moderate to severe’ or “severe”, whereas in the present study, and in past work by our group,2 we used numeric rating scales and subsequently determined pain severity based on a cut-off score on the NRS of 4.
Regarding the issue of preoperative pain prevalence, we found the incidence of 6-month and 12-month CPSP among participants who did not have preoperative pain to be 7.5% and 9.2%, respectively. In contrast, the incidence in the total sample, of whom, 43% had had moderate-to-severe preoperative pain was 35% and 37%. In our previous study,2 conducted at the same institution and using the same surgical population, the prevalence of moderate-to-severe preoperative pain was 19.3% and the incidence of moderate-to-severe CPSP was 23% and 22% at 6 and 12 months, respectively. Thus, the higher incidence of CPSP in the present study may be related to the higher prevalence of preoperative pain. The persistence of pain indicates that surgery, in the present study, did not alleviate pre-operative pain – a possibility that might be discussed with families prior to surgery.
Recently, several studies have used trajectory analyses to characterize pain outcomes in children who have undergone major surgery,3,14–16 but thus far they have been limited by small sample sizes consequently bringing into question the various numbers and characteristics of the reported trajectories. The present study recruited a sample more than twice the size of previous studies. A two-trajectory model provided the best fit for the data for both pain intensity and pain unpleasantness. In the case of pain intensity, the data showed a group of children with mild pain pre- and post-surgically and a group with moderate-to-severe pain pre- and post-surgically. Both Connelly et al3 and Rabbitts et al15 report a two-trajectory model, but unlike their trajectories showing recovery of pain over time, the moderate-to-severe pain trajectory in the present study remained high across the one-year follow-up period. Unique to the present study, we also evaluated pain unpleasantness trajectories. Pain unpleasantness trajectory analysis showed a group with lower pain unpleasantness ratings that remained low up to 12 months and a group with a higher degree of pain unpleasantness that was sustained throughout the year. The pain unpleasantness and pain intensity trajectory groups contained some of the same children.
The results of the present study also show that 33% and 30% of the children report moderate-to-severe functional disability 6 months and 12 months after surgery and that their disability was correlated with pain intensity at each time point. Notably, however, only 18% and 14% had both moderate-to-severe pain and moderate-to-severe functional disability at the two time points, respectively, indicating that not all children with moderate-to-severe pain are functionally disabled. Moreover, greater functional disability before surgery in combination with year-long pain unpleasantness trajectories predicted a significantly greater likelihood of developing moderate-to-severe functional disability at 12 months after controlling for a variety of relevant psychological factors. A corollary to this is that children with better pre-operative functioning and lower levels of pain unpleasantness have better post-operative functioning. Four other studies have reported functional outcomes in children after surgery.2,14–16 Chidambaran et al14 reported that children with chronic pain (ie, pain present over 2–3 months) and persistent pain (ie, pain present over 10–12 months) had more severe functional disability than children without pain problems at 4–6 weeks post-surgery, but chronic pain at 6 and 12 months was not associated with greater functional disability in the long term.14 Rabbitts et al15 reported that children with late recovery from pain after spinal fusion reported greater activity limitations one year after surgery, but they failed to control for baseline levels of activity limitations. Another study evaluated missed days of school/work prior to surgery and found that the high post-surgical pain group had significantly more missed days than the other pain groups in the study (ie, pain improvement group, no-pain group) but importantly the authors did not report whether pain trajectory group membership predicted number of missed days at the long-term follow-ups.16 The present results point to the importance of assessing and controlling for preoperative functional disability when examining predictors of CPSP-related functional disability.
A theoretical consideration present in the child CPSP literature involves the role of parent cognitive-affective appraisals and behavioral patterns in relation to their child’s pain and recovery after surgery.14,15,57–59 For example, Pagé et al2 found that parental pain catastrophizing in the days after surgery predicted child pain intensity outcomes one year after surgery. In contrast, the present study did not find that parental factors, including psychological flexibility, pain catastrophizing, anxiety sensitivity, depression, general anxiety, and pain self-efficacy, were related to child pain intensity or unpleasantness trajectories, or functional disability. The lack of a relationship between parent and child pain factors is consistent with Birnie et al60 who found that child, but not parent pain catastrophizing, played a role in predicting pain outcomes after spinal fusion surgery. Rabbitts et al15 found that parental catastrophizing about their child’s pain was associated with late pain recovery. Taken together, the results for parent pain catastrophizing in the context of child CPSP suggest that a parent’s own level of pain catastrophizing is not directly associated with child outcomes, but that parent worry about their child’s pain is. To further evaluate the interpersonal factors theorized to influence child pain outcomes,59,61 future studies might consider using measures that specifically evaluate parent cognitive and affective reactions to their child being in pain. Future studies should also be designed to have the statistical power necessary to evaluate factors from biomedical, psychosocial, and behavioral aspects of an integrated biopsychosocial model.
There are limitations to the present study. First, as with all other studies in this area we did not conduct physical examinations of the children pre- and post-operatively so we cannot be certain of the percentage of participants whose CPSP was a continuation of the pain that was experienced pre-operatively versus those whose pain was a direct result of the surgery.7,62 This is especially relevant since 43% of the present sample reported moderate-to-severe pain before surgery. A conservative estimate of the incidence of one-year CPSP is 9.2% based only on patients who did not have preoperative pain, thus, the true incidence of one-year moderate-to-severe CPSP likely lies between 9.2% and 38%. A second limitation is that we did not assess children between hospital discharge and the six-month follow-up. Doing so may have allowed for a more fine-grained trajectory analysis with greater precision to detect additional patterns of pain intensity and pain unpleasantness over time. It would be beneficial for future studies to conduct an assessment 4–6 weeks post-operatively so that the course of pain trajectories can be more precisely monitored during the transition from acute to chronic pain.63 A third limitation is that we used a general measure of functional disability (FDI), not a pain-specific measure, and therefore we cannot conclude that the disability reported by children after surgery was due to CPSP. However, we can conclude that moderate-to-severe functional disability and CPSP intensity occur in similar proportions of participants. Additionally, we found that baseline PROMIS Pediatric Pain Interference Scale (PPIS) was lower for those who completed the study than those who did not complete the study, indicating that our sample may be underestimating the level of pain-related disability experienced by youth undergoing major surgery. Future studies should examine both general functional disability and pain-related disability, with measures such as the PPIS.35
In conclusion, 38% of the children undergoing major surgeries go on to develop moderate-to-severe CPSP one year after major surgery and have 30% have moderate-to-severe functional disability as well. We found that pre-surgical functional disability and year-long pain unpleasantness ratings predict moderate-to-severe disability 12 months after surgery. These findings raise the possibility that “prehabilitation” interventions64 administered sufficiently in advance of surgery and addressing functional disability and pain-related psychological factors may minimize functional disability in the long term. Addressing factors that contribute to pain unpleasantness after surgery may also help to reduce long-term functional disability. A Transitional Pain Service65–67 model adapted to children undergoing surgery may be helpful in this regard.
Acknowledgments
The authors thank Shima Razavi, Kerime Arisan, Arly Sutton, Kelly Chin, and Meghan Rossi for their assistance with this study. The research reported herein was supported by operating grant FRN-102700 from the Canadian Institutes of Health Research (CIHR) Institute of Neurosciences, Mental Health and Addiction.
Disclosure
Joel Katz is supported by the CIHR Canada Research Chair in Health Psychology at York University. Brittany Rosenbloom is supported by a CIHR Canada Graduate Scholarship (CGS) Doctoral Award in Honor of Nelson Mandala. M Gabrielle Pagé was supported by a CIHR Frederick Banting and Charles Best CGS Doctoral Award. The authors report no other conflicts of interest in this work.
References
1. Rabbitts JA, Fisher E, Rosenbloom BN, Palermo TM. Prevalence and predictors of chronic postsurgical pain in children: a systematic review and meta-analysis. J Pain. 2017;18(6):605–614. doi:10.1016/j.jpain.2017.03.007
2. Pagé MG, Stinson J, Campbell F, Isaac L, Katz J. Identification of pain-related psychological risk factors for the development and maintenance of chronic pediatric post-surgical pain. J Pain Res. 2013;6:167–180. doi:10.2147/JPR.S40846
3. Connelly M, Fulmer RD, Prohaska J, et al. Predictors of postoperative pain trajectories in adolescent idiopathic scoliosis. Spine. 2014;39(3):E174–E181. doi:10.1097/BRS.0000000000000099
4. Anand KJ, Hickey PR. Pain and its effects in the human neonate and fetus. N Engl J Med. 1987;317(21):1321–1329. doi:10.1056/NEJM198711193172105
5. Sleed M, Eccleston C, Beecham J, Knapp M, Jordan A. The economic impact of chronic pain in adolescence: methodological considerations and a preliminary costs-of-illness study. Pain. 2005;119(1–3):183–190. doi:10.1016/j.pain.2005.09.028
6. Werner MU, Kongsgaard UEI. Defining persistent post-surgical pain: is an update required? Br J Anaesth. 2014;113(1):1–4. doi:10.1093/bja/aeu012
7. Katz J, Seltzer Z. Transition from acute to chronic postsurgical pain: risk factors and protective factors. Expert Rev Neurother. 2009;9(5):723–744. doi:10.1586/ern.09.20
8. Pagé MG, Huguet A, Katz J. Prevention of the development and maintenance of paediatric chronic pain and disability. In: McGrath PJ, Stevens BJ, Walker SM, Zempsky WT, editors. Oxford Textbook of Paediatric Pain. Oxford (UK): Oxford University Press; 2013:39–49.
9. Williams G, Howard RF, Liossi C. Persistent postsurgical pain in children and young people: prediction, prevention, and management. Pain Rep. 2017;2(5):e616. doi:10.1097/PR9.0000000000000616
10. Pillai Riddell R, Racine NM, Craig KD, Campbell L. Psychological theories and biopsychosocial models in paediatric pain. In: McGrath PJ, Stevens BJ, Walker SM, Zempsky WT, editors. Oxford Textbook of Paediatric Pain. Oxford (UK): Oxford University Press; 2013:85–94.
11. Simons LE, Sieberg CB, Lewis Claar R. Anxiety and functional disability in a large sample of children and adolescents with chronic pain. Pain Res Manage. 2012;17(2):93–97. doi:10.1155/2012/420676
12. Celedon X, Amari A, Ward CM, Prestwich S, Slifer JK. Children and adolescents with chronic pain and functional disability: use of a behavioral rehabilitation approach. Curr Phys Med Rehabil Rep. 2014;2(2):86–92. doi:10.1007/s40141-014-0047-0
13. Lynch-Jordan AM, Sil S, Peugh J, Cunningham N, Kashikar-Zuck S, Goldschneider KR. Differential changes in functional disability and pain intensity over the course of psychological treatment for children with chronic pain. Pain. 2014;155(10):1955–1961. doi:10.1016/j.pain.2014.06.008
14. Chidambaran V, Ding L, Moore DL, et al. Predicting the pain continuum after adolescent idiopathic scoliosis surgery: a prospective cohort study. Eur J Pain. 2017;21(7):1252–1265. doi:10.1002/ejp.1025
15. Rabbitts JA, Zhou C, Groenewald CB, Durkin L, Palermo TM. Trajectories of postsurgical pain in children: risk factors and impact of late pain recovery on long-term health outcomes after major surgery. Pain. 2015;156(11):2383–2389. doi:10.1097/j.pain.0000000000000281
16. Sieberg CB, Simons LE, Edelstein MR, et al. Pain prevalence and trajectories following pediatric spinal fusion surgery. J Pain. 2013;14(12):1694–1702. doi:10.1016/j.jpain.2013.09.005
17. Kashikar-Zuck S, Flowers SR, Claar RL, et al. Clinical utility and validity of the Functional Disability Inventory among a multicenter sample of youth with chronic pain. Pain. 2011;152(7):1600–1607. doi:10.1016/j.pain.2011.02.050
18. Nikolajsen L, Kristensen AD, Pedersen LK, Rahbek O, Jensen TS, Moller-Madsen B. Intra- and interrater agreement of pressure pain thresholds in children with orthopedic disorders. J Child Orthop. 2011;5(3):173–178. doi:10.1007/s11832-011-0336-4
19. Puyau MR, Adolph AL, Vohra FA, Zakeri I, Butte NF. Prediction of activity energy expenditure using accelerometers in children. Med Sci Sports Exerc. 2004;36(9):1625–1631.
20. Von Baeyer CL, Spagrud LJ, McCormick JC, Choo E, Neville K, Connelly MA. Three new datasets supporting use of the Numerical Rating Scale (NRS-11) for children’s self-reports of pain intensity. PAIN. 2009;143(3):223–227. doi:10.1016/j.pain.2009.03.002
21. Page MG, Fuss S, Martin AL, Escobar EM, Katz J. Development and preliminary validation of the Child Pain Anxiety Symptoms Scale in a community sample. J Pediatr Psychol. 2010;35(10):1071–1082. doi:10.1093/jpepsy/jsq034
22. McCracken LM, Dhingra L. A short version of the Pain Anxiety Symptoms Scale (PASS-20): preliminary development and validity. Pain Res Manag. 2002;7(1):45–50. doi:10.1155/2002/517163
23. Fuss S, Page G, Katz J. Persistent pain in a community-based sample of children and adolescents. Pain Res Manage. 2011;16(5):303–309. doi:10.1155/2011/534652
24. Pagé MG, Campbell F, Isaac L, Stinson J, Martin-Pichora AL, Katz J. Reliability and validity of the Child Pain Anxiety Symptoms Scale (CPASS) in a clinical sample of children and adolescents with acute postsurgical pain. Pain. 2011;152(9):1958–1965. doi:10.1016/j.pain.2011.02.053
25. Crombez G, Bijttebier P, Eccleston C, et al. The child version of the pain catastrophizing scale (PCS-C): a preliminary validation. Pain. 2003;104(3):639–646. doi:10.1016/s0304-3959(03)00121-0
26. Sullivan MJ, Bishop SR, Pivik J. The pain catastrophizing scale: development and validation. Psychol Assess. 1995;7(4):524. doi:10.1037/1040-3590.7.4.524
27. Sullivan MJ, Thorn B, Haythornthwaite JA, et al. Theoretical perspectives on the relation between catastrophizing and pain. Clin J Pain. 2001;17(1):52–64.
28. Silverman WK, Fleisig W, Rabian B, Peterson RA. Childhood anxiety sensitivity index. J Clin Child Adolesc Psychol. 1991;20(2):162–168. doi:10.1207/s15374424jccp2002_7
29. De Cássia Martinelli S, Bartholomeu D, Gakyia Caliatto S, de Grecci Sassi A. Children’s self-efficacy scale: initial psychometric studies. J Psychoeduc Assess. 2009;27(2):145–156. doi:10.1177/0734282908325551
30. Kori SH, Miller RP, Todd DD. Kinesiophobia: a new view of chronic pain behavior. Pain Manag. 1990;3(1):35–43.
31. Vlaeyen JW, Kole-Snijders AM, Boeren RG, Van Eek H. Fear of movement/(re) injury in chronic low back pain and its relation to behavioral performance. PAIN. 1995;62(3):363–372. doi:10.1016/0304-3959(94)00279-n
32. Horowitz M, Wilner N, Alvarez W. Impact of event scale: a measure of subjective stress. Psychosom Med. 1979;41(3):209–218. doi:10.1097/00006842-197905000-00004
33. Smith P, Perrin S, Dyregrov A, Yule W. Principal components analysis of the impact of event scale with children in war. Pers Individ Dif. 2003;34(2):315–322. doi:10.1016/S0191-8869(02)00047-8
34. Perrin S, Meiser-Stedman R, Smith P. The children’s revised impact of events scale (CRIES): validity as a screening instrument for PTSD. Behav Cogn Psychother. 2005;33:487–498. doi:10.1017/S1352465805002419
35. Varni JW, Stucky BD, Thissen D, et al. PROMIS Pediatric Pain Interference Scale: an item response theory analysis of the pediatric pain item bank. J Pain. 2010;11(11):1109–1119. doi:10.1016/j.jpain.2010.02.005
36. DeWitt EM, Stucky BD, Thissen D, et al. Construction of the eight-item patient-reported outcomes measurement information system pediatric physical function scales: built using item response theory. J Clin Epidemiol. 2011;64(7):794–804. doi:10.1016/j.jclinepi.2010.10.012
37. Radloff LS. The CES-D scale: a self-report depression scale for research in the general population. Appl Psychol Meas. 1977;1(3):385–401. doi:10.1177/014662167700100306
38. Faulstich ME, Carey MP, Ruggiero L, Enyart P, Gresham F. Assessment of depression in childhood and adolescence: an evaluation of the center for epidemiological studies depression scale for children (CES-DC). Am J Psychiatry. 1986;143(8):1024–1027. doi:10.1176/ajp.143.8.1024
39. March JS, Sullivan K. Test-retest reliability of the multidimensional anxiety scale for children. J Anxiety Disord. 1999;13(4):349–358.
40. March JS, Parker JD, Sullivan K, Stallings P, Conners CK. The Multidimensional Anxiety Scale for Children (MASC): factor structure, reliability, and validity. J Am Acad Child Adolesc Psychiatry. 1997;36(4):554–565. doi:10.1097/00004583-199704000-00019
41. Walker LS, Greene JW. The functional disability inventory: measuring a neglected dimension of child health status. J Pediatr Psychol. 1991;16(1):39–58. doi:10.1093/jpepsy/16.1.39
42. McCracken LM, Gauntlett-Gilbert J, Eccleston C. Acceptance of pain in adolescents with chronic pain: validation of an adapted assessment instrument and preliminary correlation analyses. Eur J Pain. 2010;14(3):316–320. doi:10.1016/j.ejpain.2009.05.002
43. Osman A, Barrios FX, Gutierrez PM, Kopper BA, Merrifield T, Grittmann L. The Pain Catastrophizing Scale: further psychometric evaluation with adult samples. J Behav Med. 2000;23(4):351–365.
44. Goubert L, Eccleston C, Vervoort T, Jordan A, Crombez G. Parental catastrophizing about their child’s pain. the parent version of the pain catastrophizing scale (PCS-P): a preliminary validation. Pain. 2006;123(3):254–263. doi:10.1016/j.pain.2006.02.035
45. Reiss S, Peterson RA, Gursky M, McNally RJ. Anxiety, sensitivity, anxiety frequency, and the prediction of fearfulness. Behav Res Ther. 1986;24:1–8. doi:10.1016/0005-7967(86)90143-9
46. Vujanovic AA, Arrindell WA, Bernstein BH, Norton PJ, Zvolensky MJ. Sixteen-item anxiety sensitivity index: confirmatory factor analytic evidence, internal consistency, and construct validity in a young adult sample from the Netherlands. Assessment. 2007;14:129–143. doi:10.1177/1073191106295053
47. Spielberger CD, Gorsuch RL, Lushene R, Vagg PR, Jacobs GA. State-Trait Anxiety Inventory (form Y). Palo Alto (CA): Mind Garden; 1983.
48. Spielberger CD. State-Trait Anxiety Inventory: Bibliography. Palo Alto (CA): Consulting Psychologists Press; 1989.
49. Nicholas MK Self-efficacy and chronic pain.
50. Nicholas MK. The pain self-efficacy questionnaire: taking pain into account. Eur J Pain. 2007;11(2):153–163. doi:10.1016/j.ejpain.2005.12.008
51. McCracken LM, Gauntlett-Gilbert J. Role of psychological flexibility in parents of adolescents with chronic pain: development of a measure and preliminary correlation analyses. Pain. 2011;152(4):780–785. doi:10.1016/j.pain.2010.12.001
52. Pagé MG, Katz J, Curtis K, Lutzky-Cohen N, Escobar EM, Clarke HA. Acute pain trajectories and the persistence of post-surgical pain: a longitudinal study after total hip arthroplasty. J Anesth. 2016;30(4):568–577. doi:10.1007/s00540-016-2183-4
53. Pagé MG, Katz J, Romero Escobar EM, et al. Distinguishing problematic from nonproblematic postsurgical pain: a pain trajectory analysis after total knee arthroplasty. Pain. 2015;156(3):460–468. doi:10.1097/01.j.pain.0000460327.10515.2d
54. Chidambaran V, Zhang X, Martin LJ, et al. DNA methylation at the mu-1 opioid receptor gene (OPRM1) promoter predicts preoperative, acute, and chronic postsurgical pain after spine fusion. Pharmgenomics Pers Med. 2017;10:157–168. doi:10.2147/PGPM.S132691
55. Batoz H, Semjen F, Bordes-Demolis M, Benard A, Nouette-Gaulain K. Chronic postsurgical pain in children: prevalence and risk factors. A prospective observational study. Br J Anaesth. 2016;117(4):489–496. doi:10.1093/bja/aew260
56. Landman Z, Oswald T, Sanders J, Diab M, Spinal Deformity Study G. Prevalence and predictors of pain in surgical treatment of adolescent idiopathic scoliosis. Spine (Phila Pa 1976). 2011;36(10):825–829. doi:10.1097/BRS.0b013e3181de8c2b
57. Pagé MG, Stinson J, Campbell F, Isaac L, Katz J. Pain-related psychological correlates of pediatric acute post-surgical pain. J Pain Res. 2012;5:547–558. doi:10.2147/JPR.S36614
58. Noel M, Rabbitts JA, Tai GG, Palermo TM. Remembering pain after surgery: a longitudinal examination of the role of pain catastrophizing in children’s and parents’ recall. Pain. 2015;156(5):800–808. doi:10.1097/j.pain.0000000000000102
59. Simons LE, Smith A, Kaczynski K, Basch M. Living in fear of your child’s pain: the Parent Fear of Pain Questionnaire. Pain. 2015;156(4):694–702. doi:10.1097/j.pain.0000000000000100
60. Birnie KA, Chorney J, El-Hawary R, Group PS. Child and parent pain catastrophizing and pain from presurgery to 6 weeks postsurgery: examination of cross-sectional and longitudinal actor-partner effects. Pain. 2017;158(10):1886–1892. doi:10.1097/j.pain.0000000000000976
61. Asmundson GJ, Noel M, Petter M, Parkerson HA. Pediatric fear-avoidance model of chronic pain: foundation, application and future directions. Pain Res Manag. 2012;17(6):397–405. doi:10.1155/2012/908061
62. Wylde V, Palmer S, Learmonth ID, Dieppe P. The association between pre-operative pain sensitisation and chronic pain after knee replacement: an exploratory study. Osteoarthritis Cartilage. 2013;21(9):1253–1256. doi:10.1016/j.joca.2013.05.008
63. Katz J. One man’s risk factor is another man’s outcome: difference in risk factor profiles for chronic postsurgical pain maintenance vs transition. Pain. 2012;153(3):505–506. doi:10.1016/j.pain.2011.10.044
64. Santa Mina D, Clarke H, Ritvo P, et al. Effect of total-body prehabilitation on postoperative outcomes: a systematic review and meta-analysis. Physiotherapy. 2014;100(3):196–207. doi:10.1016/j.physio.2013.08.008
65. Katz J, Weinrib A, Fashler SR, et al. The Toronto General Hospital Transitional Pain Service: development and implementation of a multidisciplinary program to prevent chronic postsurgical pain. J Pain Res. 2015;8:695–702. doi:10.2147/JPR.S91924
66. Azam MA, Weinrib A, Montbriand J, et al. Acceptance and commitment therapy to manage pain and opioid use after major surgery: preliminary outcomes from the Toronto General Hospital Transitional Pain Service. Can J Pain. 2017;1(1).
67. Weinrib AZ, Azam MA, Birnie KA, Burns LC, Clarke H, Katz J. The psychology of chronic post-surgical pain: new frontiers in risk factor identification, prevention and management. Br J Pain. 2017;11:169–177.
 © 2019 The Author(s). This work is published and licensed by Dove Medical Press Limited. The
full terms of this license are available at https://www.dovepress.com/terms
and incorporate the Creative Commons Attribution
- Non Commercial (unported, 3.0) License.
By accessing the work you hereby accept the Terms. Non-commercial uses of the work are permitted
without any further permission from Dove Medical Press Limited, provided the work is properly
attributed. For permission for commercial use of this work, please see paragraphs 4.2 and 5 of our Terms.
© 2019 The Author(s). This work is published and licensed by Dove Medical Press Limited. The
full terms of this license are available at https://www.dovepress.com/terms
and incorporate the Creative Commons Attribution
- Non Commercial (unported, 3.0) License.
By accessing the work you hereby accept the Terms. Non-commercial uses of the work are permitted
without any further permission from Dove Medical Press Limited, provided the work is properly
attributed. For permission for commercial use of this work, please see paragraphs 4.2 and 5 of our Terms.