
Back to Journals » International Journal of Women's Health » Volume 18
Patient Selection Metrics and Efficacy of Neoadjuvant Chemotherapy in Advanced Epithelial Ovarian Cancer: A Retrospective Analysis
Authors Mohamed Hassan Abdul Razak FA  , Zong H , Gao J, Gao R, Zhao S, Peng J , Zhang H
Received 29 March 2026
Accepted for publication 19 June 2026
Published 26 June 2026 Volume 2026:18 612947
DOI https://doi.org/10.2147/IJWH.S612947
Checked for plagiarism Yes
Review by Single anonymous peer review
Peer reviewer comments 2
Editor who approved publication: Dr Vinay Kumar
Fathima Anooshiya Mohamed Hassan Abdul Razak,1,* Hui Zong,1,* Jie Gao,1 Renzhuo Gao,1 Shuyan Zhao,2 Jin Peng,1 Hui Zhang1
1Department of Obstetrics and Gynecology, Qilu Hospital of Shandong University, Ji’nan, Shandong, People’s Republic of China; 2Department of Obstetrics and Gynecology, Yiyuan County People’s Hospital, Zibo, Shandong, People’s Republic of China
*These authors contributed equally to this work
Correspondence: Jin Peng, Department of Obstetrics and Gynecology, Qilu Hospital, Shandong University, 107 West Wenhua Road, Ji’nan, Shandong, 250012, People’s Republic of China, Email [email protected] Hui Zhang, Department of Obstetrics and Gynecology, Qilu Hospital, Shandong University, 107 West Wenhua Road, Ji’nan, Shandong, 250012, People’s Republic of China, Email [email protected]
Background: To evaluate risk factors of overall survival (OS) in patients with advanced epithelial ovarian cancer (AEOC) and establish predictive models for predicting postoperative complete cytoreduction (R0 resection) in AEOC patients to guide individualized treatment (PDS or NACT-IDS).
Material and Methods: This retrospective analysis of 818 AEOC patients treated at Qilu Hospital of Shandong University between January 2014 and December 2023 compared survival outcomes (OS, PFS) and R0 rates following PDS vs. NACT-IDS using Cox regression and Kaplan-Meier methods. Based on the PDS and NACT-IDS group, two predictive models were established using logistic regression analysis to predict postoperative R0 resection.
Results: Patients undergoing NACT-IDS treatment have a heavier tumor burden and a higher R0 resection rate (56.40% vs 39.90%, P < 0.001) than those undergoing PDS treatment. Median OS was modestly longer following PDS (32 vs 29 months, P = 0.036), while PFS did not differ between strategies. Multivariate Cox regression identified age, CA153, serum total calcium, and non-R0 as independent risk factors of OS, in contrast, the treatment strategy was not statistically significant. The Suidan score demonstrated high sensitivity for predicting complete resection (94.09%) but limited specificity (18.02%). Preoperative predictive models integrating CA153 and the Suidan score showed moderate discrimination in the PDS cohort (AUC = 0.763/0.705, training set/validation set) and excellent performance in the IDS cohort (AUC = 0.911) with good calibration (Hosmer-Lemeshow P > 0.05).
Conclusion: Complete cytoreduction remains the most critical determinant of survival in AEOC. Preoperative models combining CA153 and the Suidan score provide practical tools to support individualized selection of PDS or NACT-IDS strategies.
Clinical Trial Number: ChiCTR2600116858.
Keywords: advanced epithelial ovarian cancer, primary debulking surgery, interval debulking surgery, CA153, predictive modeling, suidan score, complete cytoreduction
Introduction
Advanced Epithelial Ovarian Cancer (AEOC) remains a lethal gynecologic malignancy,1 evidenced by 207,000 annual deaths against 314,000 new cases, primarily due to prevalent late-stage diagnosis.2 This results in a dramatic survival gap, from over 90% in FIGO stage I to under 20% in FIGO stage IV.3 The traditional standard of care for AEOC is primary debulking surgery (PDS) followed by adjuvant platinum-based chemotherapy. The principal goal of surgery is to achieve complete cytoreduction (R0 resection),4 as this is the most robust independent prognostic factor for both overall survival (OS) and progression-free survival (PFS). For patients with a high disease burden, poor performance status, or low likelihood of achieving an optimal resection, neoadjuvant chemotherapy followed by interval debulking surgery (NACT-IDS)5 represents a validated, non-inferior alternative strategy.
The relative efficacy of PDS versus NACT-IDS remains a contentious issue. Initial landmark trials, EORTC 559716 and CHORUS,7 found the two strategies offered comparable survival, with a morbidity benefit for NACT-IDS. Critics, however, contend that the suboptimal resection rates in the PDS arms of these studies did not reflect contemporary surgical standards. This concern informed the design of the subsequent SUNNY trial (JCOG0602),8 which specifically enrolled patients with greater resectability potential. In contrast to its predecessors, SUNNY demonstrated superior OS and PFS for the PDS approach.
Despite this evidence, the optimal selection of patients for each pathway, PDS versus NACT-IDS to maximize the chance of R0 resection and survival, remains a significant clinical dilemma in real-world practice. This idea was further thoroughly assessed in the TRUST trial,9 which required prospective center credentialing based on surgical volume and audited R0 rates to ensure that the comparisons were made within an optimized surgical framework. After this concept, the real-world SUROVA study was evaluated globally,10 which, after propensity score matching, also found no significant difference in median OS between PDS and NACT-IDS. Critically, the SUROVA analysis elucidated that the benefit of PDS was contingent upon achieving R0 without major post-operative complications and revealed a significant differential treatment effect based on ethnicity. Consequently, a critical translational gap persists: the lack of validated, robust clinical or molecular biomarkers to reliably triage individual patients to the most effective surgical pathway to maximize the likelihood of R0 resection and long-term survival.
The preoperative prediction of resectability is essential for surgical planning. In 2018, Suidan et al introduced the Memorial Sloan Kettering Cancer Center (MSKCC) predictive model, a validated scoring system that utilizes standard preoperative CT and clinical data to assess the likelihood of achieving R0 resection. In this model, a score of ≤3 points correlate with a high probability of an optimal R0 resection, while a score of ≥4 indicates a high risk of suboptimal outcome. This tool provides an objective, imaging-based criterion to guide patient selection for PDS.11 Although subsequent external validations have confirmed its overall utility, its predictive performance can vary depending on patient population and surgical center expertise.
The predictive utility of the Suidan score for IDS is less certain. Following NACT, tumor regression can alter disease anatomy, potentially reducing the sensitivity of the original model. Furthermore, CT may fail to detect microscopic residual disease, risking an overestimation of resectability.12 Consequently, a dedicated predictive model for IDS is needed, integrating features such as chemotherapy response, novel biomarkers, or advanced imaging to improve prognostic accuracy. Recent evidence suggests that CA153 have been associated with the likelihood of achieving R0 resection in advanced ovarian cancer patients.13 Therefore, CA153 was included in this study as a potential biomarker for treatment stratification and predictive modeling.
This study aimed to evaluate the efficacy of neoadjuvant chemotherapy (NACT) and identify optimal patient selection metrics for interval debulking surgery in AEOC.
Materials and Methods
Study Objectives
This study aimed to (1) compare the clinical outcomes of PDS and NACT-IDS in patients with AEOC; (2) identify prognostic factors associated with survival outcomes; (3) assess the clinical utility of the Suidan score and serum biomarkers, particularly CA153, in predicting surgical resectability; and (4) develop predictive models for estimating the probability of achieving R0 resection and supporting individualized treatment selection.
Sample Size Estimation
Using the Events Per Variable (EPV) method to calculate the sample size, we set the EPV to 25 with 15 candidate predictor variables. Based on a reported five-year survival rate of 46.20%14 for the target cohort, the corresponding minimum total sample size was determined to be 818 cases.
Participants and Data Acquisition
This retrospective cohort study analyzed patients with AEOC admitted to Qilu Hospital of Shandong University between January 2014 and December 2023. The inclusion criteria were as follows: (1) complete case and follow-up data; (2) postoperative pathology confirming International Federation of Gynecology and Obstetrics (FIGO) stage III or IV of AEOC; (3) patients presenting for the first time, with no prior relevant treatment before admission; (4) treatment regimen comprising either PDS or NACT-IDS; and (5) surgery performed by the Department of Gynecologic Oncology team at Qilu Hospital of Shandong University, with standardized postoperative treatment and follow-up. The exclusion criteria were: (1) incomplete case or follow-up data; (2) postoperative pathology indicating non-epithelial ovarian cancer, concurrent tumors at other sites, or recurrent/metastatic disease; (3) FIGO stage I–II of AEOC; (4) patients receiving chemotherapy without subsequent debulking surgery; and (5) patients with other severe comorbidities (eg. severe hepatic, renal impairment, autoimmune diseases, thrombotic or hemorrhagic disorders) that led to treatment delays.
Based on these Inclusion and Exclusion criteria, clinical and follow-up data for 818 eligible patients were collected. Data encompassed demographic and clinical characteristics, including age, weight, history of hypertension, diabetes, Coronary Artery Disease, History of abdominal-pelvic surgery, and family history of OC. Pre-treatment laboratory and imaging data, including CA125, CA153, Albumin, Serum total calcium, and a Suidan score, were recorded. Surgical parameters (operation time, performance of bowel resection, blood loss, intraoperative transfusion, and residual disease status), pathological findings, and treatment details (including the number of NACT cycles for the NACT-IDS group) were collected. The neoadjuvant chemotherapy regimen consisted of paclitaxel combined with platinum-based drugs. Follow the recommended dosage in the instruction manual.
The Suidan scoring system was applied according to the updated 2017 criteria. Two experienced radiologists from Qilu Hospital of Shandong University independently re-evaluated all imaging studies. For the PDS group, imaging was assessed prior to surgery, whereas for the NACT-IDS group, imaging was evaluated before initiation of neoadjuvant chemotherapy. The radiologists were blinded to treatment allocation (PDS or NACT-IDS) during scoring to minimize bias. The final Suidan score was calculated as the mean of the two independent assessments to improve reliability.
The primary endpoints of this study were progression-free survival (PFS) and overall survival (OS). Follow-up data were obtained from the Gynecology Follow-up Office of Qilu Hospital of Shandong University, including details on postoperative chemotherapy, recurrence, and survival status. All patients were followed until death or the administrative follow-up deadline of December 31, 2024. For this analysis, OS was defined as the time from treatment initiation to death from any cause or the last follow-up. PFS was defined as the time from treatment initiation to confirmed disease progression or the last follow-up; cases with uncontrolled disease from the outset were assigned a PFS of 0. Residual tumor status was classified according to the following criteria: R0 resection indicated No Macroscopic Residual Tumor After Surgery; R1 resection indicated the Macroscopic residual tumor ≤1cm; and R2 resection stated the macroscopic residual tumor >1cm after surgery.
Statistical Analysis
All statistical analyses were conducted using R software (version 4.4.1), SPSS (version 29.0.1), and Excel. Data from 818 patients with AEOC were initially stratified by the achievement of an R0 resection. Quantitative data were tested for normality; normally distributed variables are presented as standard deviation [Mean (95% Confidence Interval, 95% CI)] and compared using independent samples t-tests, while non-normally distributed variables are reported as median and interquartile range [Median (P25, P75)] and compared using the Mann–Whitney U-test. Categorical variables are expressed as frequencies with percentages (%) and compared using the chi-square (χ2) or Fisher’s exact test, as appropriate. Univariate and multivariate Cox proportional hazards regression analyses were performed to identify factors associated with OS. Kaplan–Meier survival curves comparing treatment groups (PDS vs. NACT-IDS) and residual disease status (R0 vs non‑R0) were generated and assessed using the log‑rank test via the R packages “survival” and “survminer”. Within the PDS cohort (n=552), the Suidan scoring system was validated for predicting R0 resection, with sensitivity, specificity, positive predictive value (PPV), and negative predictive value (NPV) calculated at a cut-off of 3.
Subsequently, a prediction model for R0 resection was constructed using the PDS population (n=552). The dataset was randomly split into training and validation sets in a 7:3 ratio using Excel’s RAND function. After confirming the absence of multicollinearity among potential predictors, univariate and multivariate logistic regression analyses with stepwise selection were applied to the training set to identify factors associated with R0 resection. The optimal probability cut-off was determined by maximizing the Youden index. Model performance was evaluated by plotting ROC curves and calculating the AUC with 95% confidence intervals for both datasets using (version 4.4.1) R packages “pROC” and “ggplot2”. Internal validation was performed via bootstrap resampling (500 iterations) and calibration curves using the “rms” package, while clinical utility was assessed with decision curve analysis (“rmda” package). An analogous modeling process was applied to the IDS cohort; due to its limited size, the full cohort was used for model development without a separate validation set. Additional internal validation for the IDS model was performed using bootstrap resampling (500 iterations). The optimism-corrected AUC was calculated using Somers’ Dxy with the formula AUC = (Dxy + 1)/2. Model optimism was defined as Index.orig - Index.corrected. A two‑sided P < 0.05 is considered statistically significant.
The Ethics Committee on Scientific Research of Qilu Hospital of Shandong University approved this retrospective study and granted an exemption from the requirement to obtain informed consent from human participants (Approval Number: KYLL-2025-11-066). The clinical trial number is ChiCTR2600116858.
Results
R0 Is a Significant Factor in Prolonging the OS of Patients with AEOC, Whether Based on the PDS Group or the NACT-IDS Group
A total of 818 patients with AEOC are included in this study. Among them, 552 patients are in the PDS group, and 266 patients are in the NACT-IDS group. The NACT-IDS group exhibits a higher mean age (P < 0.001) and a lower mean body weight (P < 0.001) compared to the PDS group. Additionally, a greater proportion of patients with FIGO stage IV is observed in the NACT-IDS group than in the PDS group (P < 0.001). Regarding pre-treatment marker levels, the NACT-IDS group exhibits lower CA125 levels, while serum total calcium and Suidan scores are higher relative to the PDS group (Table 1).
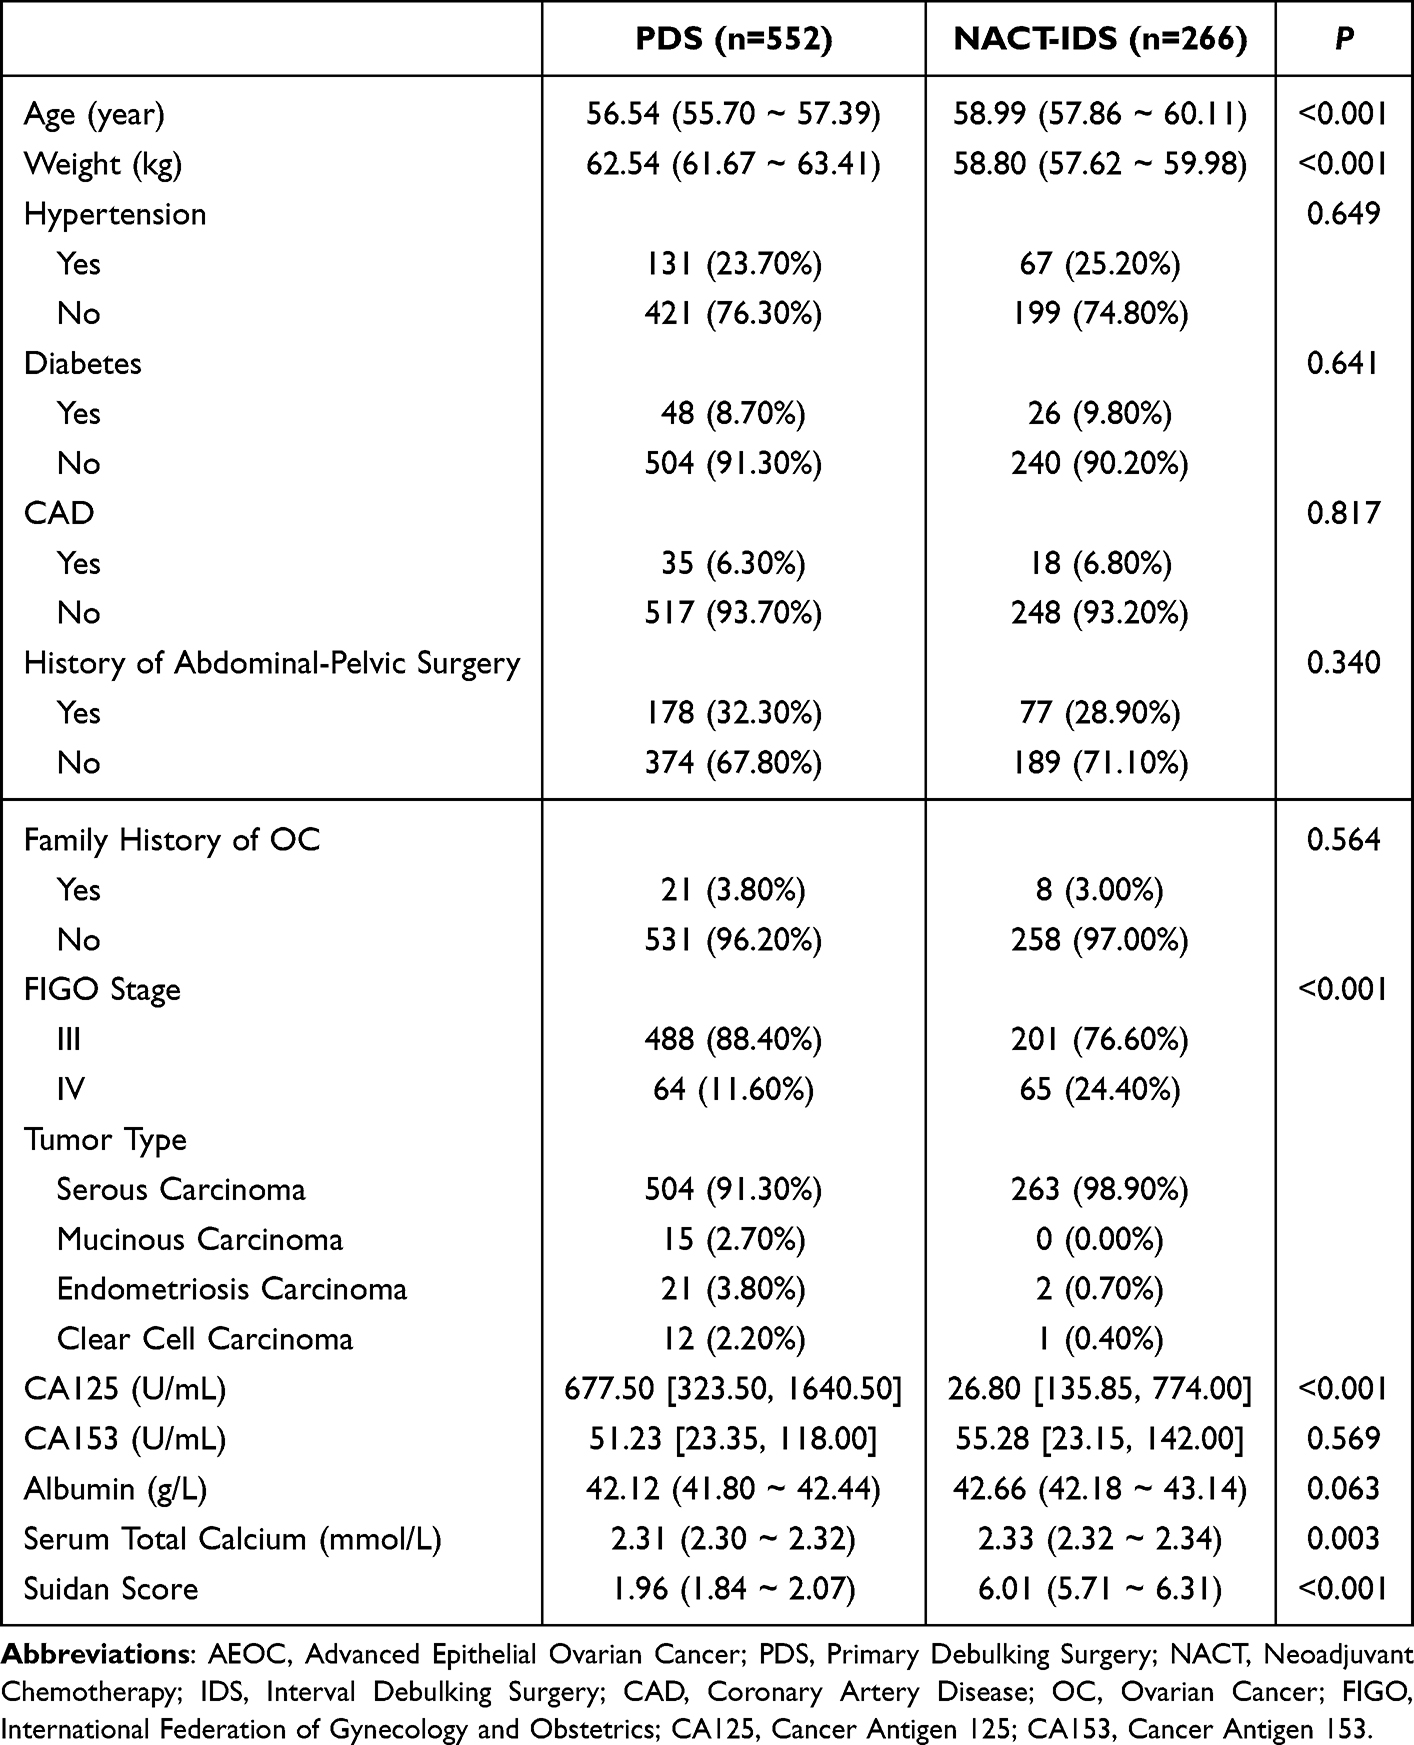 |
Table 1 Baseline Characteristics Comparison Between 818 AEOC Patients Undergoing PDS and NACT-IDS |
A comparison of perioperative factors between the two groups reveals several notable differences. The NACT-IDS group has a lower rate of intestinal resection (7.50% vs 12.30%, P = 0.038) and a higher rate of achieving R0 (56.40% vs 39.90%, P < 0.001) compared to the PDS group. Additionally, intraoperative blood loss is significantly reduced in the NACT-IDS group (P = 0.002). Interestingly, at the follow-up endpoint, the median OS (Overall Survival) is 29 months for the NACT-IDS group versus 32 months for the PDS group, with the difference in OS being statistically significant (P = 0.036). No statistically significant difference in PFS (Progression-free Survival) is observed between the two groups (Table 2). Then, we conduct Cox regression analysis and Kaplan–Meier analysis to determine which treatment prolongs OS and to identify risk factors affecting survival in AEOC patients.
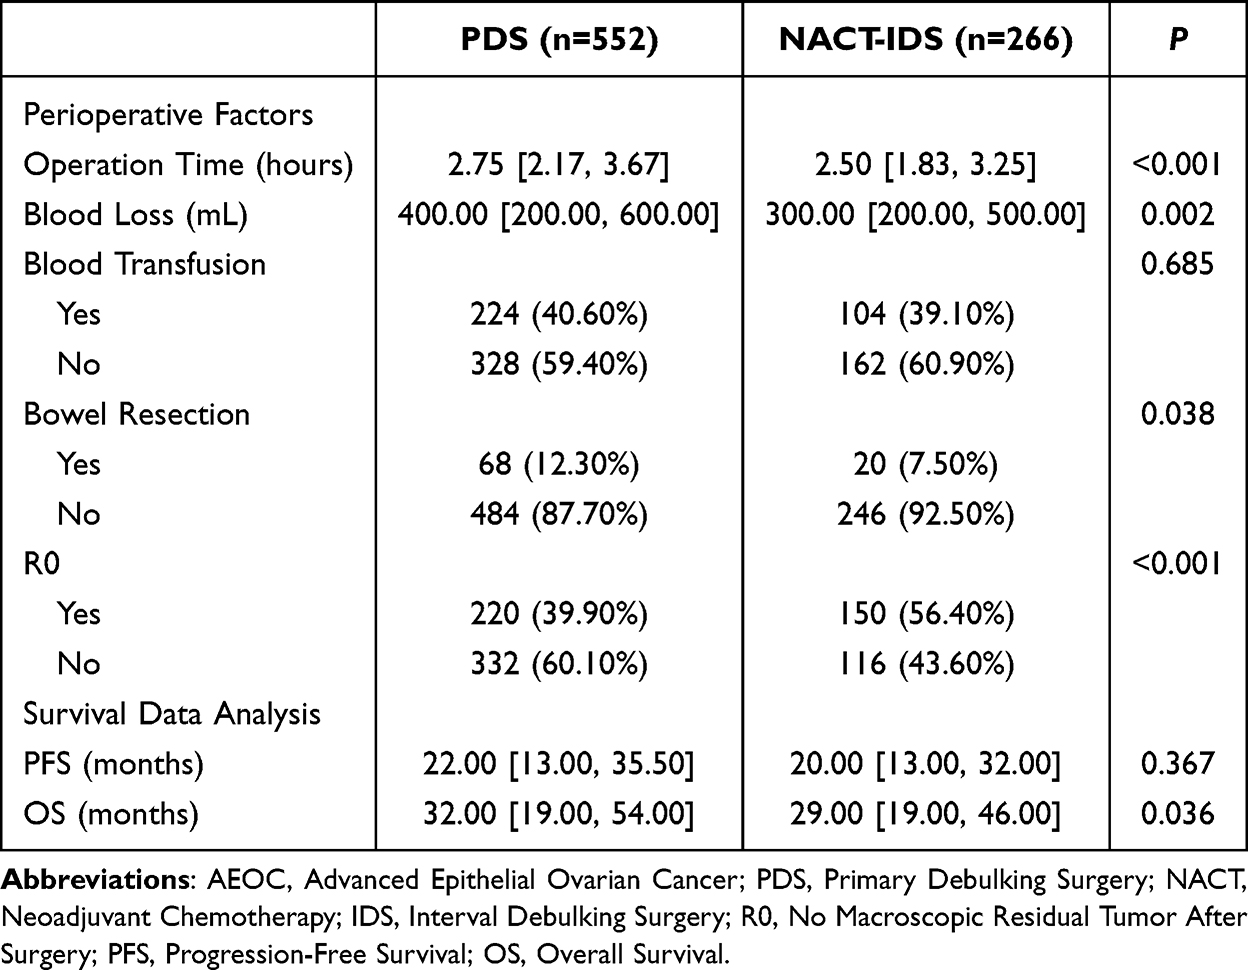 |
Table 2 Analysis of Perioperative Factors and Survival Data in AEOC Patients of PDS Vs. NACT-IDS |
Cox regression analysis in the relationship between prognostic factors and OS in 818 patients with AEOC are presented in Table 1. Among prognostic factors, age (P = 0.009), CA153 (P = 0.004), serum total calcium (P = 0.006), and Non-R0 (P < 0.001) are independent risk factors for OS. Family history of OC (95% CI: 0.10 ~ 0.93, P = 0.038) and albumin (95% CI: 0.89 ~ 0.96, P < 0.001) are identified as protective factors (Table 3). Notably, OS does not differ significantly among patients with treatment (PDS vs. NACT-IDS) (P = 0.221, Table 3), which is consistent with the results of the Kaplan–Meier analysis (P = 0.494, Figure 1A). Patients with R0 show a considerably longer OS than those with R1/R2 (P < 0.001, Figure 1B), whether based on PDS group (P < 0.001, Figure 1C) or NACT-IDS group (P = 0.005, Figure 1D).
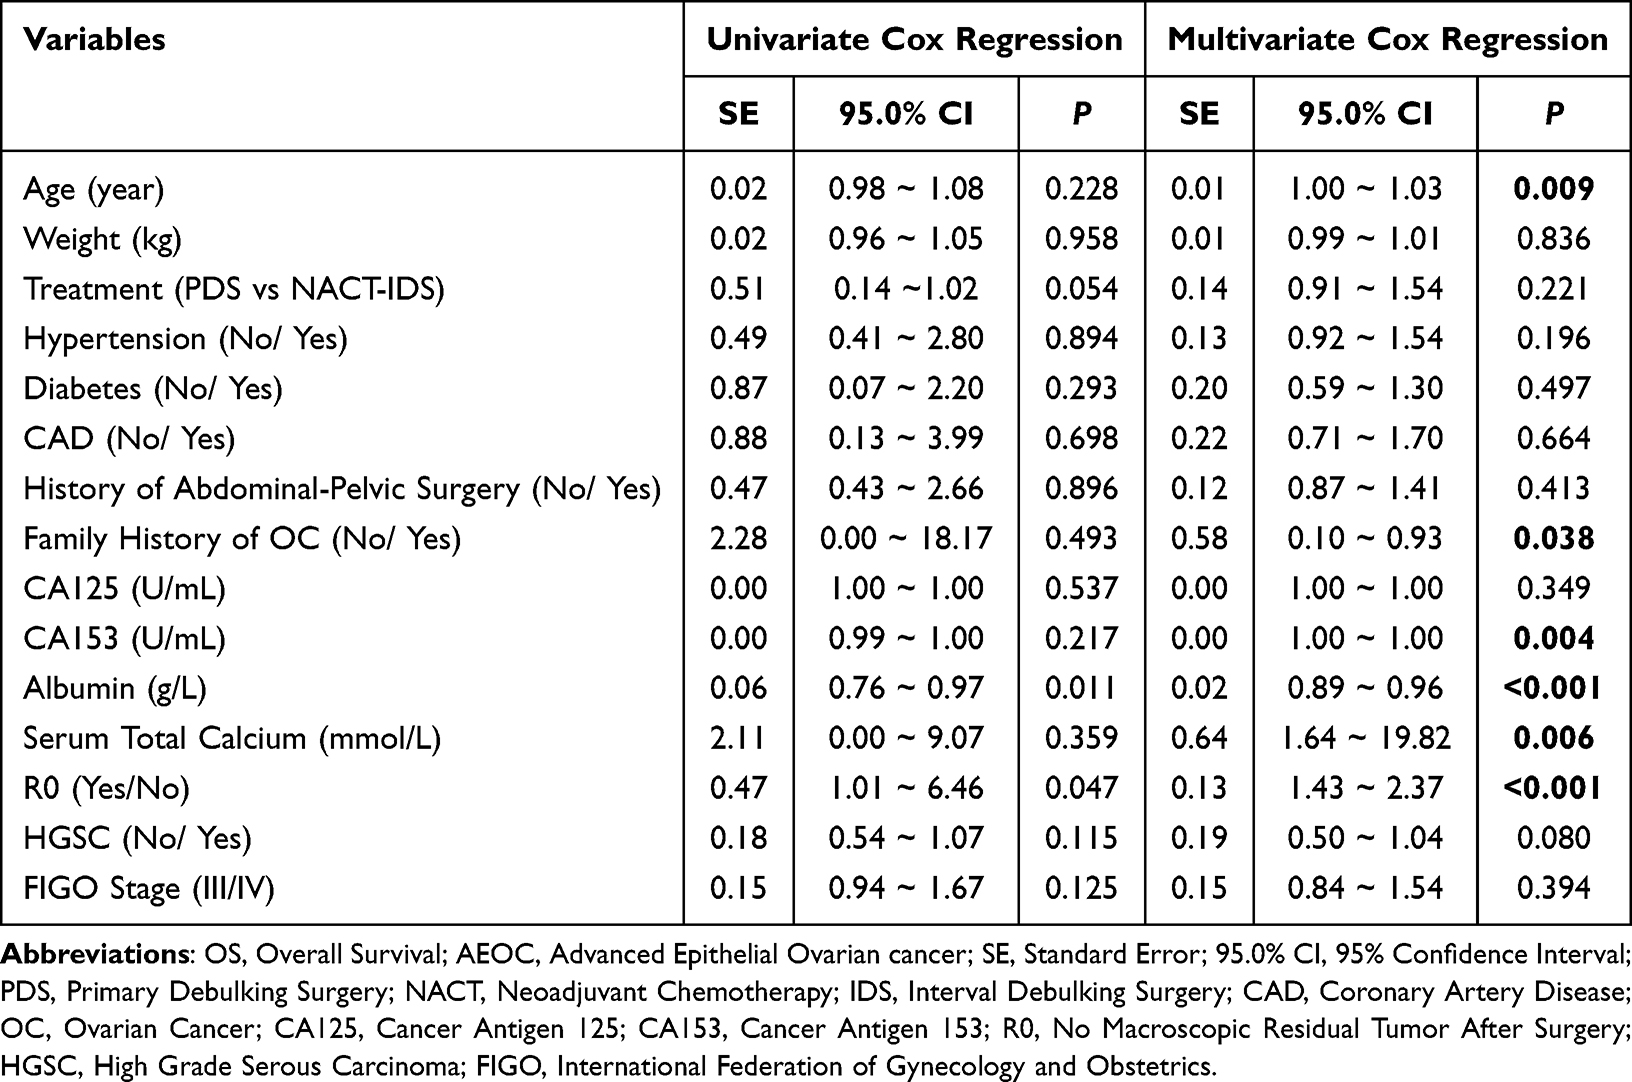 |
Table 3 Cox Regression Analysis of Prognostic Factors for OS in 818 Patients with AEOC |
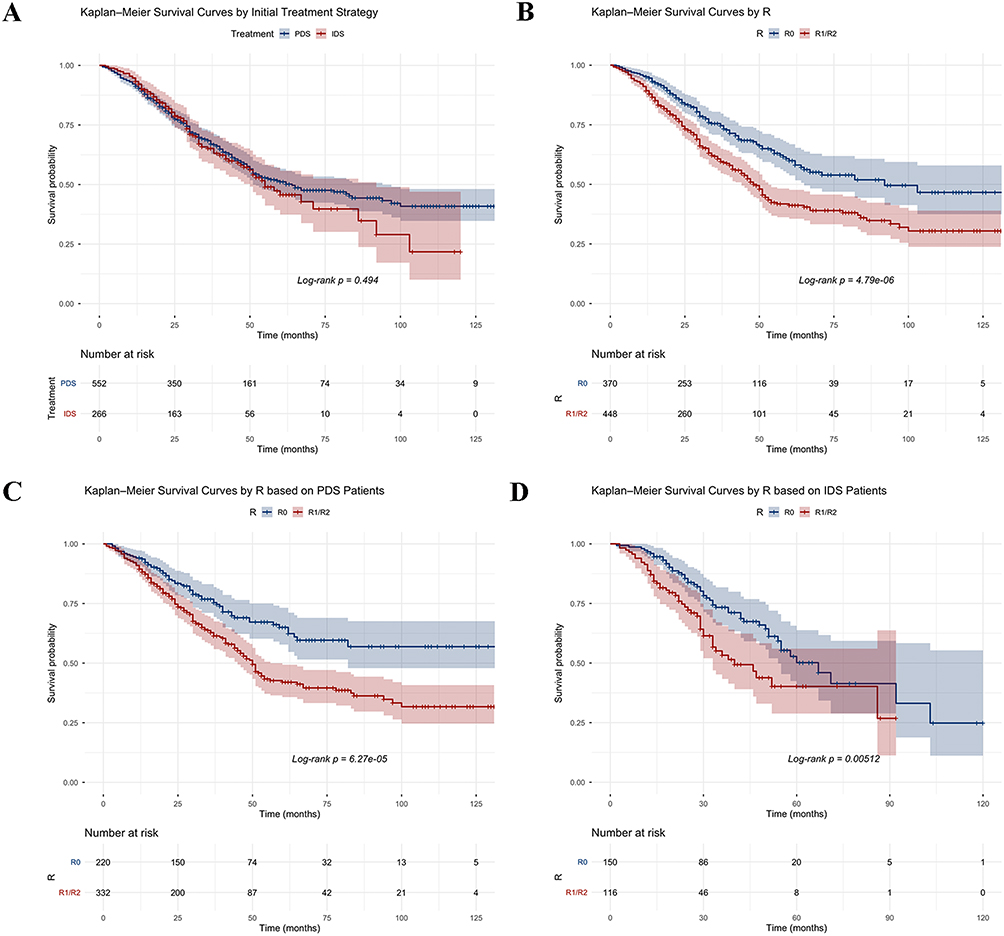 |
Figure 1 Kaplan-Meier Analysis between Treatment or R level after surgery of OS in AEOC Patients: (A) Kaplan-Meier Survival Curves by Initial Treatment Strategy in AEOC Patients; (B) Kaplan-Meier Survival Curves by R level after surgery in AEOC Patients; (C) Kaplan-Meier Survival Curves by R level after surgery based on PDS Group; (D) Kaplan-Meier Survival Curves by R level after surgery based on IDS Group. Abbreviations: AEOC, Advanced Epithelial Ovarian Cancer; PDS, Primary Debulking Surgery; IDS, Interval Debulking Surgery; R0, No Macroscopic Residual Tumor After Surgery; R1, Macroscopic Residual Tumor ≤1cm After Surgery; R2, Macroscopic Residual Tumor >1cm After Surgery. |
The data from our study indicate that neoadjuvant chemotherapy shows no significant efficacy in prolonging AEOC patient survival. However, R0 plays an important role in OS of those patients. Compared to patients undergoing PDS treatment, those undergoing NACT-IDS treatment have a heavier tumor burden and a higher R0 resection rate. Suidan Score is often used to assess satisfactory cytoreductive surgery feasibility in AEOC patients. Next, Validation of the clinical predictive performance of the Suidan score for R0 resectability was performed in the PDS cohort.
Validation of Clinical Predictive Efficacy of the Suidan Score Based on PDS Patients
Employing the established cut-off value of 3, Suidan score demonstrates sensitivity of 94.09%, specificity of 18.02%, NPV (Negative Predictive Value) of 82.19% and PPV (Positive Predictive Value) of 43.13%. Its limitation is reflected in the overall accuracy of 48.28%, which approximates chance-level performance within PDS cohort. This indicates the imperative to develop and validate more accurate predictive models to guide individualized treatment (PDS or NACT-IDS).
Patient Selection Metrics of NACT for AEOC
It is difficult to predict whether a patient with AEOC can achieve complete resection. Thus, we establish preoperative models with R0 as the outcome metric for patients with AEOC. Patients are categorized into NACT-IDS group and PDS group based on treatment strategy. Statistically significant differences are observed between the two groups in terms of age, Suidan score, biomarkers, and other indicators (Table 1). This part stratifies the population according to different initial treatment strategies and constructs separate predictive models to progressively screen patients, aiming to enhance the R0 resection rate of surgeries.
Preoperative Model Predicts R0 Resection Based on the PDS Group
An analysis of the PDS training set revealed notable differences between the R0 and non-R0 groups in terms of age, CA125, CA153, albumin, and the Suidan score (P < 0.05) (Table 4). Diagnostics for Multicollinearity confirmed that these variables are not interrelated (Supplementary_Table_1). Univariate and multivariate logistic regression analyses identified serum CA153 and Suidan score as independent preoperative indicators for achieving an R0 resection (P < 0.05) (Table 5).
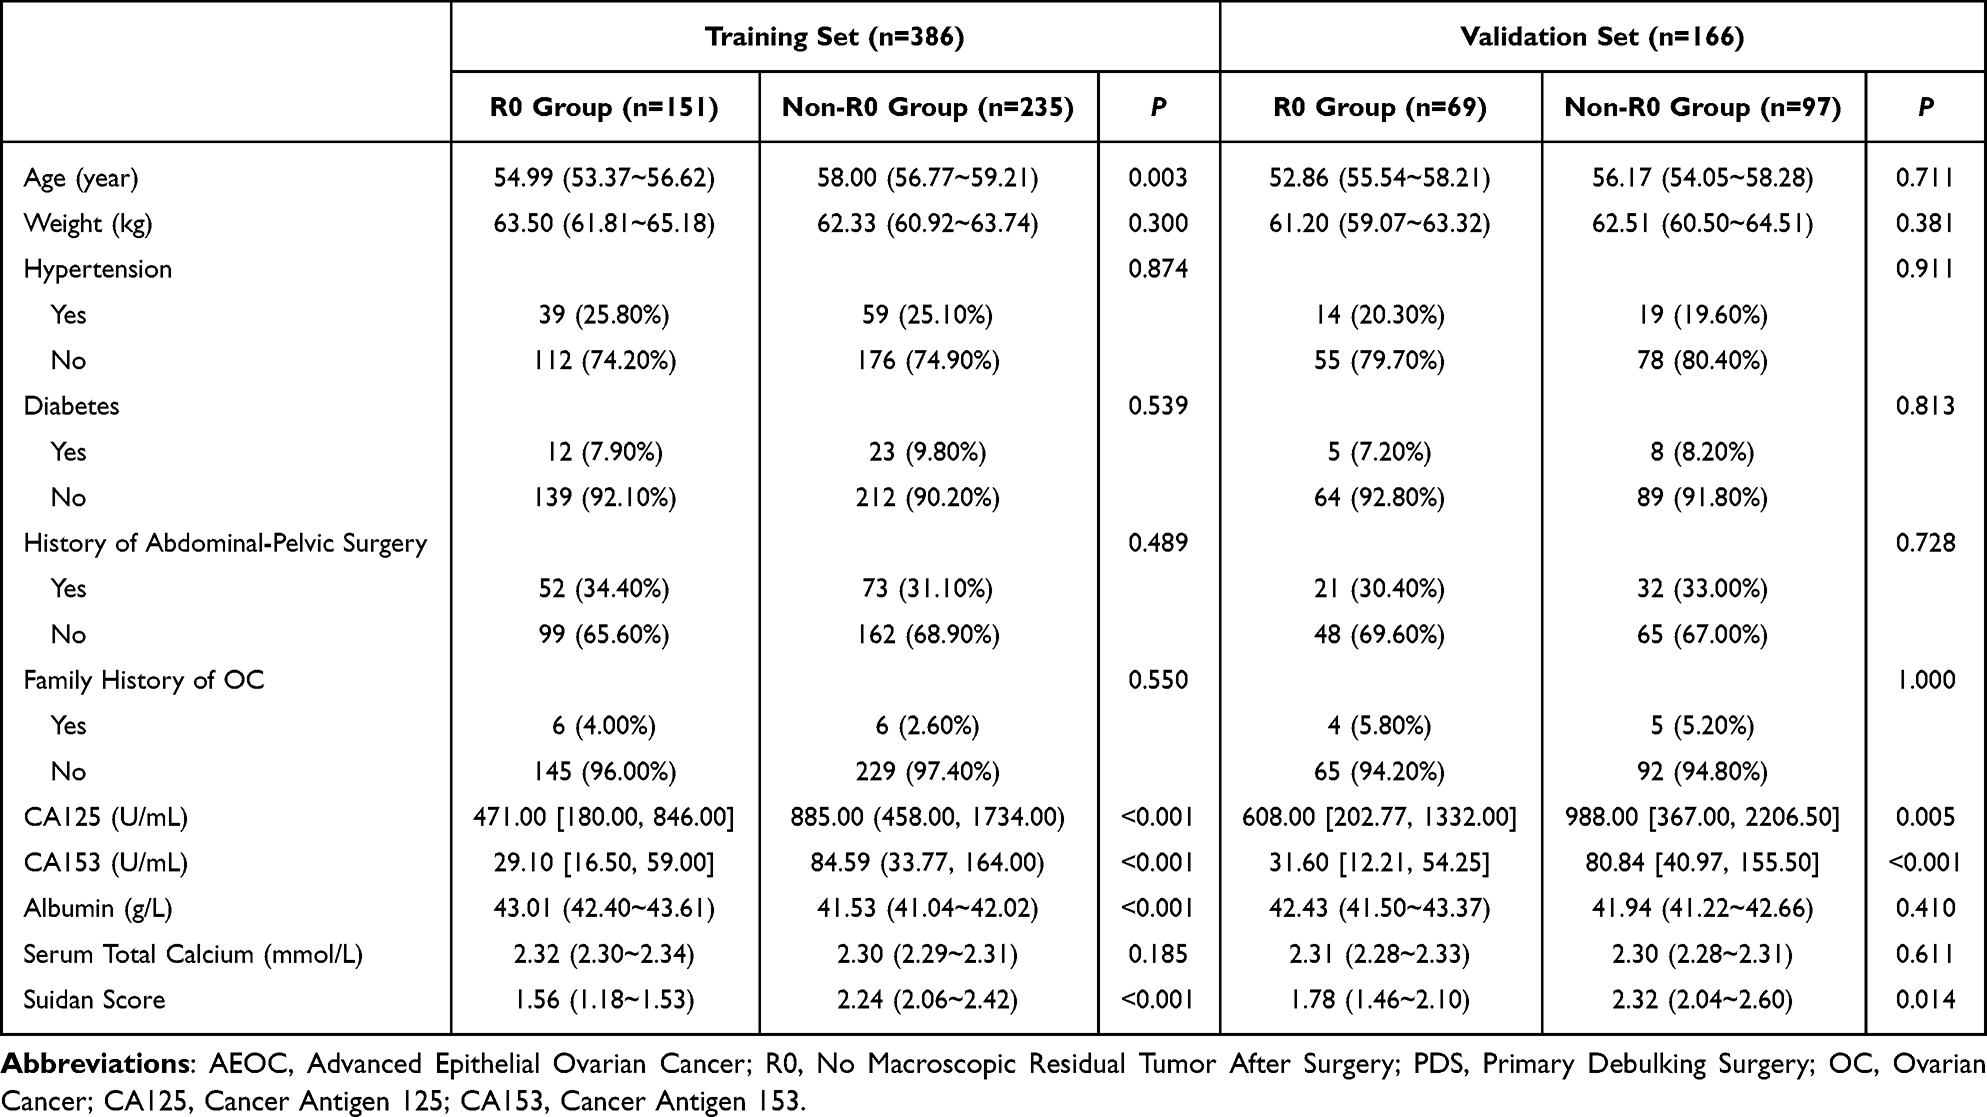 |
Table 4 Baseline Characteristics Comparison Between AEOC Patients with R0 and Non-R0 in the PDS Group (Training and Validation Sets in a 7:3 Ratio) |
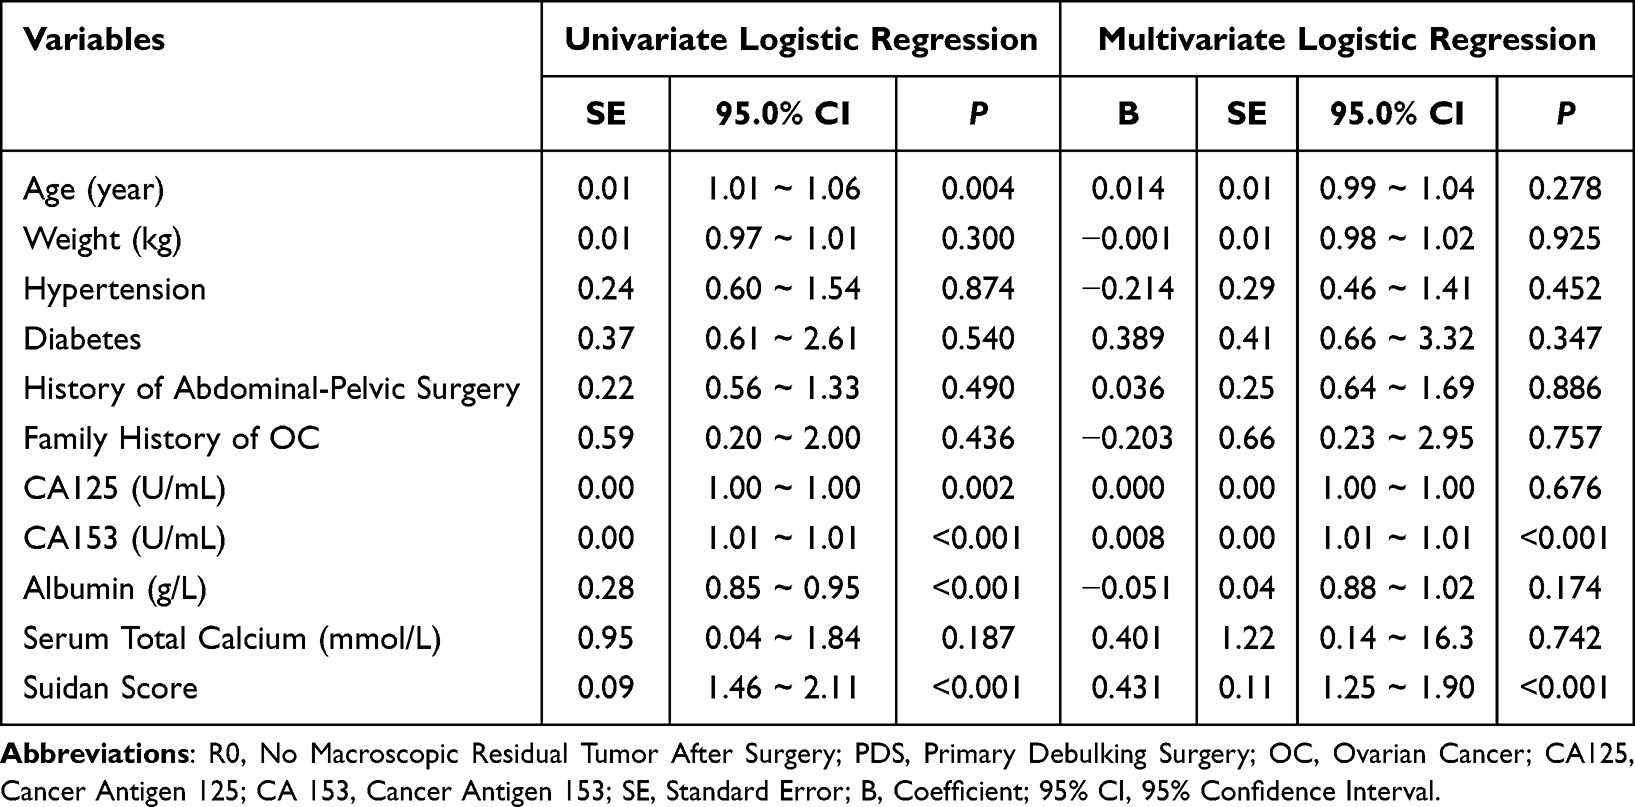 |
Table 5 Logistic Regression Analysis for Predicting R0 Resection in the PDS Training Set |
A predictive model for preoperative assessment of complete primary tumor excision is formulated using data from the PDS training set. The model equation is Logit(P) = 0.009 * CA153 + 0.501 * Suidan score - 1.121. The H-L test suggests that the model fit is good (P = 0.303). In the training cohort, the model records an AUC of 0.763 (95% CI: 0.715 ~ 0.811) (Figure 2A), exhibiting a sensitivity of 79.57%, a specificity of 58.28%, a PPV (Positive Predictive Value) of 74.80%, a NPV (Negative Predictive Value) of 64.71%, and an overall accuracy of 71.24%. For the validation cohort, the AUC is 0.705 (95% CI: 0.626 ~ 0.784) (Figure 2B). Calibration plots indicate a close match between predicted and observed probabilities in both the training set (Figure 2C) and the validation set (Figure 2D). The cut-off value is determined to be 0.639. DCA (Decision Curve Analysis) confirms the model’s clinical utility, demonstrating net benefit across a practical threshold range encompassing the training (Figure 2E) or validation (Figure 2F) set cutoffs.
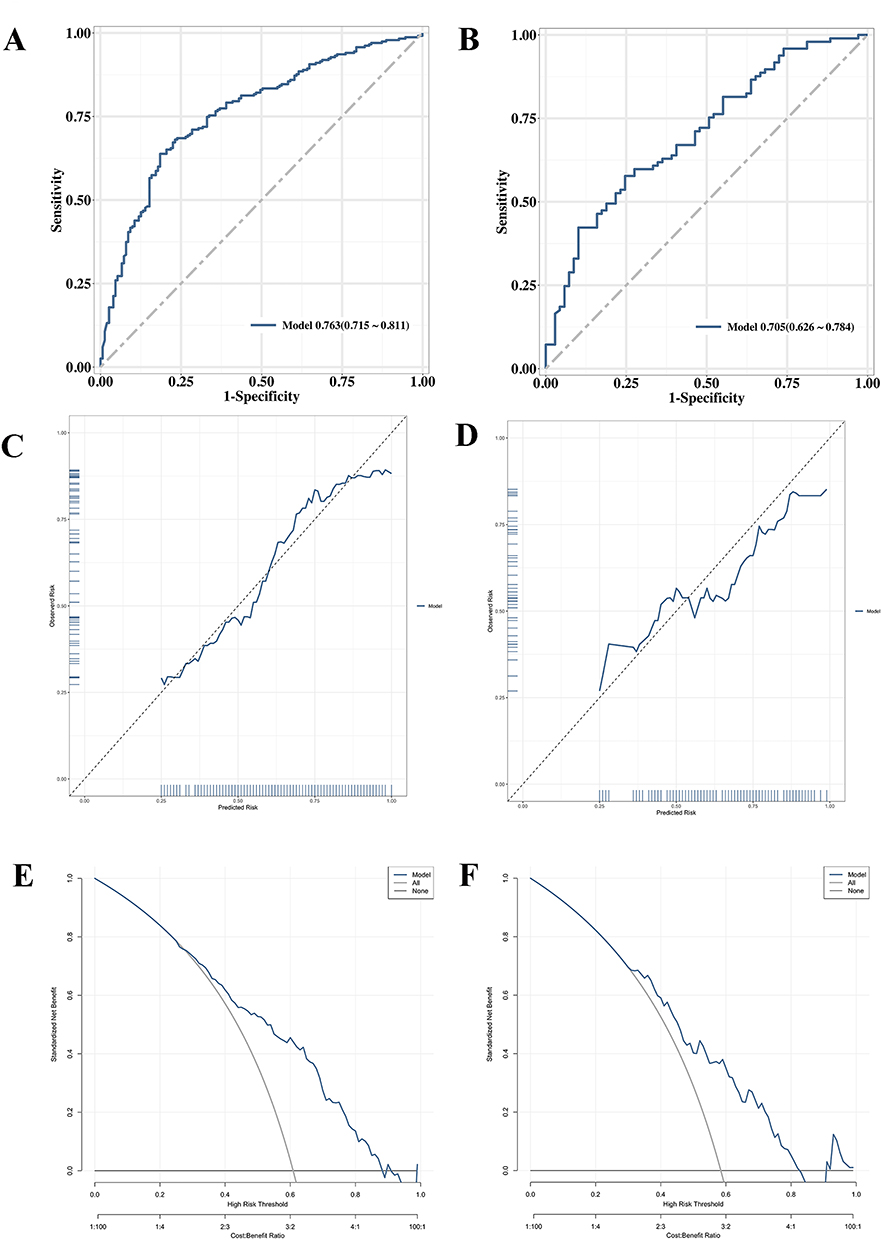 |
Figure 2 Evaluation the preoperative prediction model for achieving R0 resection after surgery based on PDS Group: (A) ROC curves of the training set; (B) ROC curves of the validation set; (C) Calibration plot of the training set; (D) Calibration plot of the validation set; (E) DCA Curve of the training set; (F) DCA curve of the validation set. Abbreviations: ROC, Receiver Operating Characteristic Curve; DCA, Decision Curve Analysis; R0, No Macroscopic Residual Tumor After Surgery. |
In conclusion, the model developed based on the PDS group serves as an effective preliminary tool for identifying AEOC patients who are highly likely to undergo complete tumor resection via PDS. This facilitates the preliminary identification of patients who are appropriate candidates for a PDS approach. However, to thoroughly assess which patients might gain greater advantage from the NACT-IDS strategy, an additional predictive model is required. Consequently, the next phase of this research will focus on developing a second model based on the NACT-IDS group, aimed at accurately determining which patients are most likely to achieve R0 via the NACT-IDS treatment pathway.
Preoperative Model Predicts R0 Resection Based on the NACT-IDS Group
The NACT-IDS group (n = 266) serves as the training dataset to build a predictive model. Patients are sorted according to their post-surgical resection status, whether it is R0 or non-R0. Significant differences are observed among the groups concerning body weight, CA153, and Suidan score (Table 6). Diagnostics for multicollinearity reveal no issues with collinearity among the risk factors (VIF < 2) (Supplementary_Table_2). Univariate and multivariate logistic regression analyses, which included all factors, indicate that CA153 and Suidan score emerged as independent risk factors (P < 0.05) (Table 7). The preoperative prediction model for complete resection of the primary lesion, developed based on the PDS group, can be expressed as: Logit(P) = 1.110 * Suidan score + 0.004*CA153-7.436.
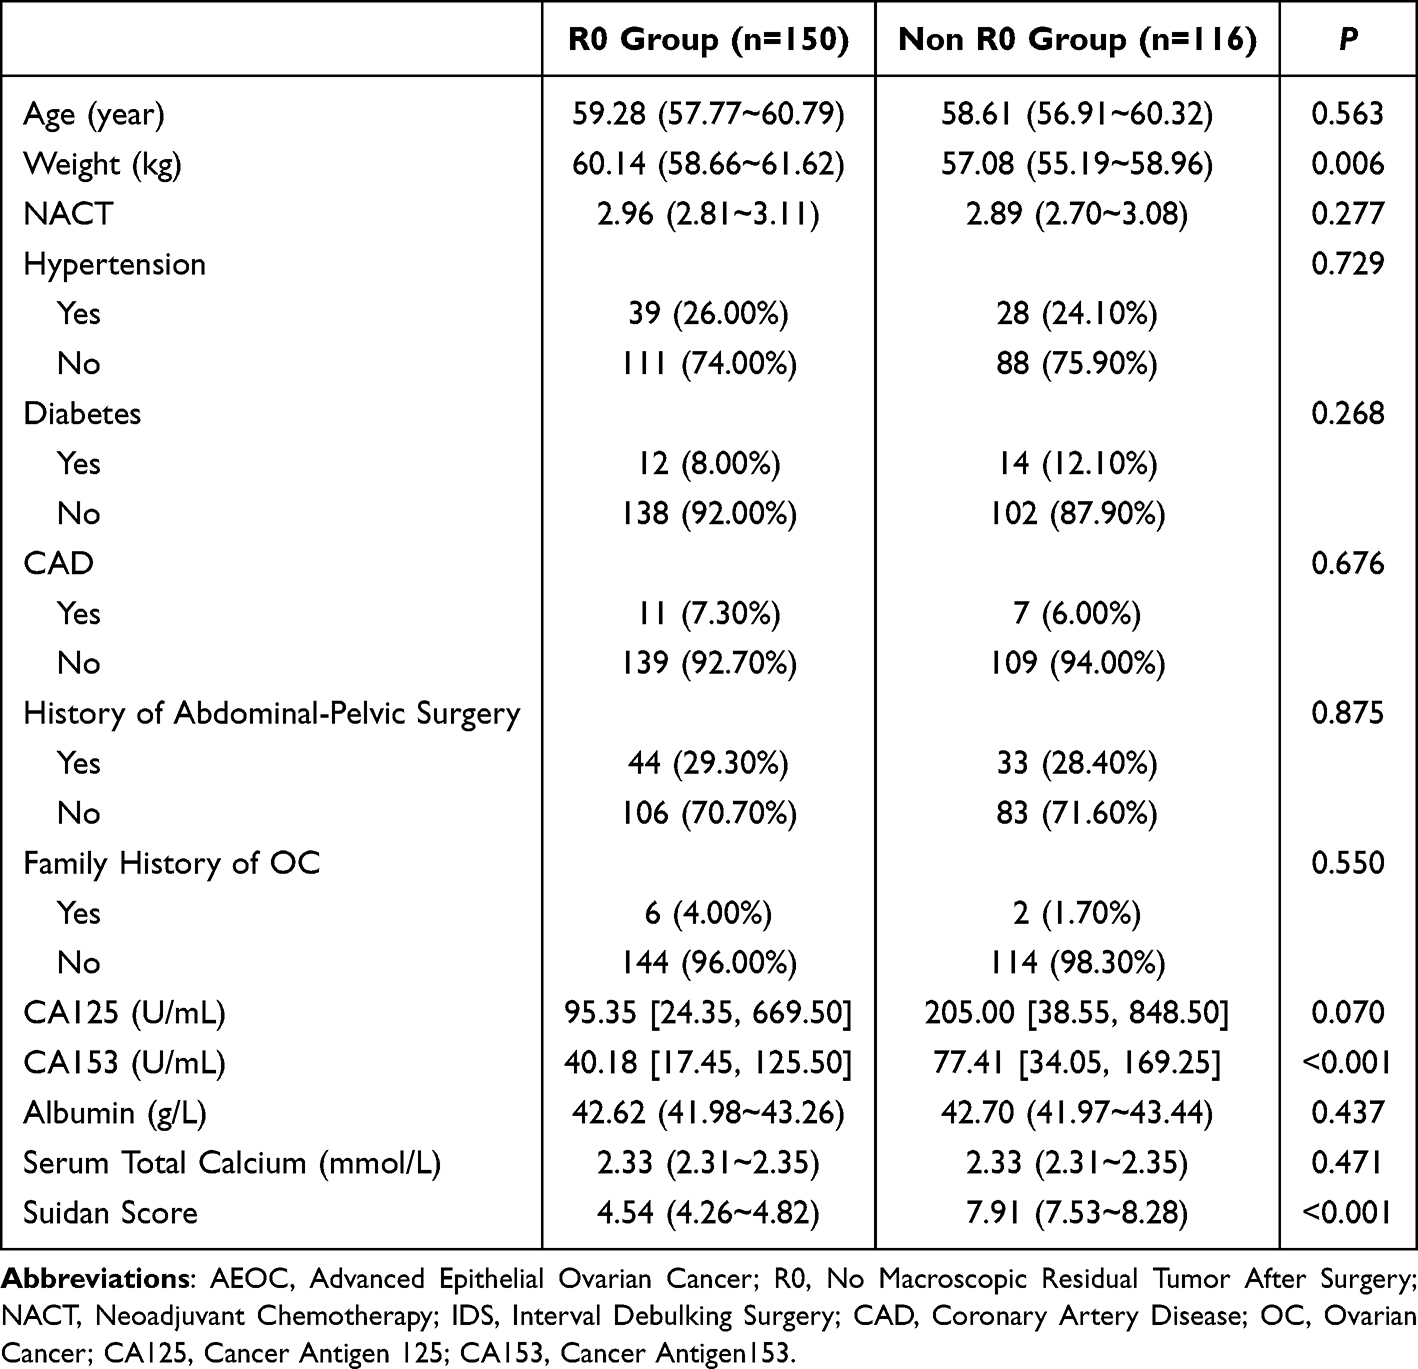 |
Table 6 Baseline Characteristics Comparison Between AEOC Patients with R0 and Non-R0 in the NACT-IDS Group |
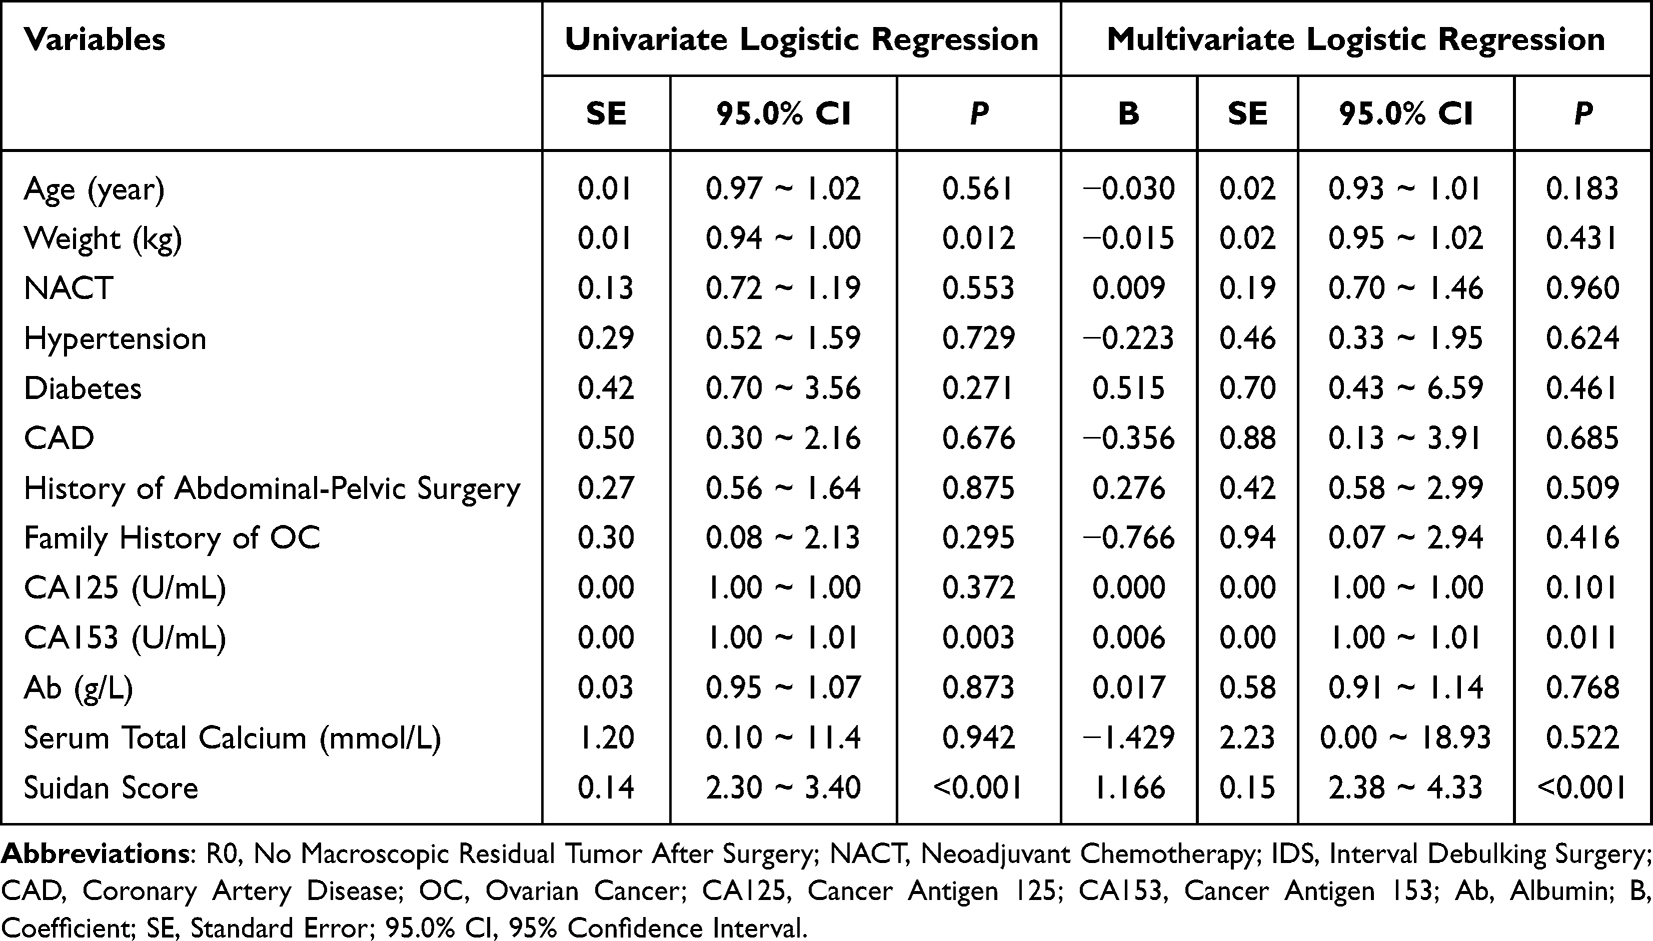 |
Table 7 Logistic Regression Analysis for Predicting R0 Resection in the NACT-IDS Group |
A P-value of 0.156 from the H-L test suggests a well-fitting model. The AUC is 0.911 (95% CI: 0.877 ~ 0.945) (Figure 3A). Subsequently, internal validation of the model was performed. The optimism-corrected AUC was 0.909, with a Dxy value of 0.817 and an optimism estimate of 0.0053, indicating excellent discriminative performance and no evidence of substantial overfitting. The optimal cut-off point is determined to be 0.373, yielding a sensitivity of 76.72%, specificity of 86.67%, PPV (Positive Predictive Value) of 81.65%, NPV (Negative Predictive Value) of 82.80%, and an overall accuracy rate of 82.33%. The calibration plot indicates a strong agreement between predicted and observed results, indicating that this multivariate model has excellent discriminative capability, calibration, and predictive performance (Figure 3B). The DCA (Decision Curve Analysis) results indicates that prediction model (based on the NACT-IDS Group) has a mark net benefit for predicting an AEOC patient with NACT-IDS can achieve complete resection (Figure 3C).
 |
Figure 3 Evaluation the preoperative prediction model for achieving R0 resection after surgery based on NACT-IDS Group: (A) ROC curves of the training set; (B) Calibration plot of the training set; (C) DCA Curve of the training set. Abbreviations: NACT, Neoadjuvant Chemotherapy; IDS, Interval Debulking Surgery; ROC, Receiver Operating Characteristic Curve; DCA, Decision Curve Analysis; R0, No Macroscopic Residual Tumor After Surgery. |
Discussion
This single-center study retrospectively analyzed 818 patients with AEOC treated at Qilu Hospital of Shandong University between January 2014 and December 2023. The baseline characteristics revealed significant differences between patients undergoing PDS and those treated with NACT-IDS, reflecting inherent selection bias present in a real-world setting.10 The NACT-IDS group was significantly older and had lower body weight (P < 0.001), suggesting a tendency to allocate NACT to individuals with reduced physiological reserve.10 Furthermore, comorbidities such as hypertension, diabetes, CAD, previous abdominal-pelvic surgery, and a family history of OC were comparable between the two groups, indicating that systemic medical conditions did not primarily drive treatment selection.9 These baseline imbalances underscore that patients selected for NACT-IDS represented a clinically more advanced and surgically challenging population, which must be carefully considered when interpreting subsequent comparisons of surgical outcomes and survival10 (Table 1).
A comparison of survival outcomes was performed between the PDS and NACT-IDS groups within a large cohort of AEOC patients.15 Although the unadjusted median OS appeared slightly shorter in the NACT-IDS group than in the PDS group (Table 2), multivariable Cox regression16 (Table 3) and Kaplan–Meier analyses4 (Figure 1) demonstrated no statistically significant difference in OS between the treatment strategies after adjustment for confounding factors.15 These findings indicate that NACT-IDS does not consistently prolong OS compared with PDS but rather provides broadly equivalent survival outcomes.8 This observation aligns with major randomized trials and pooled analyses, such as EORTC 559716 and CHORUS.17 However, inconsistent findings across studies, stemming from variations in patient selection, tumor burden, surgical expertise, and center volume, indicate that survival is determined more by disease biology and surgical completeness than by the choice of initial treatment.18
Additionally, achieving an R0 resection was the strongest independent prognostic factor for OS, regardless of the treatment strategy of PDS or NACT-IDS.10 Patients with R0 resection experienced significantly longer survival than those with residual disease, a finding consistent across both groups.19 The NACT-IDS group exhibited a substantially higher R0 resection rate, along with reduced intraoperative blood loss and fewer bowel resections, supporting the role of NACT in reducing tumor burden to facilitate complete resection (Table 2).10 These results align with prior studies reporting higher rates of optimal cytoreduction after NACT-IDS, especially in patients with extensive disease.20 Our findings reinforce the view that IDS do not directly enhance survival; rather, it improves outcomes indirectly by increasing the probability of achieving R0 resection, the principal determinant of long-term prognosis.21
Although the Suidan score has been widely applied to estimate tumor resectability, our validation analysis identified notable limitations, particularly its low specificity and only modest accuracy in predicting R0.22 These findings indicate that reliance on the Suidan score alone may be insufficient for individualized preoperative decision-making.23 To address this limitation, we incorporated serum biomarkers, including CA125 and CA153, into our predictive framework, building upon existing evidence while leveraging our substantially larger sample size to enhance model robustness and stability.13 Importantly, the predictive model intended to guide initial treatment selection was constructed using the PDS cohort, as the primary clinical question at diagnosis is whether a patient is suitable for upfront debulking surgery.24 This PDS-based model was designed to identify patients with a high likelihood of achieving R0 resection with primary surgery.25 In contrast, the IDS cohort represented a biologically and clinically distinct population with a higher baseline tumor burden and more advanced disease.15 Therefore, a separate IDS-specific model was developed and analyzed to evaluate predictors of R0 resection within this subgroup and to assess the generalizability of the predictive approach. The improved performance observed in the IDS model supports the concept that integrating imaging-based tumor burden scores with serologic biomarkers provides a more comprehensive and adaptable strategy for predicting surgical outcomes across different treatment pathways.26,27
The likelihood of achieving complete cytoreduction was estimated through the development of separate predictive models for patients undergoing PDS and those undergoing NACT-IDS.28 The Suidan score was strongly associated with treatment allocation and baseline tumor burden, with significantly higher scores observed in patients selected for NACT-IDS, thus underscoring its value as an imaging-based indicator of disease extent and surgical complexity in AEOC.29 However, when used as a standalone predictor, the Suidan score showed limited discriminatory capacity, particularly due to its low specificity in predicting complete cytoreduction.30 This aligns with previous studies indicating that while the Suidan score is effective in identifying patients unlikely to achieve optimal upfront cytoreduction, it performs less effectively in predicting those who will achieve an R0 resection.31 To enhance predictive accuracy, we integrated serum biomarkers, including CA153, into the models. CA153, though traditionally associated with breast cancer, demonstrated significant predictive value in ovarian cancer, correlating with extensive peritoneal involvement and advanced tumor burden.32 Our findings suggest that CA153 provides additional prognostic and predictive information, complementing the Suidan score and reinforcing its role in a more robust preoperative assessment framework, rather than relying on either marker in isolation.33
Several observations in our analysis warrant careful interpretation. Certain factors identified as protective in multivariable analysis may reflect unmeasured confounding, treatment heterogeneity, or selection bias inherent to retrospective designs. As this was a single-center study, surgical expertise, perioperative management, and institutional treatment protocols may have influenced outcomes, potentially limiting generalizability.10 The absence of propensity score matching (PSM) may have resulted in residual confounding; therefore, the observed associations should be interpreted with caution. Additionally, only 3.50% of patients in our cohort reported a family history of ovarian cancer (<5.00%), making BRCA/ homologous recombination deficiency (HRD) testing a secondary consideration in this study. Regional disparities in healthcare access across China resulted in inconsistent uptake of maintenance therapies.34 Therefore, maintenance therapies, including PARP inhibitors and bevacizumab, were not included in the prognostic analysis. External validation of predictive models, along with the roles of protective family history, BRCA/HRD status, and maintenance therapies warrant further investigation in future studies.
Despite these limitations, the present study provides clinically meaningful insights into treatment selection and surgical planning for AEOC. PFS and OS did not differ significantly between patients undergoing PDS and those undergoing IDS, as confirmed by Kaplan-Meier and Cox regression analyses.9 Although the baseline characteristics suggested that OS appeared longer in the PDS group, this apparent advantage is likely due to imbalances in baseline features such as age, performance status, tumor burden, and other confounding factors.15 Cox regression analysis, by adjusting for these variables, provides a more accurate assessment of the independent effect of the surgical approach. Kaplan–Meier analysis may not fully capture OS trends due to early event clustering, small cohort sizes, or infrequent endpoint occurrences.35,36 Additionally, differences in surgical quality, including R0 resection rates and subsequent treatments, such as chemotherapy regimens or crossover therapy, may further dilute the effect of the surgical approach on OS.37 Therefore, interpretation of survival outcomes should prioritize Cox regression results while considering Kaplan–Meier curve morphology, surgical quality indicators, and long-term survival data. Importantly, precise preoperative evaluation is essential to determine whether patients should undergo PDS or NACT-IDS, with the likelihood of achieving R0 resection serving as a critical outcome indicator.9,38
Another key contribution of this study is the development of treatment-specific predictive models to support individualized surgical decision-making. Models developed from the PDS population can be used to assess whether AEOC patients can achieve R0 resection through primary surgery, whereas models developed using the IDS population can evaluate whether patients can achieve R0 resection following the NACT-IDS approach. These tools may assist clinicians in identifying patients most likely to benefit from PDS or NACT-IDS and contribute to more individualized and evidence-based treatment planning in AEOC.
Conclusion
This study provides a comprehensive evaluation of prognostic factors and preoperative decision-making tools in patients with AEOC. While differences in baseline characteristics and surgical outcomes were observed between patients undergoing PDS and those receiving NACT-IDS, treatment strategy alone did not independently influence OS. Instead, non-R0 emerged as the dominant prognostic factor, underscoring the central importance of achieving complete cytoreduction regardless of treatment pathway. This finding remains highly relevant in the contemporary era of PARP inhibitors and maintenance therapies, where optimal cytoreduction continues to play a critical role in long-term patient outcomes.
The Suidan score demonstrated strong sensitivity for excluding unresectable disease in the PDS setting; however, its limited specificity restricts its use as a standalone decision tool. To address this limitation, we developed and validated preoperative predictive models integrating CA153 and the Suidan score. Importantly, CA153 provided incremental predictive value beyond radiologic assessment alone, enhancing preoperative risk stratification. The PDS-based model showed stable and clinically acceptable predictive performance, enabling improved identification of patients most likely to benefit from upfront surgery. The IDS-based model demonstrated favorable discrimination, calibration, and decision-curve performance, suggesting potential utility for identifying patients who may achieve optimal cytoreduction following neoadjuvant chemotherapy.
Collectively, these findings support a personalized surgical decision framework in AEOC, shifting emphasis from treatment modality toward preoperative prediction of complete resection. Although the predictive models demonstrated promising internal validation performance, external validation in independent multicenter cohorts is required before routine clinical implementation can be recommended. Future prospective studies incorporating molecular biomarkers, BRCA/HRD status, and contemporary maintenance treatment strategies may further refine patient selection and improve individualized treatment planning in AEOC.
Abbreviations
AEOC, Advanced Epithelial Ovarian Cancer; OC, Ovarian Cancer; FIGO, International Federation of Gynecology and Obstetrics; PDS, Primary Debulking Surgery; NACT-IDS, Neoadjuvant Chemotherapy followed by Interval Debulking Surgery; OS, Overall Survival; PFS, Progression-Free Survival; EORTC, European Organisation for Research and Treatment of Cancer; JCOG, Japan Clinical Oncology Group; CT, Computed Tomography; MSKCC, Memorial Sloan Kettering Cancer Center; EPV, Events Per Variable; CA125, Cancer Antigen 125; CA153, Cancer Antigen 153; R0, No Macroscopic Residual Tumor After Surgery (Complete Resection); R1, Macroscopic residual tumor ≤1cm; R2, Macroscopic residual tumor >1cm; CI, Confidence Interval; PPV, Positive Predictive Value; NPV, Negative Predictive Value; ROC, Receiver Operating Characteristic; AUC, Area Under the Curve; DCA, Decision Curve Analysis; VIF, Variance Inflation Factor; H-L test, Hosmer-Lemeshow test; Logit(P), Logit of Probability (Log-odds in a regression model); CAD, Coronary Artery Disease; BRCA, Breast Cancer Susceptibility Gene; PARP, Poly (ADP-ribose) Polymerase.
Data Sharing Statement
The datasets generated during and/or analyzed during the current study are available from the corresponding author (Hui Zhang) upon reasonable request.
Ethics Approval
This study was conducted in accordance with the principles of the Declaration of Helsinki. Ethical approval for this retrospective study was obtained from Qilu Hospital of Shandong University (Ethics Approval No. KYLL-2025-11-066). As this study utilized previously collected clinical data obtained during routine diagnosis and treatment without any intervention in patient management, the Ethics Committee approved a waiver of informed consent. All clinical data were anonymized prior to analysis and handled with strict confidentiality. Independent coding procedures were used to protect participant privacy, and no identifiable personal information was disclosed. The research team formally committed to maintaining the confidentiality and security of all participant information throughout the study.
Acknowledgments
This study uniquely highlights the impact of baseline patient imbalances on survival analyses and emphasizes preoperative evaluation for achieving complete (R0) resection, providing practical guidance for individualized selection between PDS and NACT-IDS in AEOC.10 We sincerely thank all participants in the study. We would like to express our gratitude to the team of the Gynecology Follow-up Office of Qilu Hospital of Shandong University.
Author Contributions
All authors made a significant contribution to the work reported, whether that is in the conception, study design, execution, acquisition of data, analysis and interpretation, or in all these areas; took part in drafting, revising or critically reviewing the article; gave final approval of the version to be published; have agreed on the journal to which the article has been submitted; and agreed to be accountable for all aspects of the work.
Funding
This work was supported by grants from the National Natural Science Foundation of China (Project No. 82272781), Shandong Medical Association Clinical Scientific Research Fund - Qilu Special project (YXH2022ZX02144) and Beijing Xisike Clinical Oncology Research Foundation (Y-MSDPU2022-0223).
Disclosure
The authors have no conflicts of interest to declare that are relevant to the content of this article.
References
1. Wanyama FM, Umeh O, Biskup K, et al. High-mannose N-glycans to monitor early response to chemotherapy in African epithelial ovarian cancer Patients─A pilot study. J Proteome Res. 2026;25(1):99–16. doi:10.1021/acs.jproteome.5c00442
2. Huang M, Guan M, Rao Q, et al. Long-term trends and projections of ovarian cancer burden in China (1990 to 2040): an age-period-cohort analysis based on GBD 2021 data. Front Oncol. 2025;15:1652347. doi:10.3389/fonc.2025.1652347
3. Jung D, Branscheidt S, Wittenberg I, et al. Epidemiology and treatment of malignant ovarian germ cell and sex cord stromal tumors in Germany: a population-based cancer registry study from 2016 – 2021. Sci Rep. 2025;15(1):44145. doi:10.1038/s41598-025-32998-5
4. Berczi AS, Lampe O, Krasznai ZT, et al. Selective advantage of NACT in advanced ovarian cancer: a retrospective single-centre analysis. Medicina (Kaunas). 2025;61. doi:10.3390/medicina61081493
5. Secchi M, Signorelli M, Rulli E, et al. Neoadjuvant chemotherapy followed by interval surgery versus primary debulking surgery in FIGO stage III-IV epithelial ovarian cancer: a systematic review and meta-analysis. Eur J Cancer. 2025;232:116116. doi:10.1016/j.ejca.2025.116116
6. Prescott LS, Vergote I, Sun CC, et al. Transfusion use and effect on progression-free, overall survival, and quality of life in upfront treatment of advanced epithelial ovarian cancer: evaluation of the European organization for research and treatment EORTC-55971 cohort. Int J Gynecol Cancer. 2023;33(1):1–9. doi:10.1136/ijgc-2022-003947
7. Kehoe S, Hook J, Nankivell M, et al. Primary chemotherapy versus primary surgery for newly diagnosed advanced ovarian cancer (CHORUS): an open-label, randomised, controlled, non-inferiority trial. Lancet. 2015;386(9990):249–257. doi:10.1016/S0140-6736(14)62223-6
8. Onda T, Satoh T, Saito T, et al. Comparison of treatment invasiveness between upfront debulking surgery versus interval debulking surgery following neoadjuvant chemotherapy for stage III/IV ovarian, tubal, and peritoneal cancers in a Phase III randomised trial: Japan clinical oncology group study JCOG0602. Eur J Cancer. 2016;64:22–31. doi:10.1016/j.ejca.2016.05.017
9. Reuss A, du Bois A, Harter P, et al. TRUST: trial of radical upfront surgical therapy in advanced ovarian cancer (ENGOT ov33/AGO-OVAR OP7). Int J Gynecol Cancer. 2019;29(8):1327–1331. doi:10.1136/ijgc-2019-000682
10. Chiva L, Ordas P, Mishra J, et al. SUROVA study: global real-world treatment strategies and mortality risk prediction in advanced ovarian cancer. Int J Gynecol Cancer. 2025;35(12):102688. doi:10.1016/j.ijgc.2025.102688
11. Garcia-Atutxa I, Villanueva-Flores F, Barrio ED, et al. Artificial intelligence for ovarian cancer diagnosis via ultrasound: a systematic review and quantitative assessment of model performance. Front Artif Intell. 2025;8:1649746. doi:10.3389/frai.2025.1649746
12. Cascales-Campos PA, Lacueva FJ, Carbonell-Morote S, et al. Intraperitoneal intraoperative chemotherapy in advanced ovarian cancer: rethinking the future beyond complete macroscopic resection. Ann Surg Oncol. 2025;32(8):5616–5623. doi:10.1245/s10434-025-17432-4
13. Jia Y, Jiang Y, Fan X, et al. Preoperative serum level of CA153 and a new model to predict the sub-optimal primary debulking surgery in patients with advanced epithelial ovarian cancer. World J Surg Oncol. 2024;22(1):64. doi:10.1186/s12957-024-03336-2
14. National Cancer Institute. Previous version: SEER cancer statistics review, 1975-2013. 2016. Available from: http://seer.cancer.gov/csr/1975_2013/.
15. Bogani G, Matteucci L, Tamberi S, et al. The impact of number of cycles of neoadjuvant chemotherapy on survival of patients undergoing interval debulking surgery for stage IIIC-IV unresectable ovarian cancer: results from a multi-institutional study. Int J Gynecol Cancer. 2017;27(9):1856–1862. doi:10.1097/IGC.0000000000001108
16. Timmermans M, van der Aa MA, Lalisang RI, et al. Interval between debulking surgery and adjuvant chemotherapy is associated with overall survival in patients with advanced ovarian cancer. Gynecol Oncol. 2018;150(3):446–450. doi:10.1016/j.ygyno.2018.07.004
17. Vergote I, Coens C, Nankivell M, et al. Neoadjuvant chemotherapy versus debulking surgery in advanced tubo-ovarian cancers: pooled analysis of individual patient data from the EORTC 55971 and CHORUS trials. Lancet Oncol. 2018;19(12):1680–1687. doi:10.1016/S1470-2045(18)30566-7
18. Machida H, Kawana K, Okamoto A, et al. Impact of neoadjuvant chemotherapy followed by interval debulking surgery on survival in women with advanced non-serous ovarian, fallopian tube, or primary peritoneal cancer. Gynecol Oncol. 2025;203:8–15. doi:10.1016/j.ygyno.2025.10.013
19. Liu X, Zhao Y, Jiao X, et al. Does the primary treatment sequence affect post-relapse survival in recurrent epithelial ovarian cancer? A real-world multicentre retrospective study. BJOG. 2022;129(S2):70–78. doi:10.1111/1471-0528.17329
20. Fagotti A, Ferrandina MG, Vizzielli G, et al. Randomized trial of primary debulking surgery versus neoadjuvant chemotherapy for advanced epithelial ovarian cancer (SCORPION-NCT01461850). Int J Gynecol Cancer. 2020;30(11):1657–1664. doi:10.1136/ijgc-2020-001640
21. Schreuder Goedheijt M, van Stein RM, Koole SN, et al. Budget impact analysis of hyperthermic intraperitoneal chemotherapy with interval cytoreductive surgery in ovarian cancer. JCO Oncol Pract. 2025:OP2500670. doi:10.1200/OP-25-00670
22. Kumar A, Sheedy S, Kim B, et al. Models to predict outcomes after primary debulking surgery: independent validation of models to predict suboptimal cytoreduction and gross residual disease. Gynecol Oncol. 2019;154(1):72–76. doi:10.1016/j.ygyno.2019.04.011
23. Hawarden A, Price M, Russell B, et al. A three protein signature fails to externally validate as a biomarker to predict surgical outcome in high-grade epithelial ovarian cancer. PLoS One. 2023;18(3):e0281798. doi:10.1371/journal.pone.0281798
24. Feng Z, Wen H, Jiang Z, et al. A triage strategy in advanced ovarian cancer management based on multiple predictive models for R0 resection: a prospective cohort study. J Gynecol Oncol. 2018;29(5):e65. doi:10.3802/jgo.2018.29.e65
25. Saba A, Ishaqi MSQ, Khan MS, et al. The predictive model of suboptimal primary debulking surgery among women with ovarian cancer using pre-operative computerized tomography, tumor markers and comparison with the intraoperative findings: an experience in tertiary care hospital of Pakistan. Asian Pac J Cancer Prev. 2025;26(5):1671–1679. doi:10.31557/APJCP.2025.26.5.1671
26. Zhang D, Jiang YX, Luo SJ, et al. Serum CA125 levels predict outcome of interval debulking surgery after neoadjuvant chemotherapy in patients with advanced ovarian cancer. Clin Chim Acta. 2018;484:32–35. doi:10.1016/j.cca.2018.04.030
27. Bhatt A, Mehta S, Glehen O. Do all patients that undergo a ‘complete’ secondary cytoreductive surgery for platinum-sensitive recurrent ovarian cancer, benefit from it? Pleura Peritoneum. 2024;9(3):93–105. doi:10.1515/pp-2023-0052
28. Li C, Cui Q, Wang X, et al. CA-125 elimination rate constant K (KELIM) as a promising predictor of complete cytoreduction after neoadjuvant chemotherapy in advanced ovarian cancer patients: a retrospective study from two Chinese hospitals. BMC Cancer. 2024;24(1):609. doi:10.1186/s12885-024-12252-3
29. Suidan RS, Ramirez PT, Sarasohn DM, et al. A multicenter assessment of the ability of preoperative computed tomography scan and CA-125 to predict gross residual disease at primary debulking for advanced epithelial ovarian cancer. Gynecol Oncol. 2017;145(1):27–31. doi:10.1016/j.ygyno.2017.02.020
30. Song J, Jiang X, Zhang A, et al. Preoperative clinical scores compared with dual-energy computed tomography parameters in predicting complete resection of ovarian advanced high-grade serous carcinoma. Clin Radiol. 2025;91:107104. doi:10.1016/j.crad.2025.107104
31. Gerestein CG, Eijkemans MJ, Bakker J, et al. Nomogram for suboptimal cytoreduction at primary surgery for advanced stage ovarian cancer. Anticancer Res. 2011;31(11):4043–4049.
32. Matsas A, Stamoula E, Kontzoglou K, et al. Unveiling the diagnostic significance of calprotectin in serous ovarian carcinoma. Life (Basel). 2025;15(7). doi:10.3390/life15071080
33. Matsas A, Stefanoudakis D, Troupis T, et al. Tumor markers and their diagnostic significance in ovarian cancer. Life (Basel). 2023;13. doi:10.3390/life13081689
34. Hai L, Cui Y, Zhang J, et al. The dynamic equilibrium between population aging and the allocation of elderly medical care resources in the yellow river basin. BMC Public Health. 2025;25(1):2510. doi:10.1186/s12889-025-22984-x
35. Li F, Guo Y, Cai X, et al. Clinicopathological characterization and prognostic risk modeling in patients with synchronous ovarian and endometrial cancer: a population-based study. Ann Med Surg (Lond). 2025;87(12):8201–8211. doi:10.1097/MS9.0000000000004015
36. Yan S, Cao Z, Zhang Q, et al. Individualized survival prediction and risk stratification using machine learning for patients with malignant struma ovarii: a population-based study with external validation. Gland Surg. 2025;14(6):1052–1065. doi:10.21037/gs-2025-35
37. Tius V, Taliento C, Arcieri M, et al. Surgical timing in advanced ovarian cancer during the TRUST trial era: a systematic review, meta-analysis and study-level meta-regression of randomized controlled trials. Eur J Surg Oncol. 2025;52(2):111355. doi:10.1016/j.ejso.2025.111355
38. Siesto G, Cavina R, Romano F, et al. Primary debulking surgery versus neoadjuvant chemotherapy in advanced epithelial ovarian cancer: a propensity-matched analysis. Am J Clin Oncol. 2018;41(3):280–285. doi:10.1097/COC.0000000000000262
 © 2026 The Author(s). This work is published and licensed by Dove Medical Press Limited. The
full terms of this license are available at https://www.dovepress.com/terms
and incorporate the Creative Commons Attribution
- Non Commercial (unported, 4.0) License.
By accessing the work you hereby accept the Terms. Non-commercial uses of the work are permitted
without any further permission from Dove Medical Press Limited, provided the work is properly
attributed. For permission for commercial use of this work, please see paragraphs 4.2 and 5 of our Terms.
© 2026 The Author(s). This work is published and licensed by Dove Medical Press Limited. The
full terms of this license are available at https://www.dovepress.com/terms
and incorporate the Creative Commons Attribution
- Non Commercial (unported, 4.0) License.
By accessing the work you hereby accept the Terms. Non-commercial uses of the work are permitted
without any further permission from Dove Medical Press Limited, provided the work is properly
attributed. For permission for commercial use of this work, please see paragraphs 4.2 and 5 of our Terms.