Back to Journals » Patient Related Outcome Measures » Volume 11
Patient Experience Monitor (PEM): The Development of New Short-Form Picker Experience Questionnaires for Hospital Patients with a Wide Range of Literacy Levels
Authors Bastemeijer CM, Boosman H, Zandbelt L, Timman R, de Boer D, Hazelzet JA ![]()
Received 27 July 2020
Accepted for publication 13 October 2020
Published 30 November 2020 Volume 2020:11 Pages 221—230
DOI https://doi.org/10.2147/PROM.S274015
Checked for plagiarism Yes
Review by Single anonymous peer review
Peer reviewer comments 2
Editor who approved publication: Professor Lynne Nemeth
Carla M Bastemeijer,1 Hileen Boosman,2 Linda Zandbelt,3 Reinier Timman,4 Dolf de Boer,5 Jan A Hazelzet1
1Department of Public Health, Erasmus University Medical Center, Rotterdam, the Netherlands; 2Department of Quality & Patient Safety, Leiden University Medical Center, Leiden, the Netherlands; 3Department of Clinical and Executive Support, Amsterdam University Medical Centers, Amsterdam, the Netherlands; 4Department of Psychiatry, Unit of Medical Psychology & Psychotherapy, Erasmus University Medical Center, Rotterdam, the Netherlands; 5Care from the Patient Perspective, Nivel, Utrecht, the Netherlands
Correspondence: Carla M Bastemeijer
Department of Public Health, Erasmus University Medical Center, P.O. Box 2040, Rotterdam, CA 3000, the Netherlands
Tel +31 612601805
Email [email protected]
Purpose: Several patient-reported experience measures (PREMs) were developed through the years. These questionnaires are frequently found to be inappropriate for people with lower literacy levels. This paper describes the development of patient experience questionnaires for hospital patients with a wide range of literacy levels, while enabling the potential for quality improvement.
Methods: Mixed methods were used to adapt Picker Institute patient experience questionnaires: selection of items and adaptation towards language level B1 (the language level of which patients can express their own opinion and describe experiences, events and expectations) by expert panels, usability tests with patients, analysis of psychometric properties and member checking. A theory-driven approach was followed for definitive enrolment of items, meaning that the items eligible for exclusion had been carefully reviewed by the expert team and representatives of a patient council before definitive exclusion.
Results: A pilot study was performed in an University Medical Centre in the Netherlands among in- and outpatients after discharge. Two provisional questionnaires of 22 items, designed by an expert panel, were reduced towards a final selection of 14– 15 items. This led to two short-form questionnaires, called Patient Experience Monitor (PEM) Adult Inpatient and PEM Adult Outpatient. To illustrate, the results of the PEM Adult Outpatient questionnaire are presented.
Conclusion: PEMs are short and valid questionnaires specifically developed to measure patient experiences of hospital patients with a wide range of literacy levels. Acceptance of the questionnaires for both lower and higher educated patients are confirmed by usability tests. The respondents of the pilot study represent both groups. The developed questionnaires should be seen as a dynamic entity and part of a continuous effort to evaluate and improve patient experiences. Future studies are needed to examine the usability of these new questionnaires for quality improvement.
Keywords: patient experiences, quality in healthcare, patient centered care, PREM
Introduction
The concept of patient-centered care (PCC) is considered fundamental for high-quality health-care systems.1–4 The foundation of PCC lies in understanding and respecting individual patient values, preferences and expressed needs, which should be the basis of the clinical encounter and guide all clinical decisions.3,5–7 Patient experiences have become a key indicator to examine patient centeredness and quality of healthcare.8 To get insight in patient experiences, a number of tools can be used to capture the complexity of hospital care. Questionnaires are commonly used because of their capability to include a large number of patients in a standardized manner.9,10
Through the years, several generic and disease-specific patient-reported experience measures (PREMs) were developed. The choice of an instrument as such should be determined by a balanced consideration of different aspects of utility such as costs (a large standardized sample can be expensive), acceptability by their users (healthcare professionals and patients) and educational impact (can healthcare be improved with the results).10 Also, it should be kept in mind that characteristics of PREMs which may lead to an overall low response rate or non-response bias should be avoided. A frequently found characteristic of questionnaires is that these are less appropriate for people with lower literacy levels.11,12 The language used by healthcare professionals is usually too difficult to understand for this population, and this language often occurs in surveys as well.13 Furthermore, questionnaires often include a large number of questions while a more concise questionnaire has a better response rate.14–16 The result may be an instrument that due to the lack of comprehensibility, length, or low response rates, has a reduced educational impact.17,18
Therefore, short and simple questionnaires that capture different aspects of PCC are essential to evaluate patient experiences with hospital care.19–21 These questionnaires should preferably be developed with extensive involvement of users applying techniques such as interviews, focus groups, and usability tests (cognitive interviewing).22–24 Additionally, the questionnaires must be useful to guide quality improvement (QI) in clinical practice.25–27
In the search for validated patient experience questionnaires that met the aforementioned criteria, Picker Institute questionnaires were selected considering; 1) Picker Institute’s longstanding history and extensive research in developing and validating patient experiences questionnaires, 2) the underlying theory of 8 principles of PCC,21 3) extensive patient involvement in questionnaire development, and 4) permission to adapt the questionnaires.
The development of Patient Experience Monitor (PEM) contributes to patient experience measurements by integrating the various insights from existing questionnaires, the latest insights regarding literacy, the trend towards shorter questionnaires and the focus on QI. The aims of this study were twofold:
a) To adapt this questionnaire for people with limited health literacy by the use of simple language.
b) To shorten existing validated patient experience questionnaires for a better response rate.
This paper describes the process of adapting two existing patient experience questionnaires of Picker Institute for patients with a wide range of literacy levels in a hospital setting, while enabling the potential for QI in the Netherlands and internationally.
Methods
The following methods were used to construct the new questionnaires: expert panel, cognitive interviews, analysis of psychometric properties and member checking (Figure 1). Each method is described below.
 |
Figure 1 Method of survey development. |
Expert Panel
An expert panel of ten members was convened to select existing questionnaires and adapt these to shortened versions and to optimize comprehensibility for a broad range of literacy levels. The panel included the original translator, experts in healthcare, quality managers and staff advisors of various university medical centers, as well as experts with experience in questionnaire development and translation. Furthermore, a staff member of Pharos was involved. Pharos is a Dutch institute that specializes in decreasing healthcare disparities related to language, education level, health skills and cultural background of patients (https://www.pharos.nl/english/). Given that the original Picker questionnaires consist of 67 to 87 items, the expert panel aimed to reduce the questionnaires to a core set of items that represent the eight key domains of PCC as identified by Picker Institute.21
Cognitive Interviews
Provisional questionnaires, the version compiled by a first reduction of the expert panel, were tested by means of cognitive interviews on a purposive sample (N=28). Participants were informed about the aims of the study and received written information about participating in medical scientific research prior to the start of the study by the principal investigator (CB). All participants (and parents or legal guardians if under 18 years of age) provided written informed consent prior to the interview. The Three-Step Test-Interview procedure (TSTI) was used.28 The TSTI is an observation-based method for pretesting self-completion questionnaires in three steps; 1) Observation of response behavior and concurrent think aloud verbalization, 2) Follow-up interview for clarifying and completing the interviewers interpretation, and 3) Eliciting experiences and opinions of the interviewees. Relevance of the questions and answers was evaluated, as well as the method of online collection. All participants verified the findings and the suggestions of their own interview as part of a member checking process. The findings and suggestions were completely anonymized and documented by the interviewer.
Data Analysis of Psychometric Properties
In order to test whether the number of items of the provisional questionnaires had to be further reduced, a pilot study was performed in a University Medical Centre in the Netherlands between January and April 2019 at departments that were enthusiastic about the study and were willing to participate. All in- and outpatients of 16 years and older who visited or were hospitalized at the neurology, surgery or ear-nose-throat (ENT) department received within two weeks after discharge by email an invitation with a link to complete one of the provisional questionnaires in an online environment. Patients who were not willing to participate could unsubscribe via a link in the received e-mail. A reminder was sent to non-responders two weeks after the initial invitation. Questionnaires were included for analysis only if at least 50% of multiple-choice items were completed. Questionnaire items were eligible for exclusion if they fulfilled one of the following criteria:
- Item response: more than 10% missing values, with exemption of routing questions (eg, “if yes go to question …”);
- Room for improvement: items with more than 90% of responses in the same extreme category (ie, floor-ceiling effect);
- Item relevance: items with more than 40% of response “not applicable”.
Since the questionnaires were developed with the aim of QI, a theory-driven approach was followed for definitive enrolment of items instead of a data driven approach.29,30 A data driven approach, such as performing Rasch analyses or principal component analyses followed by reliability analyses for item reduction, better suits questionnaires with many questions per domain. This is not applicable here, as there are only a few questions for each domain, and we want to maintain all eight domains. The theory-driven approach means, that the items eligible for exclusion had been carefully reviewed by the expert team and representatives of a patient council before definitive exclusion (member checking). For example, the item was not excluded when it represented an essential component of PCC according to Picker institutes principles or was considered to be of great importance for QI, despite a floor-ceiling effect or low relevance. Of the final selection of items, Spearman correlation coefficients were calculated, correlations >0.70 were flagged as an indication that items yield overlapping information.
Member Checking
Member checking is traditionally a technique in qualitative research used to establish the tenet of credibility of data.31 The results have to be returned to participants to check for accuracy and resonance with their contribution. The final questionnaires were presented to all those involved in the adaptation process (quality managers, staff advisors, healthcare professionals and patients) for evaluation, discussion and approval.
Ethical Approval
Ethical approval for the study was given by the Institutional Review Board Erasmus MC Rotterdam in the Netherlands, case number MEC-2018-1714.
Results
PEM Adult Outpatient: Expert Panel
To illustrate, the results of the adaptation process of PEM Adult Outpatient are presented. The process and results of the PEM Adult Inpatient followed a similar path (Supplementary Table 1–3, Supplementary Figure 1). As required by Picker Institute, their Survey Adaptation Guide was accurately followed.32 This implies that every step in the adaptation process that generates a reduction or adjustment of items was presented to Picker Institute for discussion and approval. The questionnaire was first translated from English into Dutch according to the forward-backward procedure. Based on the results of previously used patient experience questionnaires of various university medical centers in the Netherlands, our knowledge on what patients value in healthcare4 and the suitability of items for QI, the expert panel reached consensus on 22 eligible items out of 87 items of Picker Adult Outpatient (Figure 2). An even representation of Picker Institutes 8 principles of PCC (2–5 items per principle) was taken into account. The pilot study was used to investigate whether the selection should be further reduced. A staff member of Pharos edited the selected items to language level B1, the language level of which patients can express their own opinion and describe experiences, events and expectations (https://europass.cedefop.europa.eu/nl/resources/european-language-levels-cefr).
 |
Figure 2 Flowchart of excluded questions. |
PEM Adult Outpatient: Cognitive Interviews
This provisional questionnaire of 22 items was cognitively tested on a purposive sample of 28 discharged patients for comprehensibility and relevance of the items from a patients point of view. These patients were recruited in a primary care center by their GP or physiotherapist 6 weeks after hospital discharge or visiting an outpatient clinic at the latest. This sample consisted of 13 men and 15 women, of whom eight were aged 16–25, fourteen aged 25–60 and six of them were 60 years and older. Sixteen had a lower education level (≤ lower secondary education) and 12 of them had a higher education level (≥ upper secondary education). On the basis of the interviews, adjustments were made to the text of the introduction and questions and one item (Q22) was removed due to multiple interpretations. Two patients with a higher level of education criticized the simplicity of the language used, but acknowledged that the language chosen was to give priority reaching lower literate people. The vast majority, 26 of the 28 interviewees, did not comment on the simplicity of language used.
PEM Adult Outpatient: Data Analysis of Psychometric Properties
The cognitively tested and modified outpatient questionnaire of 21 items was sent within two weeks after consultation to all neurology, surgery and ear-nose-throat (ENT) outpatients who registered their email and had given permission to use email for communication (N=6806, which is 58.7% of the visiting patients). Of these, 53.3% were men and 46.7% women. Patients who were not willing to participate could unsubscribe via a link in the received e-mail, or simply not respond. The final response rate for this survey was 36.8%. In Table 1 gender, age and education level of the respondents are shown. Of the 2506 respondents, 54.4% were men and 45.6% were women. Regarding educational level, 21.3% of all respondents had a low education level (early childhood, primary and lower secondary education), 35.3% an intermediate education level (upper secondary education) while 43.6% had a high education level (equivalent to tertiary education and Bachelor’s, Master’s or Doctoral level). Of all these respondents, 2384 completed more than 50% of the items and were included for further analysis. Missing values ranged from 0.3% to 5.4% with the exception of the question Q4 “Could other people hear what you were saying to the person at the reception?”, where 17.4% of the answers were missing (Table 2). Seven items had a ceiling effect, items with a floor effect were not found. Four items of the questionnaire were of low relevance for a larger group of patients (>40% category response “not applicable”).
 |
Table 1 Characteristics of Respondents |
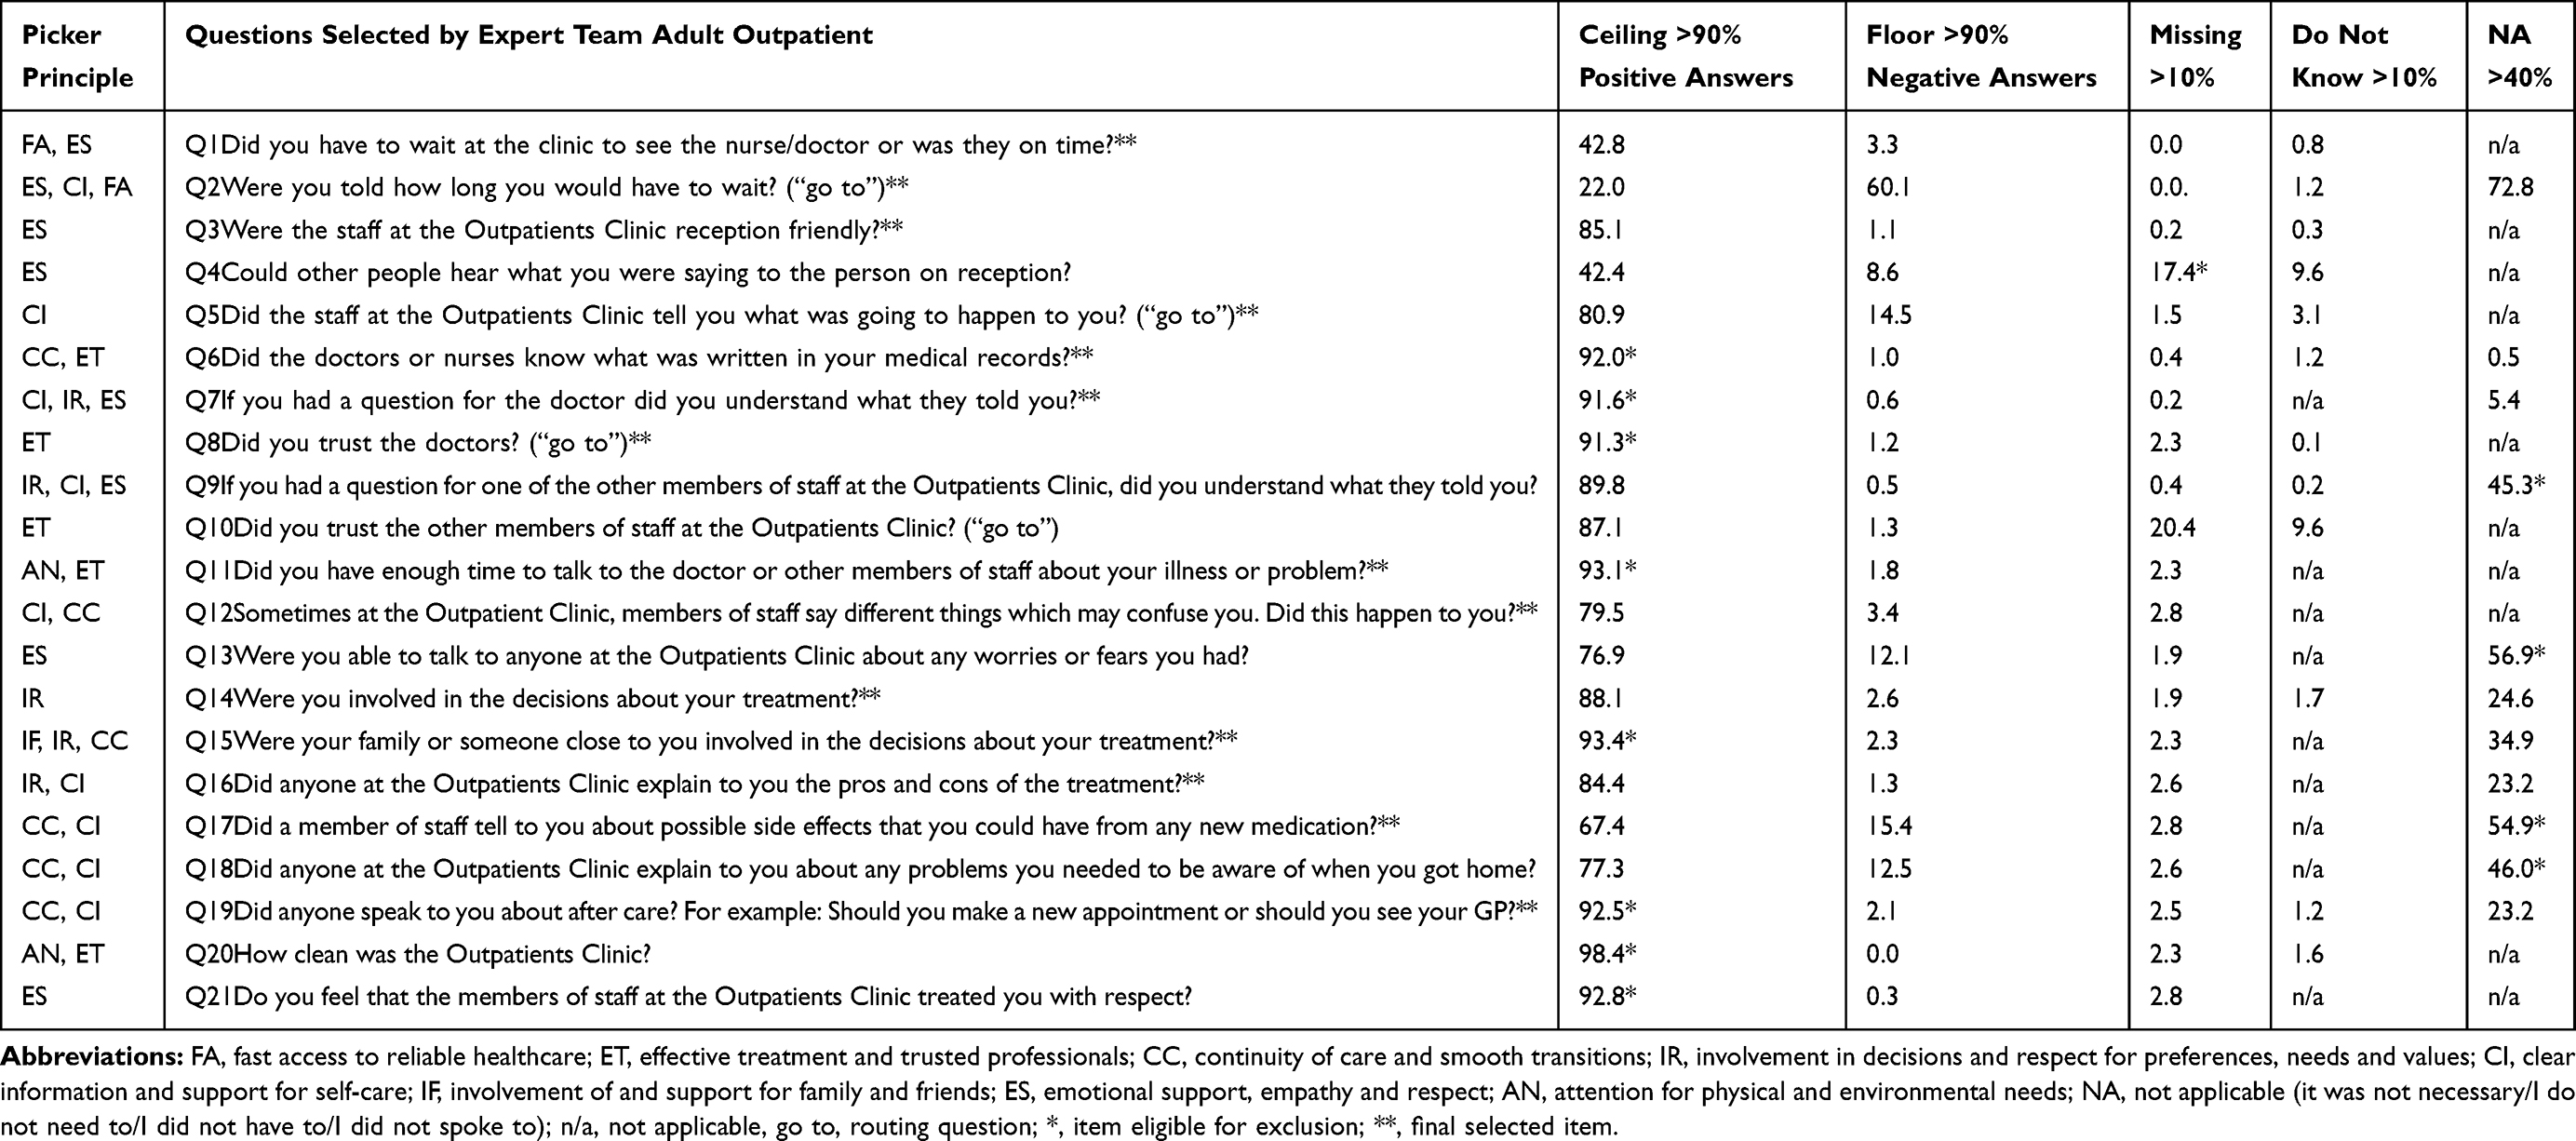 |
Table 2 Statistical Characteristics of Items |
These results have been submitted to the expert panel who, after careful consideration, made a final selection of 14 items (Figure 2). This selection was based on the statistical characteristics of items (Table 2), an even representation of the 8 principles of PCC, and the advice of users (healthcare professionals and patients). To illustrate, the item Q7 “If you had a question for the doctor did you understand what they told you?” was eligible for exclusion based on a ceiling score of 91.6%. However, the client council strongly advised to include this item since comprehensibility of healthcare was considered a key prerequisite for patient-centered care. They considered understandable information as crucial for the assessment of quality of care in the long term. Item Q15 “Were your family or someone close to you involved in the decisions about your treatment?” was included despite of a 93.4% ceiling score, as it was a serious issue for the expert panel and was considered to be the best representation of the Picker principle “family involvement”. A final illustration of how the qualitative weighting of items influenced the final selection was the inclusion of item Q17 “Did a member of staff tell to you about possible side effects that you could have from any new medication?”. Even though 54.9% of respondents indicated they had not received new medication, which made the item eligible for exclusion, it was decided to include. Medication is an important topic considering the substantial risk of adverse events through incorrect use of medication. There is considerable room for improvement, only 67.4% of respondents received adequate information about side-effects and 15.4% of the respondents did not receive any information about side-effects at all.
As a final consideration, the Spearman’s inter-item correlation coefficients of the final selection of items were calculated (Table 3). The correlations above the threshold of 0.7 were flagged. This was the case for “Q14 Were you involved in the decisions about your treatment?” and “Q15 Was your family or someone close to you involved in the decisions about your treatment?” with a correlation of 0.708. Despite the strong relation between these items, the expert panel decided not to remove either of the questions due to their various meaning; 1) involvement in decisions and 2) family involvement.
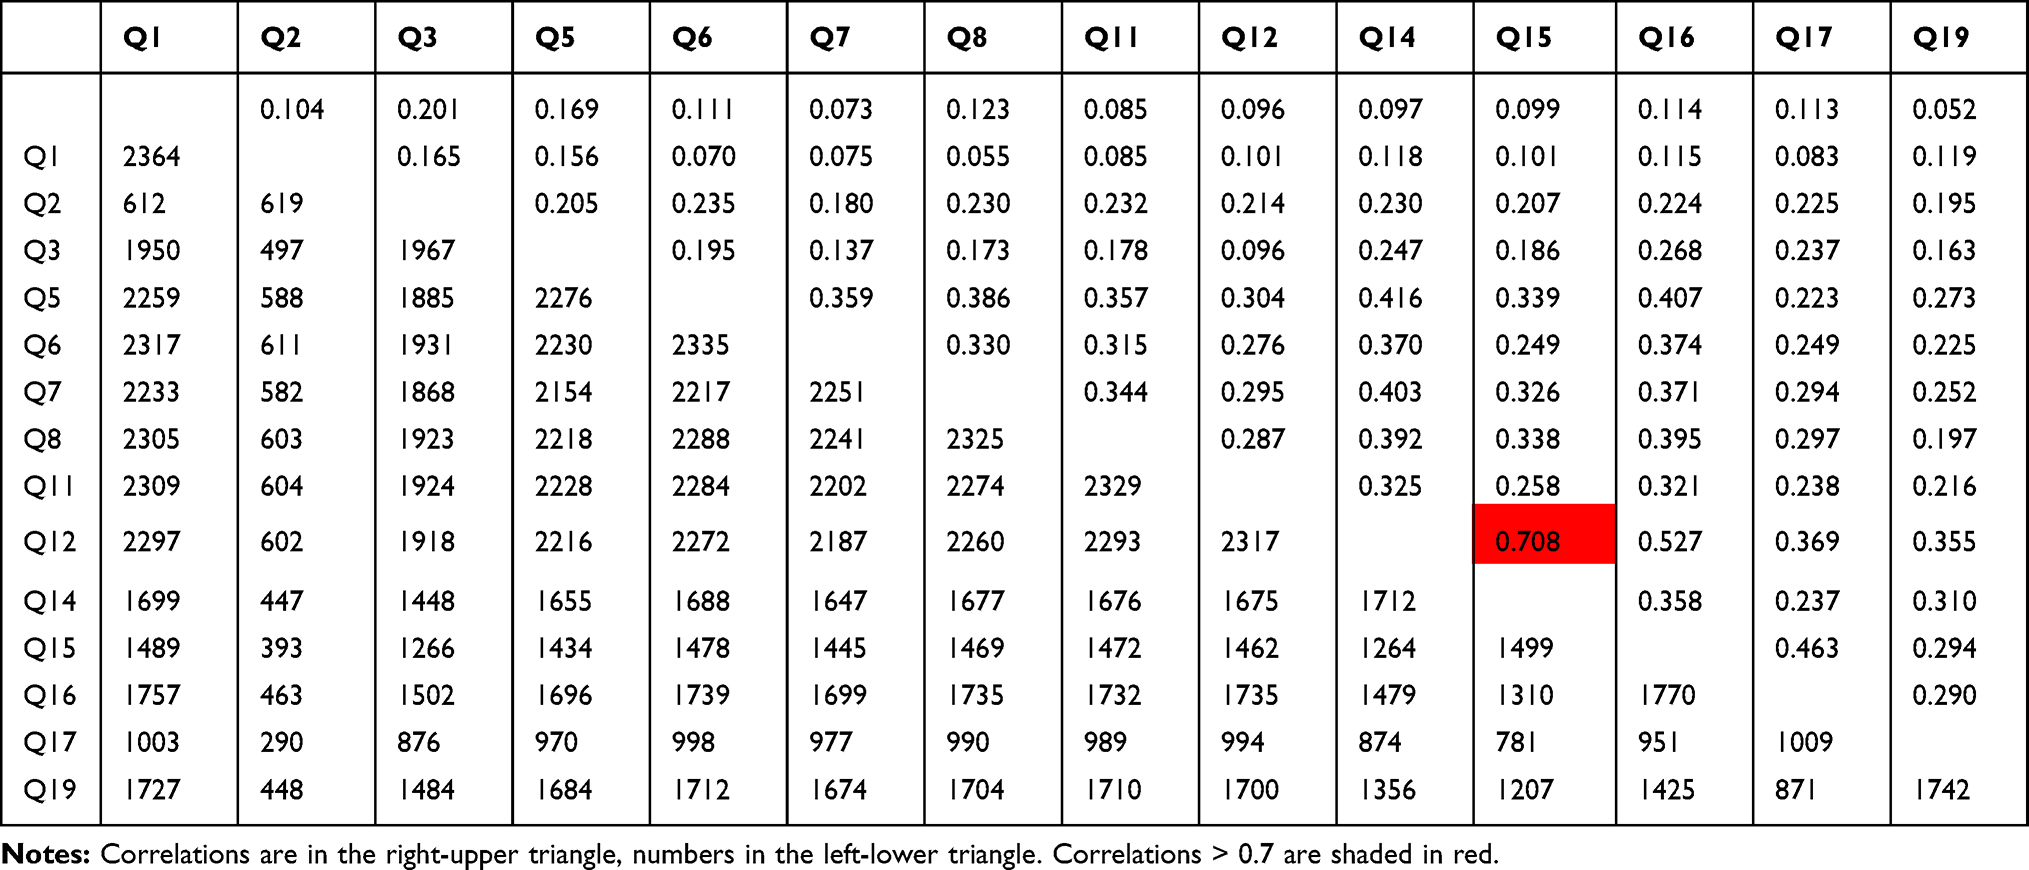 |
Table 3 Spearman Correlation Coefficients Between Final Selected Items PEM Adult Outpatient |
PEM Adult Outpatient: Member Checking
The final selection of 14 questions has been evaluated by healthcare professionals and patients (former interviewees) for discussion and were approved. It was discussed whether the final version met the predetermined criteria such as inclusion of each of the 8 principles of PCC, language level B1, a limited length of the questionnaire, the potential to improve quality and whether all advices for adjustments of stakeholders were processed satisfactorily. The final selection was translated back into English and approved by Picker Institute.
Discussion
Patient Experience Monitors (PEMs) were specifically developed for hospital patients with a wide range of literacy levels, while enabling the potential for QI. We want to give the largest possible number of patients the opportunity to share their experiences. A concise questionnaire with accessible language is an important first step. We described the process of adaptation so that colleagues outside the Netherlands could do likewise in their own language.
We aimed to develop questionnaires appropriate for patients with a wide range of literacy levels. Population statistics on educational levels in the Netherlands show that 30.4% has a low education.33 Although education and literacy are different entities, there is a strong positive relation between them.34 As such, we reached both lower and higher educated patients, however we should also acknowledge that lower educated patients (21.3%) are still substantially under-represented. Other studies also found that lower educated people represent the largest group of survey non-respondents.35 However, we also expect this non-response to be related to the method of administration (e-mail). Although the method of administration in the cognitive interview did not cause a problem for lower educated participants, studies on the relationship between health literacy and the use of health information technology shows that lower educated people have a lack of information technology skills.36 Notably, lower health literate patients are less likely to use information technology which is positively associated with trust in health care.37 Accordingly, we will further investigate possible response bias to facilitate extra participation of those with a lower education level.
The provisional selection of approximately 21 items was reduced to 14 items by evaluating relevance, ceiling effects or missing answers in the first place. Also, an expert panel followed a theory-driven approach for the definitive enrolment of items. Methodologically, a common approach is to administer a questionnaire and select items using principle component analysis (PCA) and item response theory (IRT).29,30 With data from Picker Institute original questionnaires we probably could have more easily investigated by Principle Component Analysis or Item Response Theory which item per Picker principle is best to select. However, we did not want to burden patients unnecessarily with the initially long questionnaires of 67 to 87 items. We also expected that these long questionnaires would affect the response rate negatively. Thereby, selecting entirely at statistics obtains items which can be improved on in theory, but may be of little importance for clinical practice (patients or healthcare providers). In practice, a poorly scoring item in statistics can be a key condition for a good experience.
A selected item about privacy was “Could other people hear what you were saying to the person at reception?” This item was removed for final selection based on 17.4% missing values. This could be explained by the fact that the pilot hospital had recently switched to new self-registration desks. This and the aforementioned examples indicate that the location of the pilot study determines which items ultimately prove relevant and that the choice of conducting the pilot at merely three departments of one hospital influences the final results. We also acknowledge that some patients of neurology, surgery and ear-nose-throat (ENT) departments could not fill in the questionnaires due to cognitive problems or other severe diseases which is, among other unit non-response factors, a known problem of PREMS.38 Furthermore, the questionnaires were developed with the input of quality advisors from several university medical centers, the selected questions cover all 8 principles of PCC and represent the patients journey of care, with specific attention for QI. Future studies are required to examine whether the questionnaires are suitable for QI.
Conclusion
Based on Picker Institute Questionnaires, two short-form questionnaires were designed, called Patient Experience Monitor (PEM): PEM Adult Inpatient and PEM Adult Outpatient. PEMs are short and valid questionnaires specifically developed to measure patient experiences of hospital patients with a wide range of literacy levels. Acceptance of the questionnaires for both lower and higher educated patients are confirmed by usability tests. The respondents of the pilot study represent both groups. To enable the potential for quality improvement, the developed questionnaires should not be seen as static, but as a dynamic entity and part of a continuous effort to evaluate and improve patient experiences. The set of questions are constantly liable to changes in healthcare and patient expectations. Annual analysis of survey results with respect to (new) needs of users should lead to improvement of the questionnaire by going over the same cycle (Figure 1). Future studies are needed to examine the usability of these new questionnaires for literacy levels and quality improvement.
Acknowledgments
The authors wish to thank all interviewees for their interest, contribution and time, and Hester Wessels, Nicole van der Eem, Barbara Sibbles and Vivi Buijs for their input in the expert panels. Special thanks to Elise Barendse, Karin Bakker, Pia Gutierrez Zarate and Ilona Gritter for their efforts in data collection, Ko Hagoort and Marjolijn van Leeuwen for translating and adapting the original questions and Joanne Oversier for back translating the questionnaires and editing the text.
Funding
This work was supported by the Dutch Federation of University Medical Centers (NFU) within the program “Sturen op Kwaliteit” of the Citrienfonds under guidance of the NFU consortium Quality of Care.
Disclosure
Jan A Hazelzet reports grants from the Federation of Dutch University Medical Centers outside the submitted work. The authors have no conflict of interest that could have influenced this paper.
References
1. Bowie P, McNab D, Ferguson J, et al. Quality improvement and person-centredness: a participatory mixed methods study to develop the ‘always event‘ concept for primary care. BMJ Open. 2015;5(4):e006667. doi:10.1136/bmjopen-2014-006667
2. Greene SM, Tuzzio L, Cherkin D. A framework for making patient-centered care front and center. Perm J. 2012;16(3):49.
3. Institute of Medicine. Crossing the Quality Chasm: A New Health System for the 21st Century. National Academy Press; 2001.
4. Bastemeijer CM, Voogt L, van Ewijk JP, Hazelzet JA. What do patient values and preferences mean? A taxonomy based on a systematic review of qualitative papers. Patient Educ Couns. 2017;100(5):871–881. doi:10.1016/j.pec.2016.12.019
5. Sackett DL, Rosenberg WM, Gray JM, Haynes RB, Richardson WS. Evidence Based Medicine: What It is and What It Isn’t. British Medical Journal Publishing Group; 1996.
6. Shaller D. Patient-Centered Care: What Does It Take? Commonwealth Fund New York; 2007.
7. Loiselle CG, Howell D, Nicoll I, Fitch M. Toward the development of a comprehensive cancer experience measurement framework. Supportive Care Cancer. 2019;27(7):2579–2589. doi:10.1007/s00520-018-4529-y
8. Doyle C, Lennox L, Bell D. A systematic review of evidence on the links between patient experience and clinical safety and effectiveness. BMJ Open. 2013;3(1):e001570. doi:10.1136/bmjopen-2012-001570
9. De Silva D. Measuring Patient Experiences. England: Health Foundation; 2013.
10. Beattie M, Murphy DJ, Atherton I, Lauder W. Instruments to measure patient experience of healthcare quality in hospitals: a systematic review. Syst Rev. 2015;4(1):97. doi:10.1186/s13643-015-0089-0
11. Shaw A, Ibrahim S, Reid F, Ussher M, Rowlands G. Patients’ perspectives of the doctor–patient relationship and information giving across a range of literacy levels. Patient Educ Couns. 2009;75(1):114–120. doi:10.1016/j.pec.2008.09.026
12. Bo A, Friis K, Osborne RH, Maindal HT. National indicators of health literacy: ability to understand health information and to engage actively with healthcare providers-a population-based survey among Danish adults. BMC Public Health. 2014;14(1):1095.
13. Willis GB, Artino JAR. What Do Our Respondents Think We’re Asking? Using Cognitive Interviewing to Improve Medical Education Surveys. J Grad Med Educ. 2013;5(3):353–356. doi:10.4300/JGME-D-13-00154.1
14. Sahlqvist S, Song Y, Bull F, Adams E, Preston J, Ogilvie D. Effect of questionnaire length, personalisation and reminder type on response rate to a complex postal survey: randomised controlled trial. BMC Med Res Methodol. 2011;11(1):62. doi:10.1186/1471-2288-11-62
15. Edwards P, et al. Increasing response rates to postal questionnaires: systematic review. BMJ. 2002;324(7347):1183. doi:10.1136/bmj.324.7347.1183
16. Galesic M, Bosnjak M. Effects of questionnaire length on participation and indicators of response quality in a web survey. Public Opin Q. 2009;73(2):349–360. doi:10.1093/poq/nfp031
17. Davies E. Hearing the patient’s voice? Factors affecting the use of patient survey data in quality improvement. Quality and Safety in Health Care. 2005;14(6):428–432. doi:10.1136/qshc.2004.012955
18. Patwardhan A, Spencer S. Are patient surveys valuable as a service-improvement tool in health services? An overview. Journal of Healthcare Leadership. 2012;4:33–46. doi:10.2147/JHL.S23150
19. Barry MJ, Edgman-Levitan S. Shared Decision Making — the Pinnacle of Patient-Centered Care. N Eng J Med. 2012;366(9):780–781. doi:10.1056/NEJMp1109283
20. Epstein RM, Street RL. The values and value of patient-centered care. The Annals of Family Medicine. 2011;9(2):100–103. doi:10.1370/afm.1239
21. Picker Institute Europe. The eight principles of Patient-Centered Care. http://www.picker.org/about-us/.
22. Goldstein E, Farquhar M, Crofton C, Darby C, Garfinkel S. Measuring Hospital Care from the Patients‘ Perspective: an Overview of the CAHPS® Hospital Survey Development Process. Health Serv Res. 2005;40(6p2):1977–1995. doi:10.1111/j.1475-6773.2005.00477.x
23. Jenkinson C. The Picker Patient Experience Questionnaire: development and validation using data from in-patient surveys in five countries. Int J Quality Health Care. 2002;14(5):353–358. doi:10.1093/intqhc/14.5.353
24. Mira JJ, Nuño-Solinís R, Guilabert-Mora M, et al. Development and validation of an instrument for assessing patient experience of chronic illness care. Int J Integr Care. 2016;16(3):3. doi:10.5334/ijic.2443
25. Patwardhan A, Patwardhan P. Are consumer surveys valuable as a service improvement tool in health services? A critical appraisal. Int J Health Care Qual Assur. 2009;22(7):670–685. doi:10.1108/09526860910995010
26. Coulter A, Locock L, Ziebland S, Calabrese J. Collecting data on patient experience is not enough: they must be used to improve care. BMJ. 2014;348(mar26 1):g2225. doi:10.1136/bmj.g2225
27. Bastemeijer CM, Boosman H, van Ewijk H, Verweij LM, Voogt L, Hazelzet JA. <p>Patient experiences: a systematic review of quality improvement interventions in a hospital setting. <![CDATA[Patient Related Outcome Measures]]>. 2019;10:157. doi:10.2147/PROM.S201737
28. TVdV H. Kees & Jansen, Harrie. The Three-Step Test-Interview (TSTI): an observation-based method for pretesting self-completion questionnaires. Surv Res Methods. 2008;2:143–150.
29. Fayers PM, Hand DJ. Causal variables, indicator variables and measurement scales: an example from quality of life. J Royal Statistical Soc. 2002;165(2):233–253. doi:10.1111/1467-985X.02020
30. Terwee CB, Bot SDM, de Boer MR, et al. Quality criteria were proposed for measurement properties of health status questionnaires. J Clin Epidemiol. 2007;60(1):34–42. doi:10.1016/j.jclinepi.2006.03.012
31. Birt L, Scott S, Cavers D, Campbell C, Walter F. Member checking: a tool to enhance trustworthiness or merely a nod to validation? Qual Health Res. 2016;26(13):1802–1811. doi:10.1177/1049732316654870
32. Picker institute Europe Generic Survey Adaptation Guidance_AT_v1.11_210817. 2017.
33. CBS-Statline. Population; Educational Level; Gender, Age and Migration Background; 2020.
34. Van Der Heide I, Wang J, Droomers M, Spreeuwenberg P, Rademakers J, Uiters E. The relationship between health, education, and health literacy: results from the Dutch Adult Literacy and Life Skills Survey. J Health Commun. 2013;18(sup1):172–184. doi:10.1080/10810730.2013.825668
35. Korkeila K, Suominen S, Ahvenainen J, et al. Non-response and related factors in a nation-wide health survey. Eur J Epidemiol. 2001;17(11):991–999. doi:10.1023/A:1020016922473
36. Kim H, Xie B. Health literacy in the eHealth era: a systematic review of the literature. Patient Educ Couns. 2017;100(6):1073–1082. doi:10.1016/j.pec.2017.01.015
37. Mackert M, Mabry-Flynn A, Champlin S, Donovan EE, Pounders K. Health literacy and health information technology adoption: the potential for a new digital divide. J Med Internet Res. 2016;18(10):e264. doi:10.2196/jmir.6349
38. Elliott MN, Edwards C, Angeles J, Hambarsoomians K, Hays RD. Patterns of unit and item nonresponse in the CAHPS® Hospital Survey. Health Serv Res. 2005;40(6p2):2096–2119. doi:10.1111/j.1475-6773.2005.00476.x
 © 2020 The Author(s). This work is published and licensed by Dove Medical Press Limited. The
full terms of this license are available at https://www.dovepress.com/terms
and incorporate the Creative Commons Attribution
- Non Commercial (unported, 3.0) License.
By accessing the work you hereby accept the Terms. Non-commercial uses of the work are permitted
without any further permission from Dove Medical Press Limited, provided the work is properly
attributed. For permission for commercial use of this work, please see paragraphs 4.2 and 5 of our Terms.
© 2020 The Author(s). This work is published and licensed by Dove Medical Press Limited. The
full terms of this license are available at https://www.dovepress.com/terms
and incorporate the Creative Commons Attribution
- Non Commercial (unported, 3.0) License.
By accessing the work you hereby accept the Terms. Non-commercial uses of the work are permitted
without any further permission from Dove Medical Press Limited, provided the work is properly
attributed. For permission for commercial use of this work, please see paragraphs 4.2 and 5 of our Terms.