Back to Journals » International Journal of Nanomedicine » Volume 12
Parallel comparative studies on toxicity of quantum dots synthesized and surface engineered with different methods in vitro and in vivo
Authors Liu F, Ye W, Wang J, Song F, Cheng Y, Zhang B ![]()
Received 21 March 2017
Accepted for publication 7 June 2017
Published 19 July 2017 Volume 2017:12 Pages 5135—5148
DOI https://doi.org/10.2147/IJN.S137637
Checked for plagiarism Yes
Review by Single anonymous peer review
Peer reviewer comments 4
Editor who approved publication: Dr Linlin Sun
Fengjun Liu1,* Wen Ye1,* Jun Wang2 Fengxiang Song1 Yingsheng Cheng3 Bingbo Zhang2
1Department of Radiology, Shanghai Public Health Clinical Center, 2Institute of Photomedicine, Shanghai Skin Disease Hospital, The Institute for Biomedical Engineering & Nano Science, Tongji University School of Medicine, 3Department of Radiology, Shanghai Sixth People’s Hospital, Shanghai Jiao Tong University, Shanghai, China
*These authors contributed equally to this work
Abstract: Quantum dots (QDs) have been considered to be promising probes for biosensing, bioimaging, and diagnosis. However, their toxicity issues caused by heavy metals in QDs remain to be addressed, in particular for their in vivo biomedical applications. In this study, a parallel comparative investigation in vitro and in vivo is presented to disclose the impact of synthetic methods and their following surface modifications on the toxicity of QDs. Cellular assays after exposure to QDs were conducted including cell viability assessment, DNA breakage study in a single cellular level, intracellular reactive oxygen species (ROS) receptor measurement, and transmission electron microscopy to evaluate their toxicity in vitro. Mice experiments after QD administration, including analysis of hemobiological indices, pharmacokinetics, histological examination, and body weight, were further carried out to evaluate their systematic toxicity in vivo. Results show that QDs fabricated by the thermal decomposition approach in organic phase and encapsulated by an amphiphilic polymer (denoted as QDs-1) present the least toxicity in acute damage, compared with those of QDs surface engineered by glutathione-mediated ligand exchange (denoted as QDs-2), and the ones prepared by coprecipitation approach in aqueous phase with mercaptopropionic acid capped (denoted as QDs-3). With the extension of the investigation time of mice respectively injected with QDs, we found that the damage caused by QDs to the organs can be gradually recovered. This parallel comparative investigation suggests that synthetic methods and their resulting surface microenvironment play vital roles in the acute toxicity profiles of QDs. The present study provides updated insights into the fabrication and surface engineering of QDs for their translational applications in theranostics.
Keywords: comparative investigation, amphiphilic polymer, glutathione, mercaptopropionic acid, DNA breakage, surface microenvironment
Introduction
Quantum dots (QDs) have been shown to be promising biological probes for various biomedical applications due to their advantages, in particular their unique spectral properties.1–5 However, the potential hazards of QDs in biomedical fields remain unresolved.6–8 It is, therefore, necessary to evaluate the toxicity of representative QDs prepared by commonly used methods and claim reasonable synthesis routes and surface engineering of QDs for their bioapplications.
Two major QD synthetic methods have been developed, namely the direct synthesis of QDs in the aqueous phase9,10 and the thermal decomposition of precursors at high temperature.11,12 The former method is quite simple and the resulting QDs are often capped by small molecules with thiol groups, while the latter method requires more complicated processing but has better optical properties, size distribution, and morphology. Their surface can be manually enhanced by various chemical compounds for particular applications.
In the recent decade, toxicity studies of QDs have been increasingly reported.13–16 CdTe QDs, synthesized by direct synthesis in the aqueous phase, were found with varying toxicity levels.17 Reports showed that they can induce cell death, cell apoptosis, and DNA damage by releasing cadmium ions (Cd2+) and ROS and accumulating in the liver, kidneys, and spleen in vivo.18,19 The toxicity is largely dependent on surface microenvironment, usually determined by surface ligands.14 The toxicity of QDs, obtained by thermal decomposition of precursors at high temperature, was also found to vary, largely relying on their surface engineering approaches.13,14,20
Previous work has usually been restricted to a particular type of QDs, or a surface modification method. These research reports can hardly inspire them to reach a precise profile of QD toxicity. Consequently, a parallel comparative study on the toxicity of QDs, particularly synthesized and surface engineered with different methods in vitro and in vivo, is urgently required.
In this study, we conducted a parallel comparative study in vitro and in vivo on the toxicity of three representative QDs prepared by two different synthetic routes and with three different surface ligands. Among these three types of QDs, QDs-1 and QDs-2 were synthesized by the thermal decomposition of precursors at high temperature but with different surface engineering processes. QDs-1 was enhanced with an amphiphilic polymer, while QDs-2 was capped with glutathione (GSH) by ligand exchange of the original hydrophobic ligands on the QDs. QDs-3 was prepared by a direct synthesis method in the aqueous phase with mercaptopropionic acid (MPA) capped. Transmission electron microscopy (TEM), cell viability assessment, DNA breakage, ROS receptor generation, and tissue damage were observed to evaluate QDs, toxicity.
Materials and methods
Materials
Cell lines: L02 liver cell line was obtained from the digestive department of the Shanghai Tenth People’s Hospital. The relevant cellular experiments were approved by the Institutional Animal Care and Use Committee of Shanghai Public Health Clinical Center. Comet SOP Kit was purchased from Research Biolab Co, Ltd, Beijing (BR-0904). Anti-ROS antibody (4–6G) was purchased from Abcam (Cambridge, UK). Goat anti rabbit HR conjugate was purchased from Jackson ImmunoResearch (West Grove, PA, USA; 99635). Lysosome Staining Kits – Blue Fluorescence and Green Fluorescence – were purchased from Abcam (ab112135 and ab112136). Alanine Transaminase (ALT) Activity Assay kit was purchased from Cayman Chemical (Ann Arbor, MI, USA; 700260). Annexin V-fluorescein isothiocyanate apoptosis detection kit and propidium iodide were purchased from Sigma-Aldrich Co (St Louis, MO, USA). BALB/C mice were purchased from the Experimental Animal Center of the Chinese Academy of Sciences, Shanghai, China (certificate no 4407207295, specific pathogen free, female).
Preparation of QDs-1, QDs-2, and QDs-3
Available literature was used to synthesize QDs-1,21,22 QDs-2,23 and QDs-3.9 The basic properties of QDs including particle sizes, surface groups, and the atoms contained are provided in Table 1. The concentrations of QDs for toxicity assessment were determined with Cd2+ content measured by inductively coupled plasma mass spectrometry (ICP-MS).
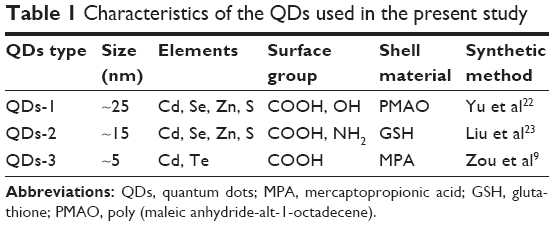 | Table 1 Characteristics of the QDs used in the present study |
In vitro study
Confocal laser scanning microscopy
L02 liver cells were divided into four groups, namely QDs-1 cells group, QDs-2 cells group, QDs-3 cells group, and control cells group. The first three cells groups were, respectively, treated with 40 μmol/L Cd2+ concentration of QDs-1, QDs-2, and QDs-3 for 1 hour and then washed with phosphate-buffered saline (PBS) three times before imaging on the confocal laser scanning microscopy (CLSM) (Nikon TE2000; Nikon Instruments, Melville, NY, USA).
Intracellular ROS measurement
L02 liver cells were divided into four groups. The first three groups were treated with 40 μmol/L Cd2+ concentration of QDs-1, QDs-2, and QDs-3, respectively, for 24 hours. The treated cells and the control cells without QD exposure were transferred onto poly-L-lysine pretreated glass slides. The glass slides were treated in PBS containing 0.25% Triton X-100 for 10 minutes and washed with PBS. The cells were then blocked with 1% bovine serum albumin in PBS for 30 minutes and stained with the primary antibody (ROS; Abcam) in the wet box for 1 hour and then labeled by the secondary antibodies for another 1 hour in dark at room temperature. Afterward, the cells were washed three times with PBS. Finally, they were stained by Hoechst for imaging.
TEM
L02 liver cells were, respectively, treated with 40 μmol/L Cd2+ concentration of QDs-1, QDs-2, and QDs-3 for 24 hours and then fixed by 1.5% glutaraldehyde. The treated cells were sectioned for TEM analysis (JEM1230; JEOL, Tokyo, Japan) at 80 kV. Cells without QD exposure formed the control group.
Comet assay
Single-cell gel electrophoresis (comet assay) was used to investigate the DNA-strand breaking properties of the tested QDs. The assay was performed according to the manufacturer’s protocol with slight modifications as reported previously.24,25 L02 liver cells (1×10⁶/mL) were spread into a 6-well plate and allowed to grow for 48 hours. Subsequently, the cells were treated for 24 hours with QDs-1, QDs-2, and QDs-3 at 40 μmol/L Cd2+ concentration, respectively. Comet images were photographed using fluorescent microscopy (BX-51; Olympus Corporation, Tokyo, Japan) and the comet image analysis was based on the software of Comet Assay IV System (Perceptive Instruments, Bury St Edmunds, UK). The results were parameterized with respect to the intensity of DNA in the comet tail and calculated as the percentage of overall DNA in the respective cell. These quantitative data were derived from at least three independent sets of experiments.
Cytotoxicity assay
A standard cell counting kit-8 (CCK-8) assay was conducted on L02 liver cells to evaluate the in vitro cytotoxicity of QDs-1, QDs-2, and QDs-3. Typically, L02 liver cells (5×10³/well) were seeded into 96-well plates (groups 1–3 for QD experimental groups and control group without QDs); then, the cells were incubated in the culture medium for 24 hours at 37°C under 5% CO2 atmosphere. The culture medium was then removed, and cells were incubated with fresh complete medium containing 100 μL of QDs-1, QDs-2, and QDs-3 at Cd2+ concentrations (8, 40, 200 μmol/L) for 12, 24, 48 hours at 37°C under 5% CO2. Ten microliters of CCK-8 agentia (5 mg/mL) was added to the plates to replace the culture medium, and cells were incubated for further 4 hours. Finally, the OD490 value of each well was measured using a multifunction microplate reader (Infinite M200 Pro; Tecan, Männedorf, Switzerland).
In vivo study
All the animal experimental procedures were performed in conformity with a standard protocol approved by the Institutional Animal Care and Use Committee of Shanghai Public Health Clinical Center. This approval was obtained prior to the commencement of the study.
Body weight and pharmacokinetics of QDs
Female BALB/c mice (4–5 weeks old) were divided into four groups. QDs-1 mice group, QDs-2 mice group, QDs-3 mice group, and the control mice group were, respectively, intravenously injected with QDs-1, QDs-2, QDs-3 (0.0061 μmol/g of Cd2+ mixed in a volume of 100 μL physiologic saline), and physiologic saline through the tail vein (n=6). At varying time points (3 minutes, 6 hours, 12 hours, 24 hours, 48 hours, 4 days, 7 days, 14 days, 30 days, 40 days) after injection, the mice were weighed and assessed for behavioral changes. The main organ tissues including liver, kidney, spleen, stomach, brain, heart samples were collected, and treated with concentrated nitric acid for ICP analysis of Cd2+.
Hematoxylin and eosin (H&E), lysosomes immunohistochemistry, and ALT studies
BALB/c mice were divided into four groups: QDs-1 mice group, QDs-2 mice group, QDs-3 mice group, and the control mice group and were intravenously injected with QDs-1, QDs-2, QDs-3 (0.0061 μmol/g of Cd2+ mixed in a volume of 100 μL PBS), respectively. The liver was removed after exposure to QDs for 3 minutes, 6 hours, 12 hours, 24 hours, 48 hours, 4 days, 7 days, 14 days, and 30 days. Tissue sections were used for H&E staining and lysosome immunohistochemistry assay (Lysosome Staining Kit Blue Fluorescence, ab112135; Abcam). Blood was collected from the orbital sinus for liver function (ALT) measurement. Furthermore, the liver, kidney, spleen, heart, brain, and stomach after 40 days postinjection were removed and embedded in paraffin, and then were sectioned for H&E staining and lysosome immunohistochemistry study (CytoPainter Lysosomal Staining Kit Green Fluorescence, ab112136; Abcam).
Statistical analysis
The methods for statistical analysis are described in the “Results and discussion” section – ALT: repeated measures analysis of variance; pharmacokinetics analysis: analysis of variance of factorial design; MTT: three-factor factorial designs; tail DNA: variance analysis.
Results and discussion
The need and strategy of a parallel comparative study on toxicity of QDs
Parallel comparative studies on the toxicity of QDs, particularly synthesized by different methods and surface modification with different ligands, can provide more objective and precise toxicity profiles of QDs and further contribute to favorable synthetic routes and surface engineering methods, compared with scattered toxicity studies on QDs. Scheme 1 illustrates the main idea of this toxicity study, the cartoon structures of three different QDs, and the involved biological toxicological effects. QDs-1 was fabricated by thermal decomposition approach in organic phase and encapsulated by an amphiphilic polymer, without damage of the original ligands on the QDs.22 QDs-2 was synthesized by the same method as QDs-1, but surface engineered with GSH through ligand exchange of their original ligands on QDs.23,26 QDs-3 was prepared by coprecipitation approach in aqueous phase with MPA capped.9 These three types of QDs have core/shell structures, namely inorganic semiconductor crystalline substances as the core with comparable sizes, and organic layers as the shell with varying sizes. It is worth noting that the shell of QDs-1 is a macromolecule (poly [maleic anhydride-alt-1-octadecene], PMAO), while the shells of QDs-2 and QDs-3 are both small chemical compounds (GSH and MPA, respectively).
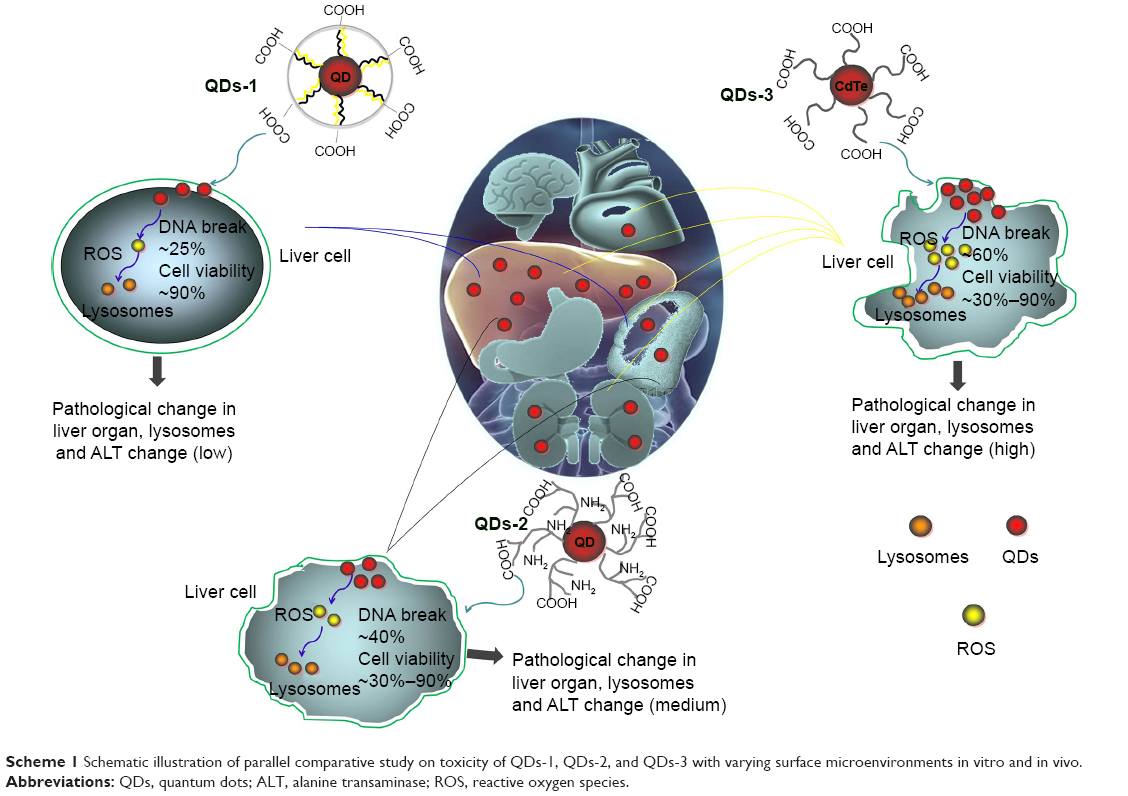 | Scheme 1 Schematic illustration of parallel comparative study on toxicity of QDs-1, QDs-2, and QDs-3 with varying surface microenvironments in vitro and in vivo. |
Liver is the main metabolic organ for most of the circulating nanoparticles, including QDs, owing to the reticuloendothelial system effect.27–29 Therefore, this parallel comparative toxicity study is concentrated on the liver cell (L02) and liver organ (tissue and hepatic function). Other main organs, including spleen, kidneys, stomach, heart, and brain, are also discussed. The in vitro cellular study emphasizes biological effects including cytotoxicity, intracellular ROS imaging, and DNA breakage caused by QDs internalization in L02 liver cells. Furthermore, systemic effects postadministration of QDs are investigated, including hemobiological indices, pharmacokinetics, histological examination, and body weight.
QDs characterizations
Table 1 provides detailed descriptions of each QD. All the particles used in this study have a spherical shape but vary slightly in their sizes. QDs-1 is slightly larger in hydrodynamic diameter (25 nm) than QDs-2 (15 nm) and QDs-3 (5 nm), determined by dynamic light scattering. This size difference is mainly attributed to their capping ligands according to the surface engineering approaches. These three types of QDs have colloidal stability because of negative charges on their surfaces, which favors their biomedical applications.
The Cd element inside the cores is considered highly toxic to biology. That is why QDs are generally encapsulated by organic shells. In this study, three kinds of shells were employed, namely, PMAO, GSH, and MPA. PMAO is a kind of macromolecule, while GSH and MPA are small chemical compounds. The interaction between shell materials and core substances is different in each case. PMAO is coated on the QDs-1 via hydrophobic–hydrophobic interaction,22 while GSH and MPA are capped on the QDs-2 and QDs-3 by means of the affinity of thiol groups with Cd or Zn elements on the QDs.23,26 The coating or capping stability on QDs is considered closely relevant to their toxicity.13,14 Removal of shell materials can expose the core QDs to biological substances.30 This exposure could provide a possibility for etching the core QDs and thus releasing toxic Cd2+, and the escaped shell materials could also be toxic.31
In vitro study
Cellular uptake of QDs
Figure 1 shows all types of QDs can be internalized into L02 liver cells but with varying amounts via endocytosis. MPA-coated QDs (QDs-3) most easily internalize into the cytoplasm, followed by GSH-coated QDs-2 and PMAO-coated QDs (QDs-1). QDs–cell interaction mainly depends on the size, shape, surface charge, ligand property of QDs, and the cell type.32–35 QDs-1 with macromolecule coating have a slightly larger size and exhibit a less internalized amount, compared with QDs-2 and QDs-3 both capped by small chemical compounds with smaller sizes. Previous research also showed that small nanoparticles can be more easily internalized into the cytoplasm.36,37 PMAO is a kind of amphiphilic polymer, which has a large molecular weight (Mn =30,000–50,000). Compared with the small ligands of GSH and MPA, the large structure of PMAO on the surface of QDs-1 can partially block endocytosis.
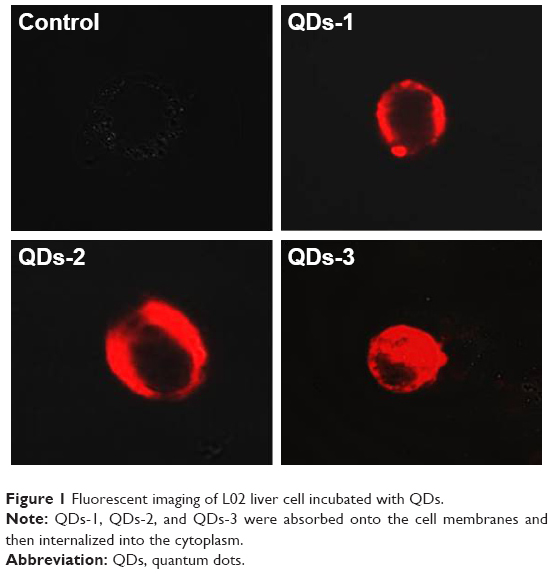 | Figure 1 Fluorescent imaging of L02 liver cell incubated with QDs. |
Oxidative stress toxicity caused by QDs in L02 liver cells
Upon entering cells, QDs would induce oxidative stress toxicity, in which production of ROS and other free radicals can be observed. In this study, L02 liver cells exposed to these three types of QDs for 24 hours were fixed for ROS receptor measurement. As shown in Figure 2A, QDs-2 and QDs-3 can induce more ROS receptor generation, as indicated by the brown color in cells, while less is observed in the cells treated with QDs-1. Excess accumulation of ROS receptor in cells can activate a variety of cellular responses, such as mitochondrial dysfunction, lysosome changes, and damage to the body.38–40
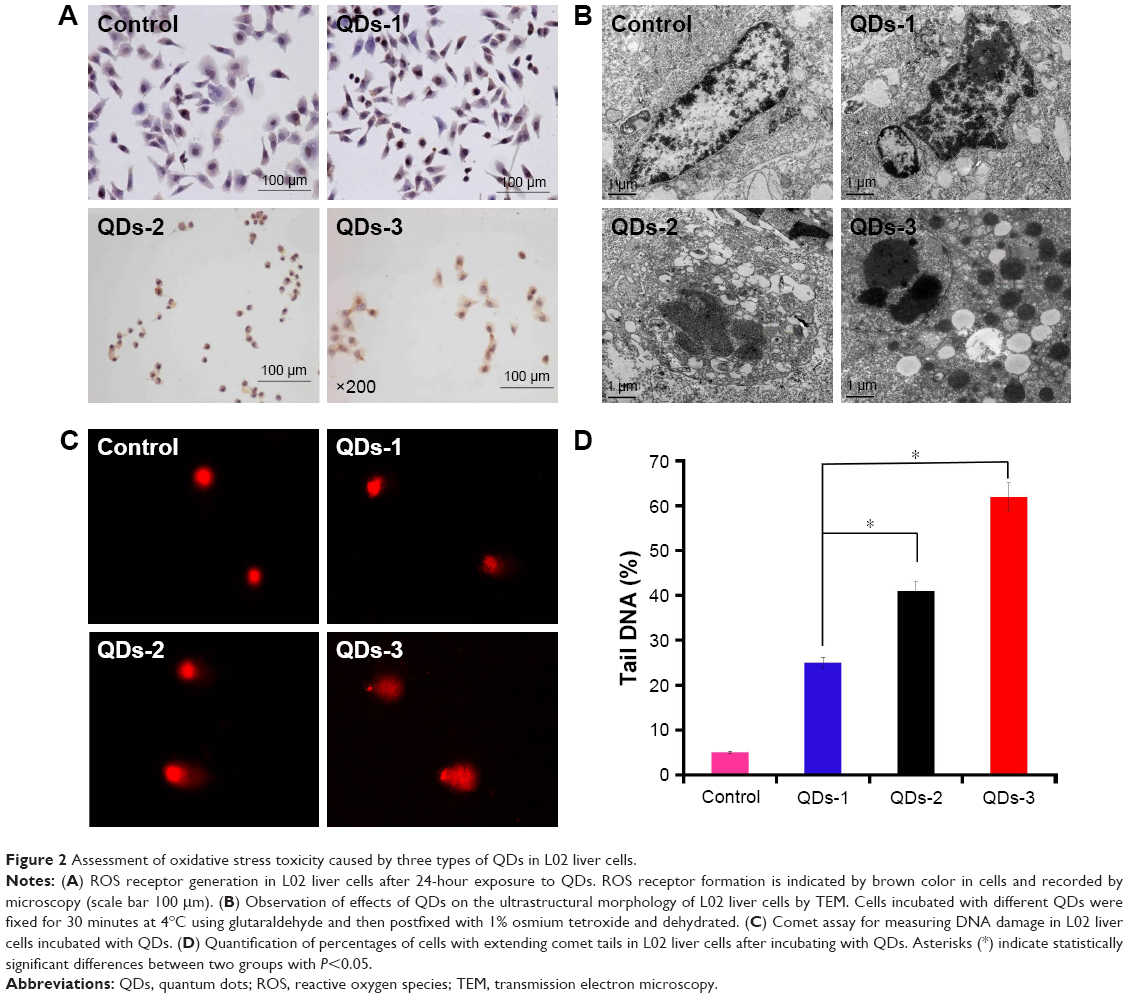 | Figure 2 Assessment of oxidative stress toxicity caused by three types of QDs in L02 liver cells. |
To further compare the cytotoxic morphological changes induced by QDs, the ultrastructure of L02 liver cells exposed/not exposed to QDs was examined by TEM. The addition of QDs-2 and QDs-3 can cause severe cell karyopyknosis, cell cytoplasm edema, and increased lysosomes, while only mild cytoplasm edema is found in the cells treated with QDs-1 (Figure 2B).
The ROS generation induced by QDs can cause DNA damage. In this study, DNA-strand breaks in L02 liver cells were analyzed by comet assay.32,41,42 The intensity of the comet tail relative to the head reflects the number of DNA breaks in a particular cell. Compared with the cells treated with QDs-1, longer comet tails extending toward the anode are observed in the cells exposed to QDs-2 and QDs-3, which is attributed to the DNA-strand breakage and loss of supercoiled structure (Figure 2C). To quantitatively determine the extent of DNA damage, 50 random cells from each gel were selected and the percentage of comet cells with extending tails was calculated. The percentages of L02 liver cells with DNA damage are 40% and 60%, respectively, in the cells exposed to QDs-2 and QDs-3, which are significantly >25% than in the cells exposed to QDs-1 (P<0.05) (Figure 2D). Taken together, these results suggest that QDs-2 and QDs-3 could cause more severe oxidative stress toxicity to L02 liver cells than QDs-1 by induced accumulation of ROS in cells.
Cell viability analysis in L02 liver cells exposure to QDs
CCK-8 assay was performed to study the cytotoxicity of QDs after incubation with cells for 12, 24, and 48 hours. After 12 hours of incubation, QDs-2 showed the highest toxicity to L02 cells with only ~35% viability. And this toxicity is shown in a concentration-dependent manner (Figure 3A). After 24-hour incubation, QDs-3 causes more toxicity to the cells with cell viability of ~45% compared with that after 12-hour incubation (Figure 3B). After 48 hours of incubation, cells exposure to QDs-2 and QDs-3 exhibits much lower cell viabilities than that for 24 hours. Interestingly, with the increase of incubation time, the cell viability of L02 liver cells exposure to QDs-1 remains almost unchanged (Figure 3C). The cell viability results clearly show that QDs-2 and QDs-3 can decrease the cell viability when incubated with a certain degree of dose and exposure time, but QDs-1 hardly affect the cell viability of L02 liver cells. The lower toxicity of QDs-1 could be benefited from the less cellular uptake and proper surface modification. The capped thiol molecules and Cd2+ ions of CdTe QDs could depart and release to the biological tissues, which is very toxic biologically.
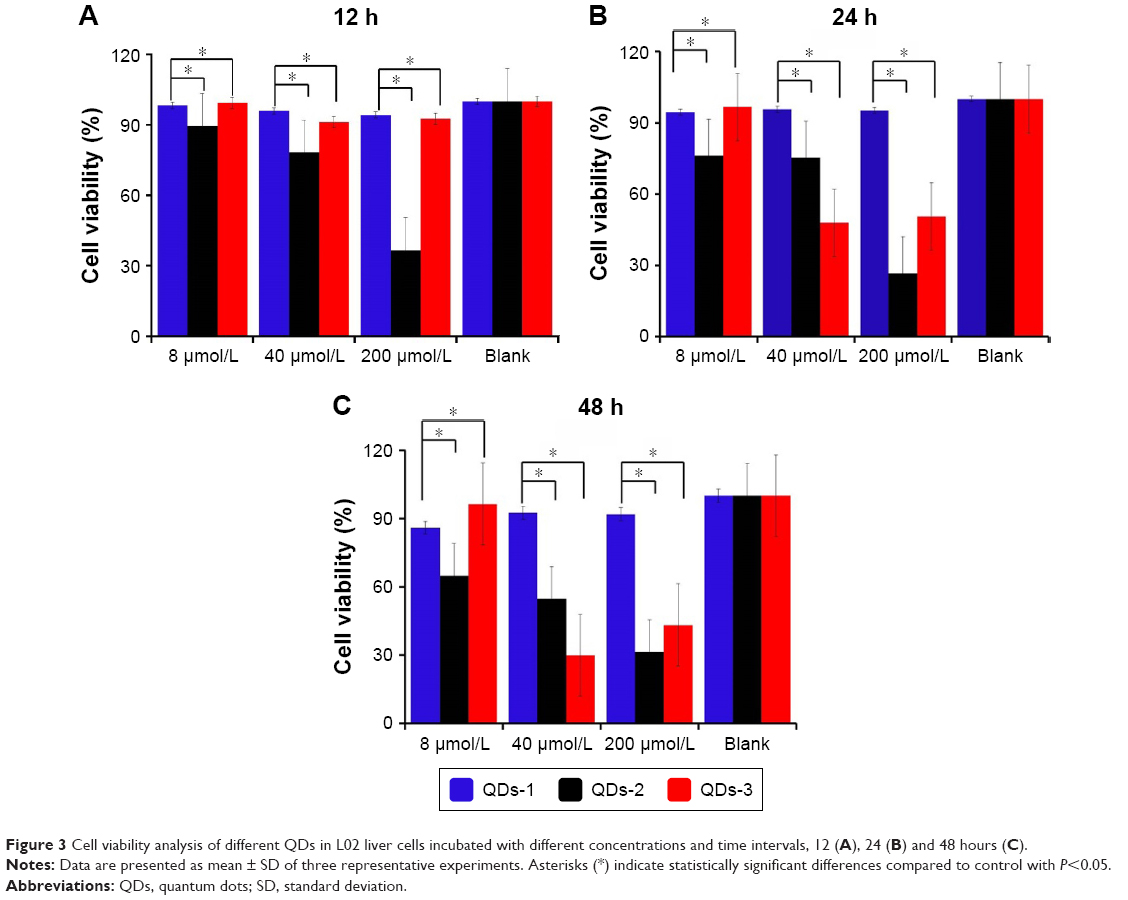 | Figure 3 Cell viability analysis of different QDs in L02 liver cells incubated with different concentrations and time intervals, 12 (A), 24 (B) and 48 hours (C). |
In vivo study
Body weight and pharmacokinetics analysis
Mice were randomly divided into four groups: a control group and three QDs treatment groups. Suspensions of QDs were administered to the mice via intravenous injection, and control mice were treated with normal saline. On different time points (from 3 minutes to the 40th day), the body weight was weighed and recorded (Figure 4). Body weight measurements show no differences between the treatment groups and the control group.
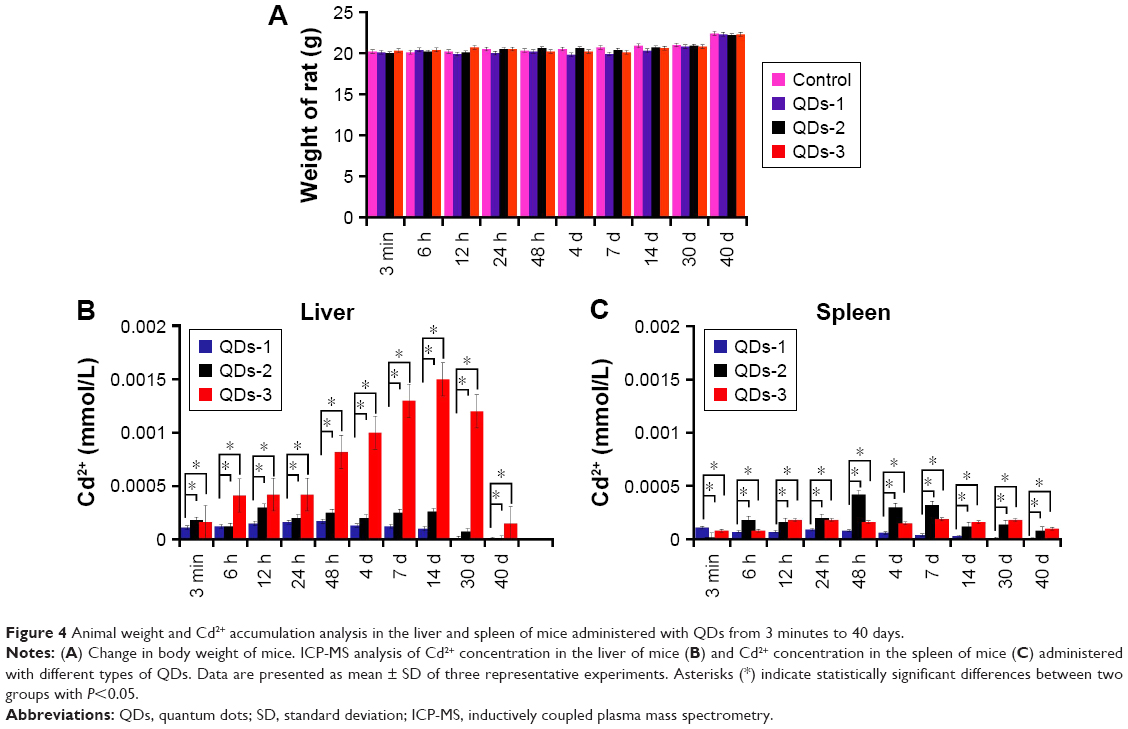 | Figure 4 Animal weight and Cd2+ accumulation analysis in the liver and spleen of mice administered with QDs from 3 minutes to 40 days. |
According to the toxicity analysis in vitro, it is found that the cellular uptake of these three types of QDs varies. In order to further figure out the fate of the injected QDs, the amount of Cd element in the different organs was assessed by using ICP-MS. It was found that liver and spleen are the two preferable sites for capturing QDs, and little Cd is found in other organs including kidneys, stomach, heart, and brain (Figure S1). Cd accumulation in the liver of mice administered with QDs-3 is significantly higher than that with QDs-1 and QDs-2 (P<0.05). Moreover, the metabolism time of QDs-1 (14 days) in the liver is shorter than that of QDs-2 (30 days) and QDs-3 (>40 days) (Figure 4). The accumulation of Cd in spleen is lower than that in the liver, and the metabolism time of QDs-2 and QDs-3 is >40 days. Interestingly, only minimal Cd accumulation of QDs-1 was observed within 2 weeks but disappeared by 30 days. Cd concentrations in the liver and spleen are the lowest in QDs-1 group for most of the time. These results suggest that QDs-1 can be more easily eliminated from organs than QDs-2 and QDs-3 in vivo, which is mainly attributed to the lower uptake of QDs-1 in cells than that of QDs-2 and QDs-3.
Acute liver damage in mice administered with QDs
The liver is the key organ for detoxification of xenobiotics by metabolism and biliary excretion.43 In vitro studies with these three types of QDs demonstrate their varying ability to induce cytotoxicity in L02 liver cells in vitro. In addition, Cd accumulation in liver is found to be higher than that in other organs of mice. Therefore, clearly understanding the toxicity profile of QDs in the liver is critical. The livers from mice administered with QDs at different times were isolated and stained with H&E for liver damage analysis. As shown in Figure 5A, all of the QDs would induce liver damage more or less, and the severity of damage in the different groups is similar in the first 4 days. However, the liver damage caused by QDs-2 and QDs-3 is much severer than that by QDs-1 from the 14th day postinjection, which is consistent with the findings of previous Cd accumulation data in Figure 4.
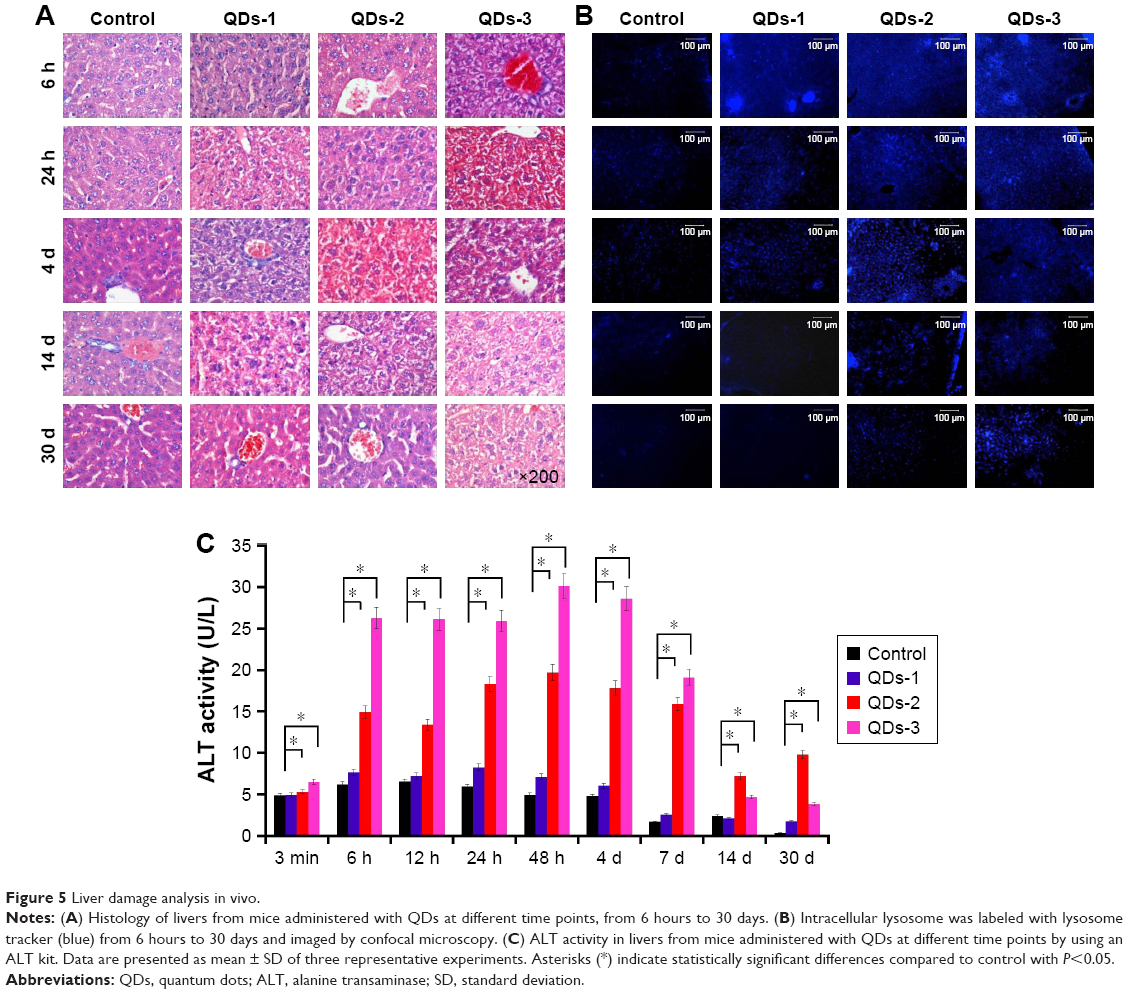 | Figure 5 Liver damage analysis in vivo. |
Lysosomes generation in the liver could reflect the nanoparticle uptake, as previous studies have reported that nanoparticles intend to accumulate in endosome and lysosome.44,45 In this study, a large number of lysosomes is observed in the liver after being treated with the three types of QDs at the beginning. However, it was found that the lysosome production in the QDs-1-treated cell group decreases with time (Figures 5B and S2).
In order to further assess the liver toxicity of QDs, serum biochemical marker (ALT) was measured. ALT activities in QDs-administered mice groups are higher than those in the control group. The increased ALT activity demonstrates that QDs cause liver damage. ALT activity in the QDs-3-treated livers is found to be the highest among these three groups. Moreover, the ALT value increases with time in the three QDs groups in the first 4 days, and then decreases from the 7th day. The ALT activity in QDs-2 is significantly higher than that in QDs-1, but significantly lower than that in QDs-3 (P<0.05, Figure 5C).
Organ damage caused by QDs was also analyzed in the kidneys. No obvious kidney damage was observed in the QDs-treated groups (Figure S3). Taken together, these results indicate that QDs-2 and QDs-3, especially QDs-3, induce severe liver damage, compared to QDs-1.
Long-term toxicity of QDs in organs of mice administered with QDs
As shown in Figure 4, the Cd accumulation in liver and spleen can be detected in 40 days; hence, we investigated the long-term toxicity of QDs in the organs. The mice were injected with these three types of QDs, sacrificed 40 days later, and the organs including liver, spleen, kidneys, stomach, heart, and brain were isolated and fixed for histological analysis. From the H&E staining of organ slides and lysosome immunostaining, no apparent histopathological abnormality was observed in the QDs-treated groups (Figures 6 and S4). Complete and normal acini hepatis and spleen structure without obvious pathologic change are seen in the liver and spleen tissues. We speculate that the liver cells have a powerful capacity of regeneration that helps in the rapid self-repair of the liver tissues.
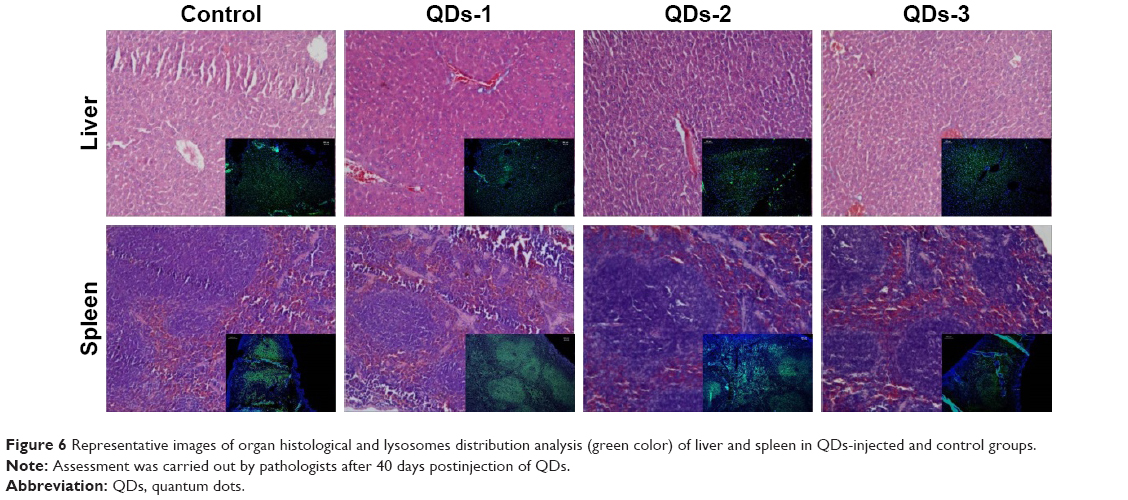 | Figure 6 Representative images of organ histological and lysosomes distribution analysis (green color) of liver and spleen in QDs-injected and control groups. |
Conclusion
A comparative investigation on the toxicity of QDs is reported in this study, particularly involving the impact of synthesis methods and their corresponding surface engineering on the toxicity of QDs in living cells and organs. Three types of QDs (QDs-1/2/3) are designed and synthesized by two commonly used methods, namely, thermal decomposition and coprecipitation approaches. Among these three investigated types of QDs, QDs-1, encapsulated with an amphiphilic polymer, shows the lowest toxicity in both cellular and mice experiments. It was experimentally found that all types of QDs can bind to the membranes of cells and enter into the cytoplasm but their resulting biological effects on cells are quite different. QDs-1 exhibits less adverse effects on cell proliferation and DNA fragmenting, while both QDs-2 and QDs-3 show obvious cell damage, resulting from ROS receptor production and lysosome increase in cells. This phenomenon is also found in the liver tissues of the mice experiment. The polymeric shell on QDs-1 is conducive to reducing the uptake of cells and liver capture and decreasing systemic toxicity in vivo, while QDs-2 and QDs-3 capped by small molecules are found more easily internalizing into the cytoplasm and depositing in liver and as such exerting negative effects on cell viability and organ functions in acute damage. However, with the extension of investigation time, we observed that the damage of the QDs to the organs gradually recovered. This recovery could be benefited from the powerful capacity of regeneration of liver cells that helps rapid self-repair of liver tissues. Based on the evidence observed in this study, it could be claimed that the synthesis method and its surface ligands are closely related to the toxicity profile of QDs. Particularly, compared with small ligands capping, macromolecular encapsulation could be a more suitable route to reduce toxicity of QDs. This finding will provide guidance on the design and development of QDs for their biomedical applications.
Acknowledgments
This work was partially supported by the National Natural Science Foundation of China (81571742, 81371618), Shanghai Innovation Program (14ZZ039), the Shanghai Municipal Science and Technology Commission Program for young scientists (13ZR1459400), the Shanghai Municipal Science and Technology Commission Program (10JC141290) and Program for Outstanding Young Teachers in Tongji University, and the Fundamental Research Funds for the Central Universities.
Disclosure
The authors report no conflicts of interest in this work.
References
Medintz IL, Uyeda HT, Goldman ER, Mattoussi H. Quantum dot bioconjugates for imaging, labelling and sensing. Nat Mater. 2005;4(6):435–446. | ||
Michalet X, Pinaud F, Bentolila L, et al. Quantum dots for live cells, in vivo imaging, and diagnostics. Science. 2005;307(5709):538–544. | ||
Chan WC, Nie S. Quantum dot bioconjugates for ultrasensitive nonisotopic detection. Science. 1998;281(5385):2016–2018. | ||
Weng J, Ren J. Luminescent quantum dots: a very attractive and promising tool in biomedicine. Curr Med Chem. 2006;13(8):897–909. | ||
Li Y, Li Z, Wang X, et al. In vivo cancer targeting and imaging-guided surgery with near infrared-emitting quantum dot bioconjugates. Theranostics. 2012;2(8):769–776. | ||
Su Y, Peng F, Jiang Z, et al. In vivo distribution, pharmacokinetics, and toxicity of aqueous synthesized cadmium-containing quantum dots. Biomaterials. 2011;32(25):5855–5862. | ||
Li YF, Chen C. Fate and toxicity of metallic and metal-containing nanoparticles for biomedical applications. Small. 2011;7(21):2965–2980. | ||
Ghaderi S, Ramesh B, Seifalian AM. Fluorescence nanoparticles “quantum dots” as drug delivery system and their toxicity: a review. J Drug Target. 2011;19(7):475–486. | ||
Zou L, Gu Z, Zhang N, et al. Ultrafast synthesis of highly luminescent green-to near infrared-emitting CdTe nanocrystals in aqueous phase. J Mater Chem. 2008;18(24):2807–2815. | ||
Tian J, Liu R, Zhao Y, Xu Q, Zhao S. Controllable synthesis and cell-imaging studies on CdTe quantum dots together capped by glutathione and thioglycolic acid. J Colloid Interface Sci. 2009;336(2):504–509. | ||
Peng ZA, Peng X. Formation of high-quality CdTe, CdSe, and CdS nanocrystals using CdO as precursor. J Am Chem Soc. 2001;123(1):183–184. | ||
Murray C, Norris DJ, Bawendi MG. Synthesis and characterization of nearly monodisperse CdE (E=sulfur, selenium, tellurium) semiconductor nanocrystallites. J Am Chem Soc. 1993;115(19):8706–8715. | ||
Hoshino A, Hanada S, Yamamoto K. Toxicity of nanocrystal quantum dots: the relevance of surface modifications. Arch Toxicol. 2011;85(7):707–720. | ||
Hoshino A, Fujioka K, Oku T, et al. Physicochemical properties and cellular toxicity of nanocrystal quantum dots depend on their surface modification. Nano Lett. 2004;4(11):2163–2169. | ||
Lanone S, Boczkowski J. Biomedical applications and potential health risks of nanomaterials: molecular mechanisms. Curr Mol Med. 2006;6(6):651–663. | ||
Chong Y, Ma Y, Shen H, et al. The in vitro and in vivo toxicity of graphene quantum dots. Biomaterials. 2014;35(19):5041–5048. | ||
Zhang T, Wang Y, Kong L, Xue Y, Tang M. Threshold dose of three types of quantum dots (QDs) induces oxidative stress triggers DNA damage and apoptosis in mouse fibroblast L929 cells. Int J Environ Res Public Health. 2015;12(10):13435–13454. | ||
Lovrić J, Bazzi HS, Cuie Y, Fortin GR, Winnik FM, Maysinger D. Differences in subcellular distribution and toxicity of green and red emitting CdTe quantum dots. J Mol Med. 2005;83(5):377–385. | ||
Cho SJ, Maysinger D, Jain M, Röder B, Hackbarth S, Winnik FM. Long-term exposure to CdTe quantum dots causes functional impairments in live cells. Langmuir. 2007;23(4):1974–1980. | ||
Hardman R. A toxicologic review of quantum dots: toxicity depends on physicochemical and environmental factors. Environ Health Perspect. 2006;114(2):165–172. | ||
Li JJ, Wang YA, Guo W, et al. Large-scale synthesis of nearly monodisperse CdSe/CdS core/shell nanocrystals using air-stable reagents via successive ion layer adsorption and reaction. J Am Chem Soc. 2003;125(41):12567–12575. | ||
Yu WW, Chang E, Falkner JC, et al. Forming biocompatible and nonaggregated nanocrystals in water using amphiphilic polymers. J Am Chem Soc. 2007;129(10):2871–2879. | ||
Liu W, Choi HS, Zimmer JP, Tanaka E, Frangioni JV, Bawendi M. Compact cysteine-coated CdSe (ZnCdS) quantum dots for in vivo applications. J Am Chem Soc. 2007;129(47):14530–14531. | ||
Yang Y, Jiang L, She Y, et al. Olaquindox induces DNA damage via the lysosomal and mitochondrial pathway involving ROS production and p53 activation in HEK293 cells. Environ Toxicol Pharmacol. 2015;40(3):792–799. | ||
Pelka J, Gehrke H, Esselen M, et al. Cellular uptake of platinum nanoparticles in human colon carcinoma cells and their impact on cellular redox systems and DNA integrity. Chem Res Toxicol. 2009;22(4):649–659. | ||
Zhang P, Han H. Compact PEGylated polymer-caged quantum dots with improved stability. Colloids Surf A Physicochem Eng Asp. 2012;402:72–79. | ||
Zhang B, Li Q, Yin P, et al. Ultrasound-triggered BSA/SPION hybrid nanoclusters for liver-specific magnetic resonance imaging. ACS Appl Mater Interfaces. 2012;4(12):6479–6486. | ||
Kikkeri R, Lepenies B, Adibekian A, Laurino P, Seeberger PH. In vitro imaging and in vivo liver targeting with carbohydrate capped quantum dots. J Am Chem Soc. 2009;131(6):2110–2112. | ||
Schipper ML, Iyer G, Koh AL, et al. Particle size, surface coating, and PEGylation influence the biodistribution of quantum dots in living mice. Small. 2009;5(1):126–134. | ||
Lin W, Walter J, Burger A, et al. A general approach to study the thermodynamics of ligand adsorption to colloidal surfaces demonstrated by means of catechols binding to zinc oxide quantum dots. Chem Mater. 2014;27(1):358–369. | ||
Aldana J, Wang YA, Peng X. Photochemical instability of CdSe nanocrystals coated by hydrophilic thiols. J Am Chem Soc. 2001;123(36):8844–8850. | ||
Uz M, Bulmus V, Alsoy Altinkaya S. The effect of PEG grafting density and hydrodynamic volume on gold nanoparticle–cell interactions: an investigation on cell cycle, apoptosis and DNA damage. Langmuir. 2016;32(23):5997–6009. | ||
Verma A, Stellacci F. Effect of surface properties on nanoparticle–cell interactions. Small. 2010;6(1):12–21. | ||
Zhang B, Wang X, Liu F, Cheng Y, Shi D. Effective reduction of nonspecific binding by surface engineering of quantum dots with bovine serum albumin for cell-targeted imaging. Langmuir. 2012;28(48):16605–16613. | ||
Nel AE, Mädler L, Velegol D, et al. Understanding biophysicochemical interactions at the nano–bio interface. Nat Mater. 2009;8(7):543–557. | ||
Bouchoucha M, Côté M-F, Gaudreault R, Fortin M-A, Kleitz F. Size-controlled functionalized mesoporous silica nanoparticles for tunable drug release and enhanced anti-tumoral activity. Chem Mater. 2016;28(12):4243–4258. | ||
Díaz-Torres R, López-Arellano R, Escobar-Chávez JJ, García-García E, Domínguez-Delgado CL, Ramírez-Noguera P. Effect of size and functionalization of pharmaceutical nanoparticles and their interaction with biological systems. In: Aliofkhazraei M, editor. Handbook of Nanoparticles. Switzerland: Springer; 2016:1041–1060. | ||
Wang L, Hu T, Shen J, et al. Miltirone induced mitochondrial dysfunction and ROS-dependent apoptosis in colon cancer cells. Life Sci. 2016;151:224–234. | ||
Qin Y, Zhou Z-W, Pan S-T, et al. Graphene quantum dots induce apoptosis, autophagy, and inflammatory response via p38 mitogen-activated protein kinase and nuclear factor-κB mediated signaling pathways in activated THP-1 macrophages. Toxicology. 2015;327:62–76. | ||
Jigyasu AK, Siddiqui S, Lohani M, Khan IA, Arshad M. Chemically synthesized CdSe quantum dots inhibit growth of human lung carcinoma cells via ROS generation. EXCLI J. 2016;15:54. | ||
Møller P, Hemmingsen JG, Jensen DM, et al. Applications of the comet assay in particle toxicology: air pollution and engineered nanomaterials exposure. Mutagenesis. 2015;30(1):67–83. | ||
Ma C, White JC, Dhankher OP, Xing B. Metal-based nanotoxicity and detoxification pathways in higher plants. Environ Sci Technol. 2015;49(12):7109–7122. | ||
Yamazaki M, Suzuki H, Sugiyama Y. Recent advances in carrier-mediated hepatic uptake and biliary excretion of xenobiotics. Pharm Res. 1996;13(4):497–513. | ||
Wang H, Agarwal P, Zhao S, Yu J, Lu X, He X. A near-infrared laser-activated “nanobomb” for breaking the barriers to microRNA delivery. Adv Mater. 2016;28(2):347–355. | ||
Wong AS, Mann SK, Czuba E, et al. Self-assembling dual component nanoparticles with endosomal escape capability. Soft Matter. 2015;11(15):2993–3002. |
Supplementary materials
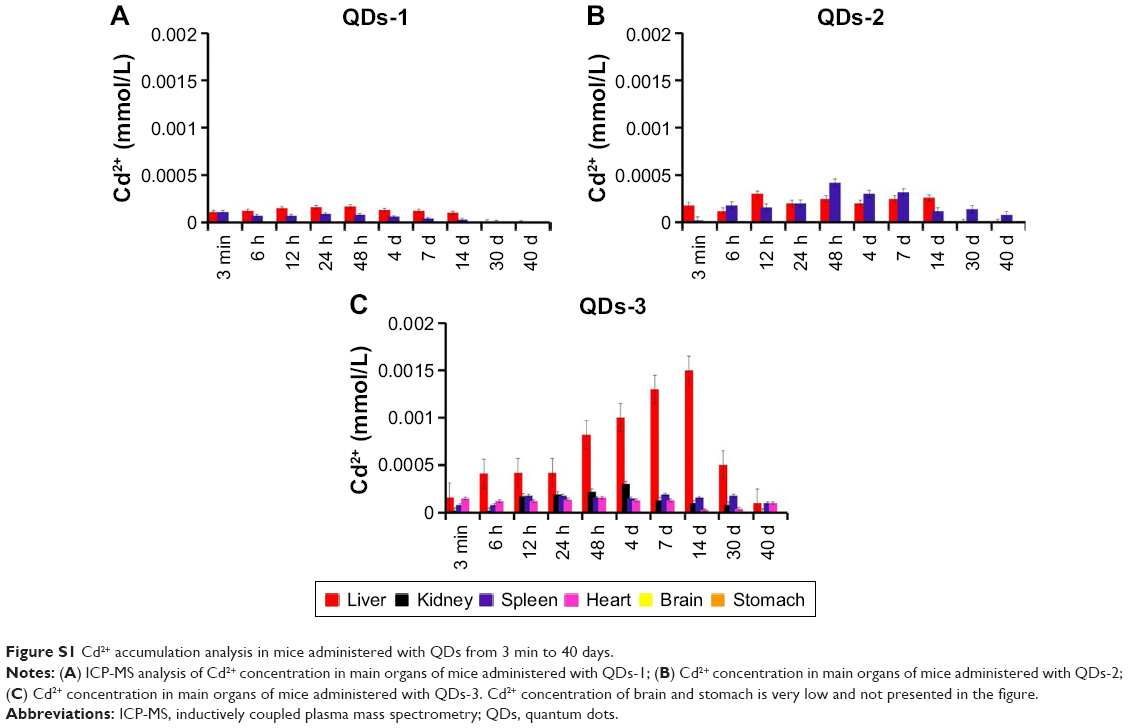 | Figure S1 Cd2+ accumulation analysis in mice administered with QDs from 3 min to 40 days. |
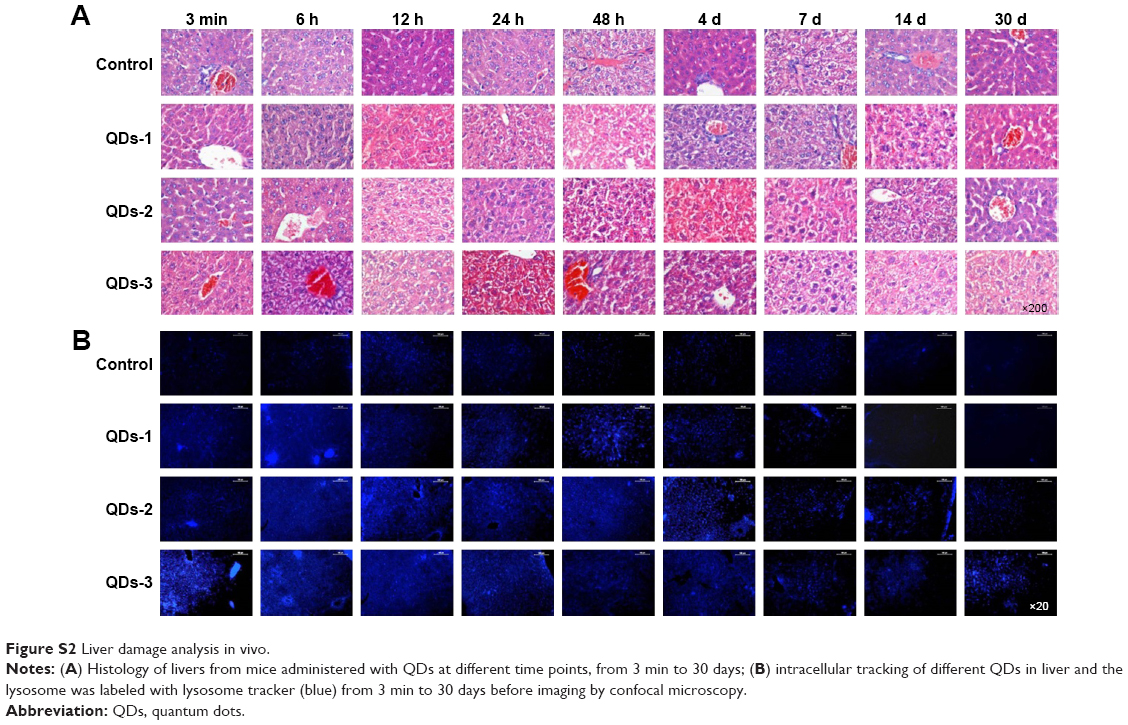 | Figure S2 Liver damage analysis in vivo. |
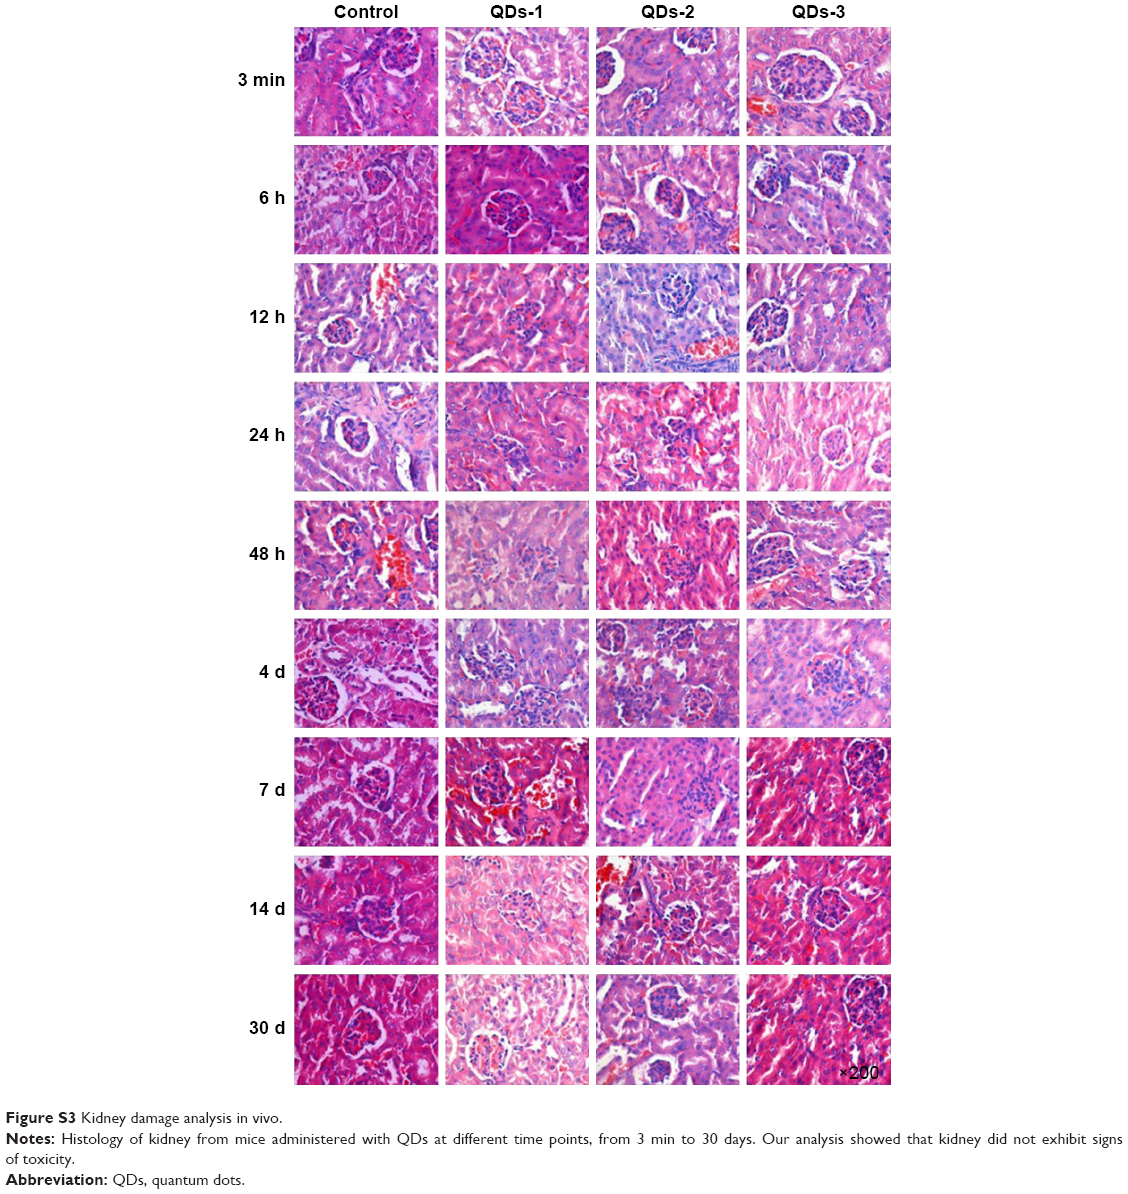 | Figure S3 Kidney damage analysis in vivo. |
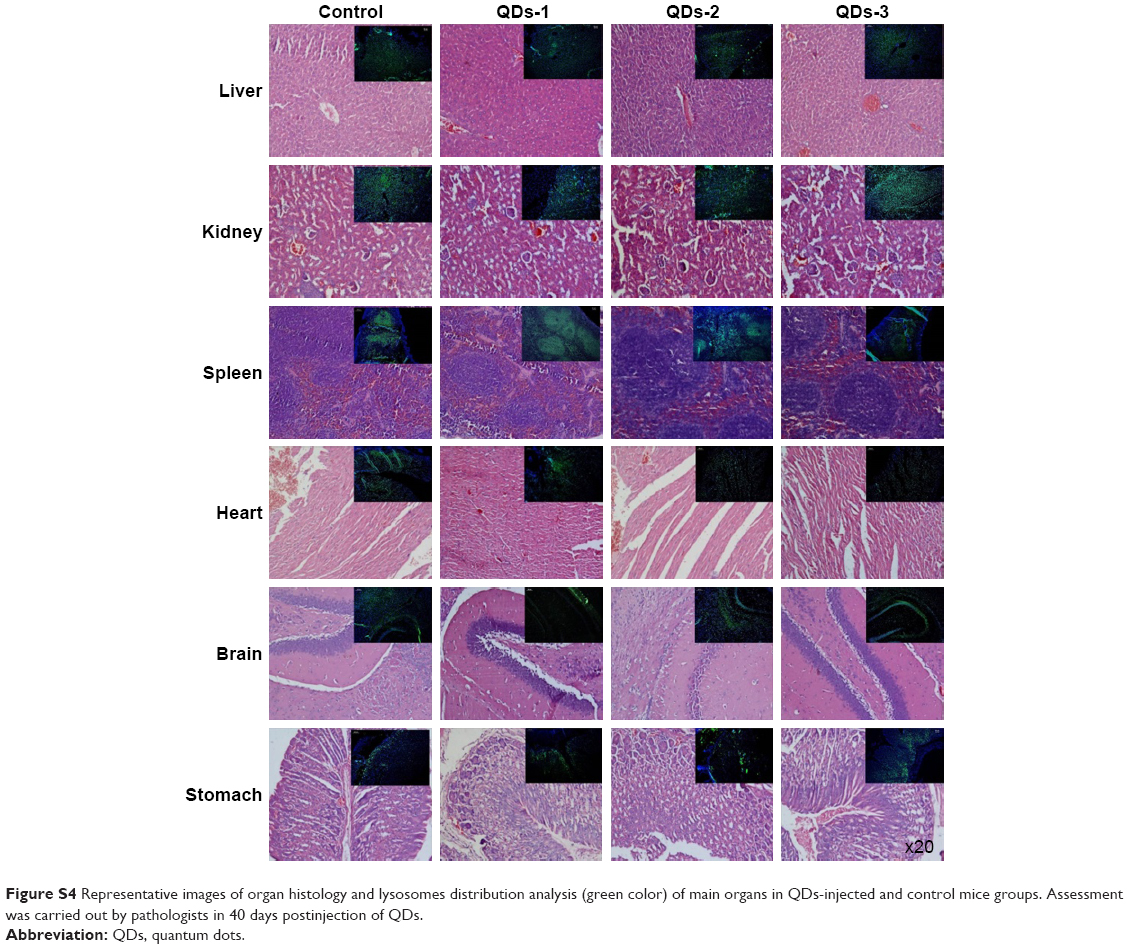 | Figure S4 Representative images of organ histology and lysosomes distribution analysis (green color) of main organs in QDs-injected and control mice groups. Assessment was carried out by pathologists in 40 days postinjection of QDs. |
 © 2017 The Author(s). This work is published and licensed by Dove Medical Press Limited. The
full terms of this license are available at https://www.dovepress.com/terms
and incorporate the Creative Commons Attribution
- Non Commercial (unported, 3.0) License.
By accessing the work you hereby accept the Terms. Non-commercial uses of the work are permitted
without any further permission from Dove Medical Press Limited, provided the work is properly
attributed. For permission for commercial use of this work, please see paragraphs 4.2 and 5 of our Terms.
© 2017 The Author(s). This work is published and licensed by Dove Medical Press Limited. The
full terms of this license are available at https://www.dovepress.com/terms
and incorporate the Creative Commons Attribution
- Non Commercial (unported, 3.0) License.
By accessing the work you hereby accept the Terms. Non-commercial uses of the work are permitted
without any further permission from Dove Medical Press Limited, provided the work is properly
attributed. For permission for commercial use of this work, please see paragraphs 4.2 and 5 of our Terms.