Back to Journals » International Journal of Nanomedicine » Volume 12
Paclitaxel and quercetin nanoparticles co-loaded in microspheres to prolong retention time for pulmonary drug delivery
Authors Liu K, Chen W ![]() , Yang T, Wen B, Ding D, Keidar M, Tang J, Zhang W
, Yang T, Wen B, Ding D, Keidar M, Tang J, Zhang W ![]()
Received 22 July 2017
Accepted for publication 14 October 2017
Published 13 November 2017 Volume 2017:12 Pages 8239—8255
DOI https://doi.org/10.2147/IJN.S147028
Checked for plagiarism Yes
Review by Single anonymous peer review
Peer reviewer comments 3
Editor who approved publication: Dr Linlin Sun
Kang Liu,1 Weijuan Chen,2 Tingting Yang,1 Baofang Wen,1 Dejun Ding,1 Michael Keidar,3 Jinbao Tang,1 Weifen Zhang1
1College of Pharmacy, Weifang Medical University, Weifang, 2Department of Pathology, People’s Hospital of Shouguang, Shouguang, People’s Republic of China; 3Department of Mechanical and Aerospace Engineering, School of Engineering and Applied Science, The George Washington University, Washington, DC, USA
Abstract: High drug resistance, poor water solubility, short half-life, and low local drug concentration are obstacles for successful delivery of chemotherapeutic drugs for lung cancer. A new method involving the use of nanoparticles (NPs) for pulmonary delivery is proposed. However, use of NPs is limited by the particle size range for pulmonary drug delivery considering that NPs cannot be deposited directly into the lungs. NPs polymerized into microspheres (polymeric microspheres, PMs) will result in suitable particle sizes and retain the advantages of nanodrugs after redispersion when applied in pulmonary delivery. We report the development of novel NPs in the form of PMs loaded with paclitaxel (PTX) and quercetin (QUE) double drugs based on the synthesis of oleic acid-conjugated chitosan (OA-CTS) for pulmonary delivery. This approach is aimed toward prolonging PTX retention time in the presence of QUE and bypassing P-glycoprotein drug efflux pumps. NPs loaded with PTX or QUE were prepared with 11% substitution degree using OA-CTS as the carrier by ionic cross-linking method, which NPs loaded with PTX or QUE were used in the preparation of PMs by spray-drying. The diameters of the PMs ranged from 1 to 5 µm which had uniform size range. Scanning electron microscopy showed that PMs were polymers formed by a large number of NPs and readily redispersed (after redispersion, size of NPs ranged between 250 and 350 nm) in water within 1 h. PMs displayed slow-release characteristics at pH 4.5 and 7.4. The in vivo pharmacokinetic and biodistribution studies suggested that PMs exhibit prolonged circulation time and a markedly high accumulation in the lung. The obtained results indicate that PMs can serve as a promising pulmonary delivery system for combined pharmacotherapy using hydrophobic anticancer drugs.
Keywords: paclitaxel, quercetin, oleic acid-conjugated chitosan, nanoparticles, polymeric microspheres, pulmonary delivery
Introduction
Lung cancer is the most common malignant tumor harmful to human health. In particular, the NSCLC accounts for nearly 80% of all lung cancers and presents high mortality and morbidity worldwide.1,2 Moreover, a considerable proportion of NSCLC is terminal and already metastasized at diagnosis.3 Chemotherapy is an established treatment method for patients with lung tumor, particularly for those with advanced NSCLC.4 PTX is currently the first-line drug for NSCLC; the drug can induce apoptosis through promotion of tubulin assembly and inhibition of microtubule depolymerization, and prolong survival and improve symptoms. However, the emergence of multidrug resistance is the greatest obstacle to successfully deliver chemotherapeutic drugs to NSCLC.5,6 P-gp is one of the main causes of multidrug resistance, which can quickly pump out anticancer drugs from cancer cells and then reduce the intracellular drug concentration, thereby limiting the anticancer effect of the drug.7–9 One of the best approaches to overcome this problem is the development of new drug delivery systems for co-delivery of anticancer drugs and P-gp transporter inhibitors.10,11 P-gp transporter inhibitors, such as verapamil and cyclosporine A, have been reported for clinical use, but these present multiple side effects.12 QUE is a natural nontoxic flavonoid present in numerous vegetables and fruits.13 In recent years, QUE has emerged as a therapeutic agent for cancer and inflammatory management.14 QUE has been proven to inhibit lipid peroxidation, capillary permeability, inflammation, and anaphylaxis.15,16 Numerous works showed that QUE in combination with other anticancer drugs exhibits the anticancer activities of the compound and inhibits the expression of the P-gp transporter.17–19 Accordingly, QUE was combined with chemotherapeutics as a sensitization agent for the treatment of cancer.20–23 However, the application of PTX and QUE in chemotherapy is limited by poor water solubility, short half-life, high concentration of solubilizers in their clinical formulations, and large toxic side effects which lead to poor patient compliance.24–27 Therefore, delivery systems adapted to facilitate the targeting of these drugs and improve bioavailability need to be designed.
Several investigations indicated that NPs have attracted attention because of their ability to overcome the disadvantages of conventional antitumor drugs in clinical practice.28 A large number of studies showed that chemotherapeutic drugs delivered in NP form increase the tumor-cell phagocytosis while enhancing aqueous solubility.29 Given their special properties, such as their small size and certain surface characteristics, NPs can protect drugs against enzyme destruction.30 NPs can solubilize hydrophobic anticancer drugs in aqueous condition without a toxic organic solvent or detergent.31 Thus, hydrophobic anticancer drugs could be easily encapsulated into NPs. NPs made of biodegradable polymers are receiving increasing attention.32 CTS is a naturally occurring linear cationic polysaccharide derived from the deacetylation of chitin. CTS has been applied as a drug carrier due to its biomaterial properties.33 Therefore, due to its cationic nature which allows ionic cross-linking with multivalent anions, CTS is particularly suitable for developing NPs, and its availability for group modification occurs through its free amino groups in acidic aqueous solutions.34 In comparison with the unmodified CTS, OA-modified CTS shows improved DL and enhanced stability of NPs because the long hydrophobic chains in CTS could aid the increase in hydrophobic interaction with PTX and QUE.35–37
Recently, pulmonary delivery has been shown to be an increasingly attractive route for chemotherapeutic drugs and increases their accumulation in tumor cells because of the enormous surface area for absorption, highly permeable epithelium compared with the gastrointestinal tract, and avoidance of the first-pass hepatic metabolism.38 However, NPs cannot be deposited directly into the lungs, as they fail to settle in the alveoli and get exhaled out due to their nanometer size range (<1 μm).39 Only particles within the size range of 1–5 μm can be deposited at the bottom of the lung and reach the alveoli.40 Dry powder inhalation of microspheres presents considerable advantages because of special sizes and fluidity. These microsphere attributes allow the drug to be delivered to the action site, and NPs can substantially reduce phagocytosis or mucociliary clearance in the process.41 Therefore, in our study, we combined the advantage of microspheres and NPs. First, two different NPs loaded with drugs were prepared by ionic cross-linking method. Second, a hydrosoluble disintegration agent and a protective agent were added into the NP suspension, which was further spray-dried. The two types of NPs aggregated into microspheres, and the PMs exhibited good redispersibility into individual NPs in aqueous environment (Scheme 1).
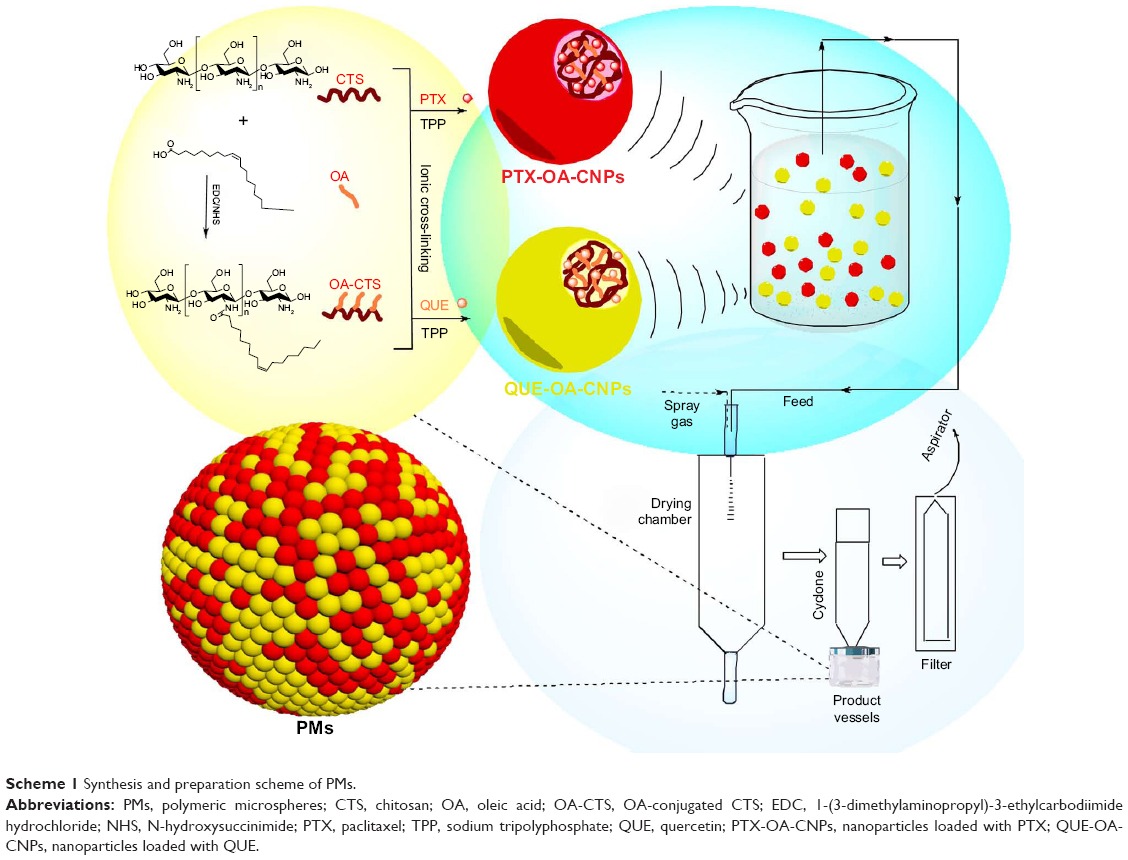 | Scheme 1 Synthesis and preparation scheme of PMs. |
This study is aimed toward developing microspheres co-loaded with PTX and QUE NPs to prolong retention time for pulmonary drug delivery. These PMs are considered to possess massive potential for application in drug delivery because they address several issues, including poor water solubility, short half-life, and double-drug pulmonary administration. PMs can reach a suitable particle size and retain the advantages of nanodrugs after redispersion when applied in pulmonary delivery. In addition, PMs can prolong drug release time and increase the retention time of PTX in the lung because QUE could inhibit the expression of the P-gp transporter and improve the sensitivity of the body to PTX. The PMs were designed to develop a novel double-DL, pulmonary sustained-release carrier that increases retention time of PTX in plasma and the lung.
Materials and methods
Materials
PTX (98.4% purity) was purchased from Shanghai Yuanye Bio-Technology Co., Ltd (Shanghai, People’s Republic of China). QUE (98.9% purity) was purchased from Hubei Shengtian Hengchuang Biotechnology Co., Ltd (Hubei, People’s Republic of China). CTS (DAC =96.1%, molecular weight 12 kD) was obtained from Hai Debei Marine Biotechnology Company (Jinan, People’s Republic of China). OA (98.5% purity) was obtained from Tianjin Kemiou Chemical Reagent Co., Ltd (Tianjin, People’s Republic of China). TPP (98% purity) was obtained from Chengdu Kelong Chemical Co., Ltd (Chengdu, People’s Republic of China). Sodium dihydrogen phosphate, disodium hydrogen phosphate, EDC (99% purity), and NHS (99.5% purity) were obtained from Sigma (St Louis, MO, USA). All other chemicals and solvents were of chromatographic grade.
Synthesis and characterization of OA-CTS
OA-CTS was synthesized by condensation reaction. In brief, OA-CTS was synthesized by free radical chain transfer polymerization. Then, OA was conjugated to CTS polymer in the presence of EDC and NHS. CTS (500 mg) was dissolved overnight at 0.1% (w/v) in 50 mL of acetic acid solution under magnetic stirring (SHA-B Homeothermia Agitator and HJ-4 Multichannel Magnetism Heating Stirring Machine; Chang Zhou, People’s Republic of China). Carboxyl group of OA/ethanol with total volume 10 mL (50:50, v/v) was activated using EDC (500 mg)/NHS (700 mg) for 20 min and then conjugated with the amino group of CTS. Then, activated solution was added dropwise into CTS solution. The mixtures of OA and CTS were prepared at weight ratios of 1:5, 2:5, 3:5, and 4:5, respectively, and reaction was allowed to occur for 24 h. The resulting reaction solution was poured into 30 mL NH3·H2O solution (pH 8). The precipitate (OA-CTS) was recovered by centrifugation, washed with methanol and water, respectively, and freeze-dried. The DS of OA-CTS was evaluated by FT-IR, applying the equation of Le Tien et al:42
|
|
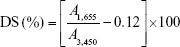
where A1,655 represents the absorptivity of 1,655 cm−1 and A3,450 represents the absorptivity of 3,450 cm−1. The value 0.12 represents the acetyl groups specified in native CTS.
Preparation of OA-CNPs with OA-CTS of different DS
OA-CNPs were prepared by ionic cross-linking of OA-CTS of different DS and TPP. OA-CTS (20 mg) was dissolved overnight at 0.1% (w/v) in 20 mL of acetic acid solution under magnetic stirring. TPP (1 mg/mL) was added dropwise to the OA-CTS solution (1 mg/mL) under continuous stirring till an opalescent solution was obtained, resulting in OA-CNPs. OA-CNPs were separated from the solution by centrifugation for 20 min at 9,000 rpm (9,055× g) twice and freeze-dried. The freeze-dried sample was used for further characterization studies. The best carrier materials were screened through particle size, PDI, and zeta potential.
Preparation of PTX-OA-CNPs and QUE-OA-CNPs
PTX-OA-CNPs were prepared by a simple ionic cross-linking. Different volumes of PTX/methanol solution (1 mg/mL) were added to 0.1% (w/v) acetic acid/OA-CTS solution (20 mL). Different volumes of TPP solution (1 mg/mL) were added dropwise to this solution under continuous stirring till an opalescent solution was obtained, resulting in OA-CNPs. Then, it was centrifuged at 12,000 rpm (16,099× g) for 30 min at 4°C to completely remove free PTX. After centrifugation, the supernatant was used to analyze the DL and EE of NPs. Eventually, samples were lyophilized to obtain PTX-OA-CNPs. QUE-OA-CNPs were prepared with the same method using TPP as the cross-linker.
Preparation of PTX/QUE-OA-CNPs microparticles (PMs) by spray-drying
The aqueous solutions of PTX-OA-CNPs, QUE-OA-CNPs, hydroxypropyl-β-cyclodextrin, lactose, and mannitol were spray-dried (Büchi® Mini Spray Dryer, B-290; Büchi, Flawil, Switzerland) under constant stirring to generate dry powder formulations. The spray-drying conditions were as follows: inlet air temperature, 120°C; outlet air temperature, 85°C; spray flow rate, 400 L/h; and feed pump speed, 5 mL/min. The products were collected and stored in desiccators at room temperature.
Determination of DL and EE
DL and EE of drugs in the PMs were calculated based on the amount of drugs present in CNPs and the amount of free drugs present after centrifugation. Then, the DL and EE of PTX and QUE were determined directly in the PMs. The PMs were dissolved in methanol and extracted by sonication for 30 min. The EE and DL in the spray-dried microparticles were determined by analysis of the samples in suspension after centrifugation at 12,000 rpm for 30 min at 4°C. The sample was adequately washed by methanol after centrifugation. The amount of drugs was measured by HPLC.
The HPLC analyses were carried out using a system (Agilent 1260 infinity LC; Agilent Technologies, Palo Alto, CA, USA) equipped with a C-18 reversed phase column (4.6×250 mm, 5 μm; Hypersil ODS). Methanol and water (containing 0.05% glacial acetic acid) (63:37, v/v) were used as the mobile phase with a flow rate of 1 mL/min at 25°C, and the wavelength was set at 254 nm.
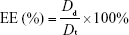
The EE and DL were calculated using the following equation:
|
|
|
|
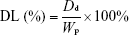
where Dt represents the weight of total added drug, Dd represents the drug amount determined in the PMs, and Wp represents the weight of drug-loaded PMs. All samples were analyzed in triplicate.
TEM
The structure and topography of the OA-CNPs, PTX-OA-CNPs, and QUE-OA-CNPs were examined using a transmission electron microscope (CM30 electron microscope; Philips, Amsterdam, the Netherlands), operated at an acceleration voltage of 100 kV. One drop of each sample dispersion (1 mg/mL) was carefully casted onto a clean copper grid. Then, extra solution was air-dried and directly observed under the transmission electron microscope without staining.
SEM
PMs were sputter-layered with gold under partial vacuum using a scanning electron microscope (s4500n; Hitachi High-Tech Science Corporation, Tokyo, Japan) for visual inspection of the surface morphology. The PMs were mounted on metal stubs using double-sided adhesive tape and vacuum-coated with gold film.
Analysis of particle-size, zeta potential, and aerodynamic diameter of PMs
The particle size, size distribution, and zeta potential of NPs were measured by DLS using a Zetasizer Nano ZS90 (Malvern Instruments, Malvern, UK). PTX-OA-CNPs, QUE-OA-CNPs, OA-CNPs, and PMs were diluted in deionized water to approximately 1 mg/mL, respectively. All measurements were performed at 25°C. Three subsequent measurements were obtained for each sample, and the results were expressed as mean size ± SD.
A certain amount (0.5 g) of PMs was weighed precisely and placed in a 5 mL measuring pycnometer after mechanical tapping at 30 tap/min until no change in volume was observed. The last constant volume of the microspheres was recorded. Tapped density measurements were then obtained until no change in volume was observed (n=3). The data obtained for geometric particle size (d) and tapped density (D) were used to determine the theoretical aerodynamic diameter (dae). Aerodynamic diameter (dae) was calculated using the following equation:43,44
|
|

where ρ represents the tapped density of PMs, ρ1 represents the water mass density (ρ1=1 g/cm3) PMs, and d represents the geometric particle size of PMs.
FT-IR analysis
FT-IR analysis was recorded using an FT-IR Avater-360 spectrometer (PerkinElmer, Waltham, MA, USA), which scanned in the region of 4,000–400 cm−1 for each spectrum, with a resolution of 2 cm−1. PTX-OA-CNPs, QUE-OA-CNPs, OA-CNPs, free PTX, QUE, OA-CTS, CTS, and PMs were mixed with KBr and compressed into pellets. The characteristic peaks of the FT-IR transmission spectra were documented.
DSC
PTX-OA-CNPs, QUE-OA-CNPs, OA-CNPs, free PTX, QUE, OA-CTS, CTS, and PMs were analyzed using DSC7020 (Hitachi High-Tech Science Corporation). The samples were sealed in a standard aluminum pan and heated from 40°C to 600°C at a scanning rate of 2°C/min under a 20 mL/min inert nitrogen flow rate. An empty sealed aluminum pan was used as reference. The characteristic peaks and specific heat of the melting endotherm were recorded.
XRD
The drugs, lyophilized NPs, and PMs were analyzed by XRD (X’pert pro; Philips) in a range of 5°–60° (2θ), using Cu-Kα radiation (λ=0.15406 nm) generated at 40 kV and 20 mA, at a scan rate of 0.02° 2θ/s.
Determination of redispersibility of PMs
The ability of PMs to deaggregate into CNPs was determined at 37°C using a disintegration time determinator (ZB-1E; Tianda Tianfa Technology Co., Ltd, Tianjin, People’s Republic of China) and deionized water as medium. The redispersibility time was the time required to transform PMs immersed in water into CNPs with vertical vibrations at a rate of 30 vibrations per min. The redispersibility time of PMs (batches of 20 mg quantity) was recorded (n=6). The CNPs were collected in medium after redispersibility. The particle size and size distribution were measured by DLS using a Zetasizer Nano ZS90. TEM technique was also employed for confirming the size of dispersed CNPs.
Stability test after redispersibility of PMs
CNPs constituting PMs were analyzed in medium following depolymerization after 72 h of storage at 37°C. All measurements were performed at 37°C using a Zetasizer Nano ZS90 (Malvern Instruments) to investigate the stability of CNPs at 0, 6, 12, 24, 36, 48, and 72 h. Three subsequent measurements were obtained for each sample, and the results were expressed as mean size ± SD.
In vitro drug release studies
The in vitro release of PTX and QUE from the PMs was studied as described by Maya et al45 with modifications employing two different pH values, 4.5 and 7.4. The procedure utilized a dialysis system comprising a dialysis bag and a receptor chamber. PMs, QUE, and PTX were each dispersed in 2 mL of release medium (0.01 M, PBS of pH 7.4 and acetate buffer of pH 4.5 containing 1% [w/v] Tween 80) in a dialysis bag (molecular weight cutoff =12,000 D, Spectrum®, Los Angeles, CA, USA), respectively. Tween 80 was used to increase the solubility of PTX and QUE in the buffer solution to maintain sink condition. Then, the dialysis bag was placed in 50 mL of the release medium, maintained at 37°C±0.5°C, and shaken at 100 rpm. At predetermined time intervals, 2 mL of release medium was withdrawn and replaced with the same volume of fresh medium. Blank PMs were used in the blank control group. The amount of PTX and QUE was measured by HPLC at 254 nm. The CR rate of PTX and QUE was calculated using the following equation:
|
|
where Mt represents the release of PTX and QUE in PBS for t hours and M0 represents the content of PTX and QUE in the PMs. All experiments were carried out in triplicate. The release data were analyzed using zero-order, first-order, Higuchi, and Korsmeyer–Peppas models. The regression analysis was performed, and the best model was chosen on the basis of relative coefficient (R2).
In vitro hemolysis assay of PMs
In vitro hemolysis caused by PMs was determined by three-wavelength colorimetry.46 Fresh blood was taken from different mice into a tube containing ACD. About 100 μL ACD was added to 600 μL fresh blood. Then, 100 μL of four different concentrations of PMs was added to the blood and incubated for 2 h at 37°C, and shaken at 100 rpm. Plasma was collected by centrifugation at 4,500 rpm for 10 min, and evaluated by UV–vis spectroscopy (Shimadzu UV-Vis Spectrophotometer UV-1700; Shimadzu, Kyoto, Japan) at 450, 380, and 415 nm. Blood treated with 1% Triton X-100 was taken as positive control, and saline-treated blood acted as negative control in this experiment where total Hb value of blood represents the Hb value of blood treated with 1% Triton X-100. The plasma Hb was calculated using the following equation:
|
|
where A415, A380, and A450 represent the optical density values at 380, 450, and 415 nm, respectively. E is the molar absorptivity value of oxyhemoglobin at 415 nm, and 1.655 is the correction factor accounting for plasma turbidity.
|
|
In vivo pharmacokinetic study and tissue distribution
Wistar rats (weighing 200–220 g, equal numbers of male and female) were obtained from Lukang & Co. (Jining, People’s Republic of China). The rats were housed for an acclimation period of at least 2 weeks before experiments with free access to food and water at 25°C±3°C and 50%±20% relative humidity under a 12 h light–dark cycle. Before surgery, rats were anesthetized by intraperitoneal injection of ethylurethane (20%). After surgery, all rats were transferred to restraining cages. The animal protocol was approved by Shandong Medical Laboratorial Animal Administration Committee. Rats were allowed free access to water and food throughout the experiment. All animal experiments were carried out in accordance with the National Institutes of Health Guide for the Care and Use of Laboratory Animals (NIH publication No 80-23). All efforts were made to minimize the number of animals used and their suffering.
Biodistribution studies of PTX/QUE-loaded PMs for pulmonary delivery were carried out using dry powder insufflator (Model DP-4; Penn-Century Inc., Philadelphia, PA, USA). The cannula of the dispositive was inserted directly into the trachea through the mouth, and single intravenous administration and combined intravenous administration of PTX/QUE were carried out in rats. Before experiments, the rats were randomly separated into four groups as follows: Group A: intratracheal administration of PMs (PTX 15 mg/kg and QUE 15 mg/kg); Group B: intravenous administration of PTX (15 mg/kg); Group C: intravenous administration of QUE (15 mg/kg); and Group D: intravenous administration of PTX (15 mg/kg) and QUE (15 mg/kg). After being weighed, rats were anesthetized using ethylurethane (1 g/kg, intraperitoneal), and the depth of anesthesia was continuously controlled. Then, they were given corresponding medicine as per grouping. Blood samples were taken from the heart at predetermined intervals (0.083, 0.25, 0.5, 1, 2, 3, 4, 6, and 8 h) and collected in heparinized tubes (six rats in each group for every time point). Whole blood was centrifuged at 5,000 rpm for 5 min, and 500 μL of plasma was collected and stored at −20°C until analysis. Then, 1.5 mL methanol was added to 0.5 mL plasma, vortexed for 5 min, and supernatant was obtained after centrifugation at 10,000 rpm for 10 min at 4°C. The concentrations of PTX and QUE in plasma were measured by HPLC with SA as internal standard.
Tissue distribution was studied at predetermined time points (0.25, 1, 3, and 6 h) in the experimental animals. After blood samples were collected from the heart, the rats were sacrificed, and the tissues including the heart, liver, spleen, lung, and kidney were collected, weighed, and frozen at −20°C until further analysis. The tissues were formulated into homogenates using saline solution (1 g/mL). Three volumes of methanol were added to tissue homogenates, vortexed for 5 min, and supernatant was obtained after centrifugation at 10,000 rpm for 10 min at 4°C. Then, the concentrations of PTX and QUE in plasma were measured by HPLC with SA as internal standard.
Statistical analysis
The experiments were performed at triplicate, and results reported in this study were expressed as mean ± SD. All analyses were carried out using SPSS for Windows statistical software (version 19.0; IBM Corp, Armonk, NY, USA), and statistical differences were considered to be significant at a level of P<0.05.
Results and discussion
Preparation and characterization of OA-CTS of different DS
The formation of amide linkage between OA and CTS was evidenced in the FT-IR spectra (Figure 1A). The FT-IR spectrum of pure CTS showed absorption bands at 3,440 cm−1, which corresponds to the OH stretching vibrations. The bands at around 1,630 cm−1 can be attributed to the stretching vibrations of amide bond. The peaks near 1,390 and 1,090 cm−1 are characteristic of amide III and C−O, respectively. Compared with those of CTS absorption, the spectra of OA-CTS showed numerous changes, such as the changes in intensity of OA-CTS at 2,921 cm−1 (νasCH2) and the increase at 1,373 (δCH2) and 1,077 cm−1 (τCH2). Absorption at 3,417 cm−1 (OH, NH2) and the band at 1,648 cm−1 (δN−H of amide) decreased. However, the peaks at 1,648 cm−1 for amide groups were sharper in OA-CNPs. These changes of peaks were due to the chemical reaction between the carboxyl group of OA and the amino group of CTS in the presence of EDC/NHS, and the formation of an amide bond. The peaks at 1,090 (τCH2), 1,380 (δCH2), 2,850 (νsCH2), and 2,921 cm−1 (νasCH2) were stronger and sharper in the sample with high DS, and their intensities were proportional to the DS value. The results revealed that coupling occurred between CTS and OA.
 | Figure 1 (A) FT-IR spectra of CTS and the mixtures of OA and CTS at weight ratios from 1:5 to 4:5. (B) FT-IR spectra of CTS, OA-CTS, OA-CNPs, PTX, PTX-OA-CNPs, QUE, QUE-OA-CNPs, blank PMs, and PMs. (C) DSC thermograms and (D) XRD patterns of OA-CTS, PTX, PTX-OA-CNPs, QUE, QUE-OA-CNPs, physical mixture of all solid objects, and PMs. |
As shown in Table 1, 5%, 7%, 11%, and 27% DS values were obtained for different mixing ratios of CTS and OA, by applying the equation by Le Tien et al.42 The mean particle size, PDI, and zeta potential of NPs were dependent on the DS of OA-CTS (Table 1). The mean particle size of OA-CTS decreased from 435.1 to 150.4 nm because of an increase in weight ratio of CTS to OA. However, the zeta potential of OA-CTS at a weight ratio of 4:5 was significantly lower than that of other groups (P<0.05), and PDI was higher than that of other groups (P<0.05). These findings are due to the reduction of free amine group, leading to decreased positive electrical properties and stability. Most suitable NPs with 11% DS were produced using OA-CTS at 3:5 weight ratio.
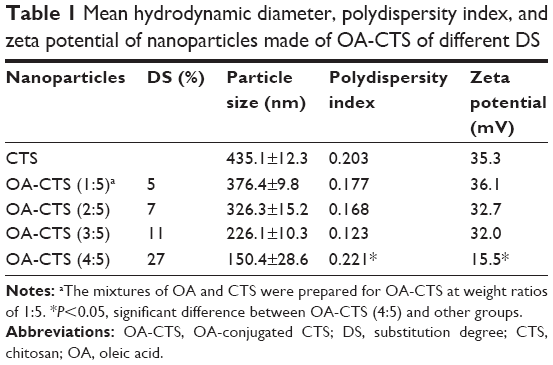 | Table 1 Mean hydrodynamic diameter, polydispersity index, and zeta potential of nanoparticles made of OA-CTS of different DS |
Determination of EE, DL, and yield
The OA-CNPs, PTX-OA-CNPs, and QUE-OA-CNPs were prepared using OA-CTS with 11% DS. Drug-loaded CNPs (no ultracentrifugation), free drugs in nanosuspension, and pharmaceutical excipients were subjected to spray-drying. This method produced CNPs with higher DL than drug-loaded CNPs, and also with higher EE than CTS and free drug directly spray-dried. The PTX and QUE were efficiently encapsulated in PMs. The DL of PTX and QUE was 15.36% and 14.79% and the EE was 92.6% and 90.3%, respectively. The production yield of spray-dried PMs was about 70% which was higher than that of the CTS microspheres (about 50%) prepared in our laboratory.38
TEM and SEM
The surface morphologies and particle sizes of OA-CNPs, PTX-OA-CNPs, and QUE-OA-CNPs were determined by TEM analysis and are shown in Figure 2A–C. The typical representative images show that these NPs possess a uniformly dispersed structure and nearly spherical shape. OA-CTS cross-linked with TPP in the solvent without drugs locked water molecules in the core position of NPs. However, in the solvent with PTX or QUE, stronger hydrophobic interactions between the OA-CTS and hydrophobic drugs prompted the excretion of water molecules from the core position of NPs. OA-CNP dispersion was more translucent compared with PTX-OA-CNPs and QUE-OA-CNPs.
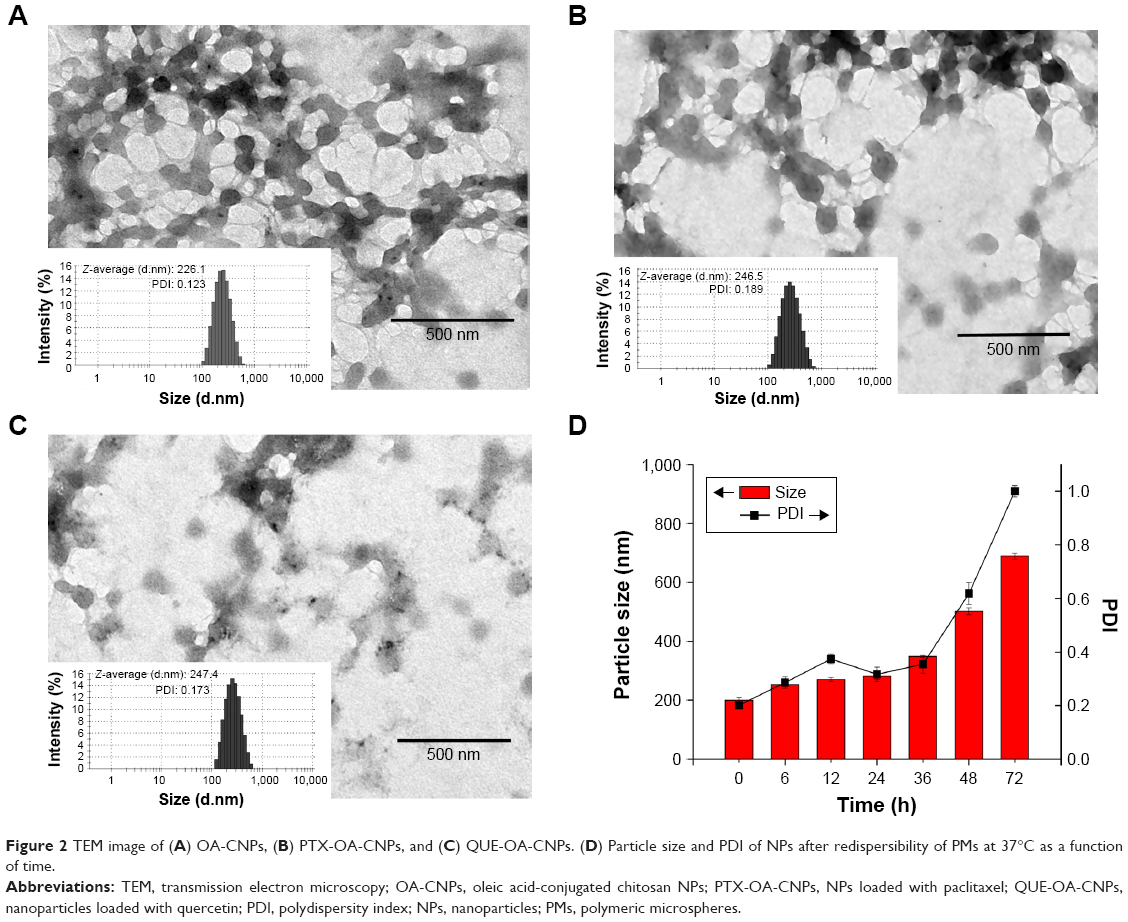 | Figure 2 TEM image of (A) OA-CNPs, (B) PTX-OA-CNPs, and (C) QUE-OA-CNPs. (D) Particle size and PDI of NPs after redispersibility of PMs at 37°C as a function of time. |
SEM was employed to study the surface morphologies and overall structural characteristics of spray-dried PMs with different scales, and the images are shown in Figure 3B–D. PMs displayed regular spherical granules and a particle diameter range of 1–5 μm. During drying of atomized NPs in the spray drier, the escaped solvent left a pore on the surface of PMs. Figure 3C and D shows that a large number of NPs were loaded on the PMs. These NPs were in a uniform size, compactly distributed with adjacent NPs, and had a particle diameter of about 100 nm. The results indicate that the PMs were polymers formed by a large number of NPs; moreover, PMs possessed good geometric particle diameter (1–5 μm) and uniformity. NPs loaded on PMs were smaller than PTX-OA-CNPs and QUE-OA-CNPs in nanosuspension. We speculate that this finding is due to the evaporation of a large amount of water from NPs through spray-drying, thus resulting in the formation of a compact structure.
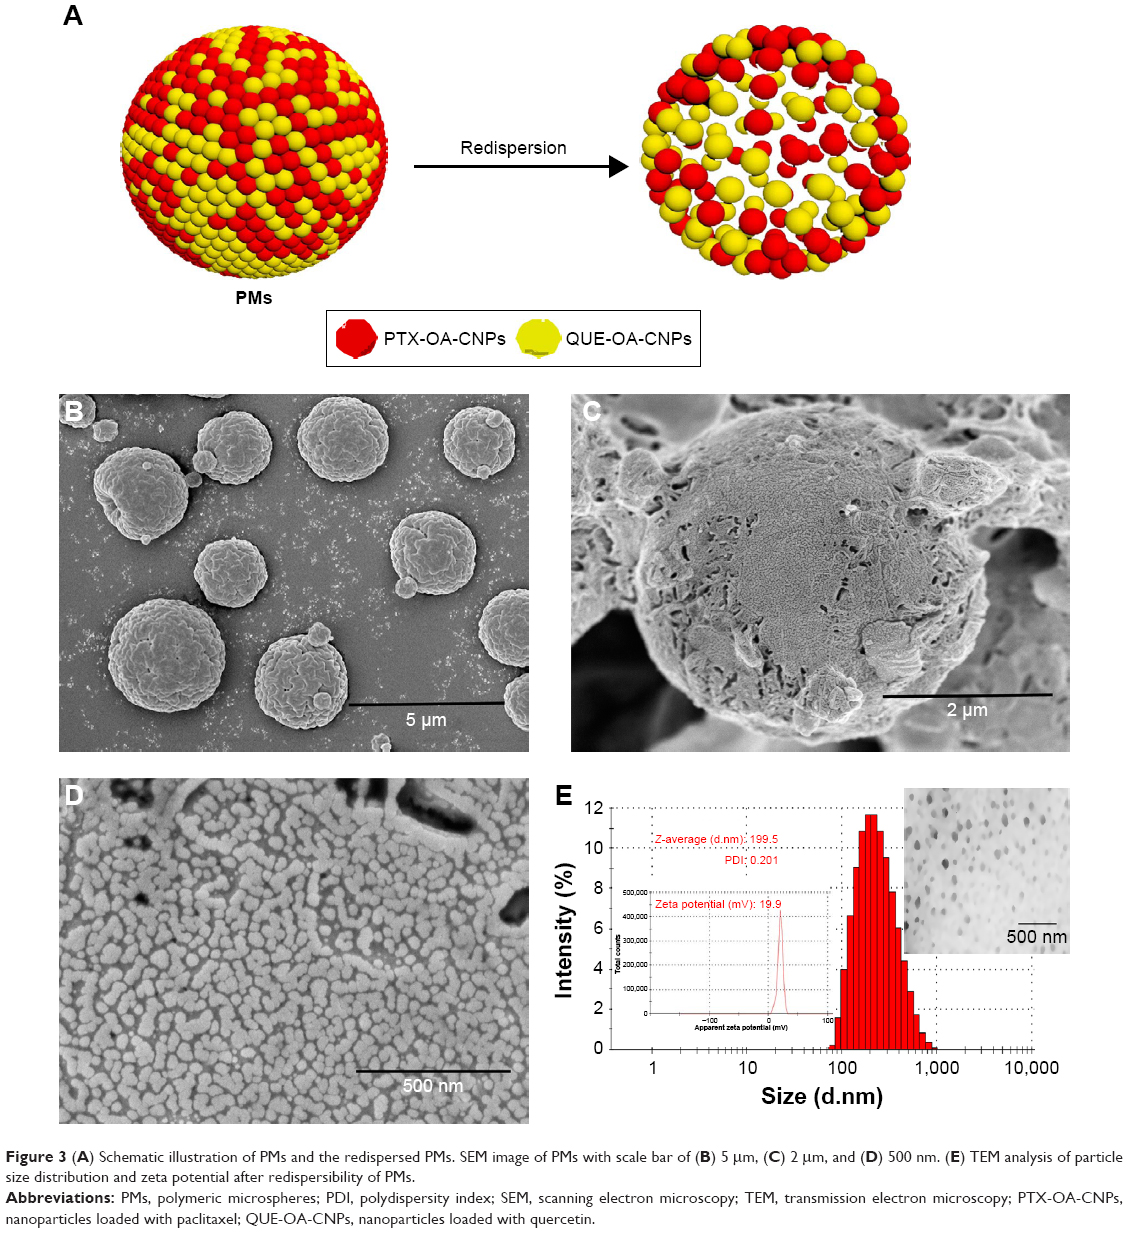 | Figure 3 (A) Schematic illustration of PMs and the redispersed PMs. SEM image of PMs with scale bar of (B) 5 μm, (C) 2 μm, and (D) 500 nm. (E) TEM analysis of particle size distribution and zeta potential after redispersibility of PMs. |
Analysis of particle size, zeta potential, and aerodynamic diameter of PMs
The particle size distributions of NPs and the spray-dried microspheres were investigated using laser diffraction (Figures 2 and 3). The particle size distributions of OA-CNPs, PTX-OA-CNPs, QUE-OA-CNPs, and PMs were found to be uniform with average diameters of 226.1, 246.5, and 247.4 nm and 3.373 μm, respectively. Diameter is the most important factor in the deposition of the particles in the base of the lung. The particle size must be 1.0–5.0 μm for the drug to deeply penetrate the lungs; particles that are larger than 6 μm are generally deposited in the upper respiratory tract, and those less than 1 μm are exhaled without deposition.47 The geometric particle size of PMs was 3.373 μm, and tapped density was 0.286±0.007 g/cm3. The dae (1.804±0.022 μm) was calculated from both these parameters. PMs exhibited a particle diameter range (1–5 μm) suitable for inhalation. The PDI value was between 0.123 and 0.456, and the particle size was distributed in a narrow range. The results of light scattering experiments confirmed the sizes of OA-CNPs, PTX-OA-CNPs, QUE-OA-CNPs, and PMs detected by TEM observation. The zeta potential measurement showed that OA-CNPs, PTX-OA-CNPs, and QUE-OA-CNPs exhibit positive zeta potential (32.9, 24.2, and 26.0 mV), proving that the NPs possess positively charged surfaces because of the CTS coating with free amino groups; in addition, high zeta potential also indicated the high physical stability of NPs. These results suggest that OA-CNPs, PTX-OA-CNPs, and QUE-OA-CNPs offer suitable particle size for cellular uptake, and positive surface charge was beneficial to the binding of the negatively charged cellular surfaces.48
Attenuated total reflectance FT-IR
As shown in Figure 1B, compared with OA-CTS, the OA-CNPs reveal decrement and a slight shift in peak intensity at 3,448, 1,628, 1,373, and 1,077 cm−1. The characteristic peaks of 2,927 and 2,844 cm−1 disappeared in the curve of the OA-CNPs. These results confirm that amino groups are involved in cross-linking with phosphate group in TPP; in the case of the prepared OA-CNPs, no new substance was formed. PTX shows its characteristic peaks at 3,411 (O−H stretching), 1,730 (C=C stretching), 1,635 (N−H stretching), and 1,070 cm−1 (C−O stretching). Meanwhile, the FT-IR spectra of QUE exhibit absorption bands, including those of gOH (3,399 cm−1), gC=O (1,670 cm−1), C=C (−Ar) (1,610 cm−1), d-CH3 (1,389 cm−1), and rC=O (1,210 cm−1). The spectra of the PTX-OA-CNPs and the QUE-OA-CNPs did not exhibit the PTX and QUE characteristic peaks of 1,730 and 1,210 cm−1, respectively. Further in the PTX-OA-CNPs and QUE-OA-CNPs, the relevant peaks of PTX and QUE showed that no new characteristic peaks were generated, and only a slight shift in their peaks confirmed the encapsulation of PTX and QUE. The characteristic peaks of the blank PMs and PMs were similar to those of OA-CNPs, similarly revealing a slightly significant shift and increment. The results suggest the absence of any chemical interaction between drugs and carrier material during the preparation of drug-loaded CNPs or spray-drying.
DSC
DSC was performed to further characterize the PMs formulated under different compositions. The DSC curves of PMs, a physical mixture of all solid objects, PTX-OA-CNPs, QUE-OA-CNPs, PTX, QUE, and OA-CTS are shown in Figure 1C. The DSC thermogram of OA-CTS shows a sharp melting endotherm at 189.86°C, whereas those of OA-CTS and PTX demonstrated a relatively small peak at 242.12°C and 161.01°C, respectively. The thermogram of the physical mixture shows virtually the overlap of each individual component, except for several slight decreases and drifts at 161.59°C and 228.48°C. However, PTX-OA-CNPs, QUE-OA-CNPs, and PMs showed no endothermic peak. The PTX and QUE endothermic peaks completely disappeared in PTX-OA-CNPs, QUE-OA-CNPs, and PMs. This proves that PTX-OA-CNPs, QUE-OA-CNPs, and PMs exist in the amorphous form. These results indicate the entrapment of PTX and QUE molecules into OA-CNPs, subsequently forming PMs, and the strong interaction between drugs and OA-CNPs suggests that the drug may be potentially released slowly in vivo.
Crystallinity of NPs
XRD was used to investigate the physical state and crystallinity of different compositions. Figure 1D shows the XRD patterns of pure PTX, QUE, OA-CTS, PTX-OA-CNPs, QUE-OA-CNPs, a physical mixture of all solid objects, and PMs. OA-CTS exhibits two characteristic broad peaks at 11.02° and 20.12°, which indicates the low degree of crystalline nature of OA-CTS. This property was considered to be due to the layered structure of CTS, in which numerous glucosamine units and two OA units form the crystal.49 Evidently, pure PTX shows sharp and high intense characteristic peaks; pure QUE also shows a series of sharp crystalline peaks, indicating that pure PTX and QUE are highly polycrystalline in nature. Furthermore, with the formation of PTX-OA-CNPs and QUE-OA-CNPs, the sharp crystal peaks of OA-CTS, PTX, and QUE disappear and a new broad amorphous peak could be detected. The physical mixture shows all of the specific peaks of PTX, QUE, and OA-CTS. The formation of a broad amorphous peak indicates that PTX and QUE are completely and successively encapsulated into the OA-CNPs cores. Similarly, PMs only show a broad amorphous peak, also indicating amorphous drug formation; no large amount of free drug exists on the surface of PMs, and the PMs are composed of a large number of PTX-OA-CNPs and QUE-OA-CNPs.50
Determination of PM redispersibility
The particle size distributions of CNPs (redispersibility of PMs in Figure 3A) reveal a mean average size of 199.5 nm in Figure 3E, as well as uniform size distribution with a PDI of 0.201. The PMs were immediately redispersed in water within 1 h because of the heavy use of disintegrating agents (mannitol and lactose). Compared with NPs before spray-drying, CNPs showed smaller particle size after PM redispersibility. Moisture could not easily enter the hydrophobic NP core. TEM was used to study the overall structural characteristics of the CNPs (PM redispersibility). The typical representative images show that the CNPs present a spherical shape and a dispersed structure. Meanwhile, TEM shows spherical-shaped NPs of size range within 100–250 nm for CNPs, as is in accordance with the above results. These results show that PMs could redisperse into a large number of CNPs in the polar environment of the alveoli.
Stability test after redispersibility of PMs
The change in particle size and PDI of NPs after redispersibility of PMs at 72 h is shown in Figure 2D. They showed no obvious aggregation at 37°C for 48 h, particle size less than 400 nm, and PDI less than 0.4. These suggested that the size distribution of the NPs after redispersibility of PMs was narrow at 48 h. The particle size and PDI increased to more than 500 nm and 0.5 up to 72 h. The experimental result indicated that these NPs could keep their structural stability after redispersibility of PMs even at the humid inner environment in vivo within 48 h.
In vitro release
The in vitro release of drugs from free PTX, free QUE, and PMs was estimated by dialysis bag diffusion method at appointed time points under drain conditions at both pH 7.4 and 4.5 within 48 h. The CR curves of PTX or QUE from the prepared NPs at different pH values are shown in Figure 4. The PMs presented a continuous slow release of drugs for up to 48 h. At pH 7.4, pure QUE and PTX were almost totally released in 8 h, whereas the release of PTX and QUE from PMs showed two stages (burst release and sustained release). In the initial 2 h, PMs showed burst release of 21.87% of PTX and 27.83% of QUE. Sustained release of PTX and QUE occurred during the remaining time which resulted in the release of 41.40% of PTX and 52.88% of QUE from the PMs. When the pH of release medium decreased, free drugs also exhibited relatively rapid PTX and QUE release, with 86.34% and 84.82%, respectively, released at pH 4.5 in 10 h. A burst drug release of the PTX and QUE from PMs was observed during the first 2 h, with 17.98% and 34.08% of drugs released from PMs, respectively. The burst release was followed by a sustained release up to 48 h, and at the end, approximately 56.21% of PTX and 65.85% of QUE were released. The burst release occurred due to the encapsulated drugs, and several free drugs dispersed on the PMs could contribute to drug release with pH 7.4 or pH 4.5 of the release medium. Thus, the drug rapidly reaches an effective concentration at the target site. Afterward, the sustained release is due to the OA-CNPs interconnection and diffusion of drugs from gaps in the polymer matrix. This release allows the drug to stay at an effective concentration in circulation over time. In particular, the drug release at pH 4.5 surpassed that at pH 7.4. As the pH values dropped lower, the remaining amine groups became protonated and generated repulsive force by similar positive charges. Thereby, during the disintegration of PMs, the OA-CNPs shell becomes loose and swollen and is dissolved in the medium, leading to a rapid release of a large amount of drugs encapsulated in them, which indicates that the drug-loaded OA-CNPs may be easier to release in a low-pH environment.51 The result suggests that PMs made up of both PTX-OA-CNPs and QUE-OA-CNPs are able to sustain the release of encapsulated drugs compared with free drugs. In addition, the release characteristic of the drug-loaded OA-CNPs ensures the release in the tumor cells (lower pH than the normal).52
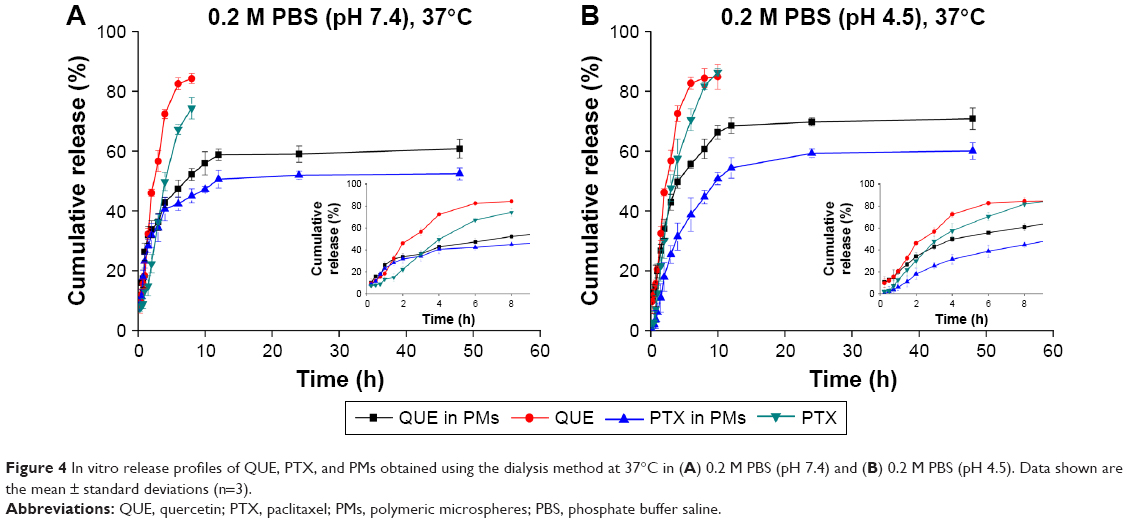 | Figure 4 In vitro release profiles of QUE, PTX, and PMs obtained using the dialysis method at 37°C in (A) 0.2 M PBS (pH 7.4) and (B) 0.2 M PBS (pH 4.5). Data shown are the mean ± standard deviations (n=3). |
As shown in Table 2, the PTX and QUE release mechanism from PMs was set up and estimated by some mathematical models. The optimal model of the fitting was obtained with the Korsmeyer–Peppas model. The release of PTX and QUE from PMs at pH 7.4 and pH 4.5 appears to follow Korsmeyer–Peppas model, where n is the diffusional exponent indicative of the mechanism of drug release in this model. All values of n<0.45 indicate the mechanism of release of PTX and QUE from PMs was Fickian diffusion.
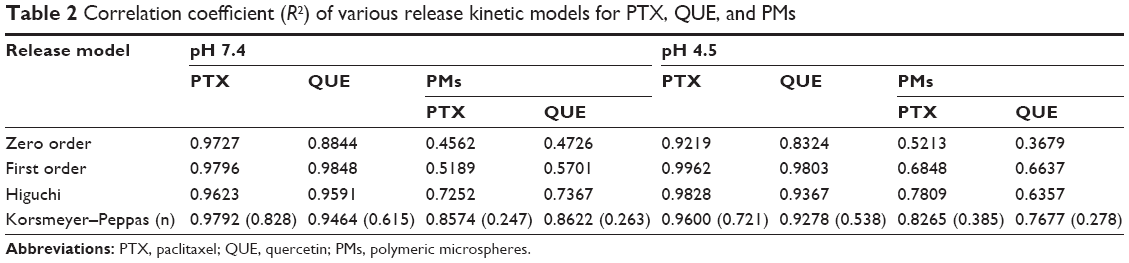 | Table 2 Correlation coefficient (R2) of various release kinetic models for PTX, QUE, and PMs |
Hemolysis assay
Blood compatibility is an important index for biomaterials determined by in vitro erythrocyte-induced hemolysis assay (Figure 5). In this study, the blood compatibility of PTX, QUE, and PMs was evaluated using this assay at a certain concentration range. Saline solution and 1% Triton X-100 were used as negative and positive controls, respectively. The positive control showed 100% hemolysis with completely lysed red cells (P≤0.01). The results in Figure 5A show that the hemolysis rate of the samples is within the acceptable level of 5%, which is a safe critical value for biomaterials according to ISO/TR 7406.46 The results indicate that the damage caused by PTX, QUE, and PMs to the erythrocytes was minimal, and thus, the PMs could be used in clinical practice.
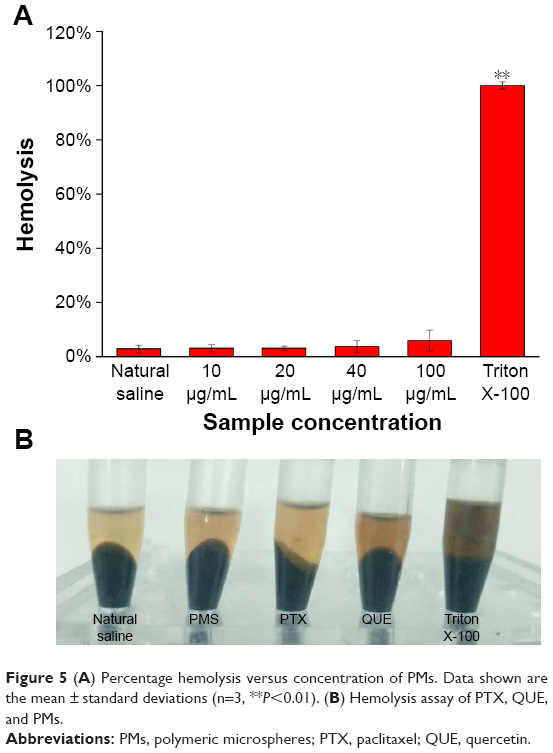 | Figure 5 (A) Percentage hemolysis versus concentration of PMs. Data shown are the mean ± standard deviations (n=3, **P<0.01). (B) Hemolysis assay of PTX, QUE, and PMs. |
In vivo pharmacokinetic study in rats
The mean plasma concentration–time profiles of PTX and QUE after single intravenous administration, combined intravenous administration, and pulmonary administration in rats are shown in Figure 6. Relative to single PTX administration, PMs administration or combined intravenous administration resulted in higher plasma PTX concentrations at 0.5, 1, 3, and 6 h, respectively. In addition, the main pharmacokinetic parameters are summarized in Table 3. Figure 6 demonstrates that the mechanism is best described by a two-compartment model. PTX and QUE are rapidly absorbed, and the peak level is achieved before 1 h.
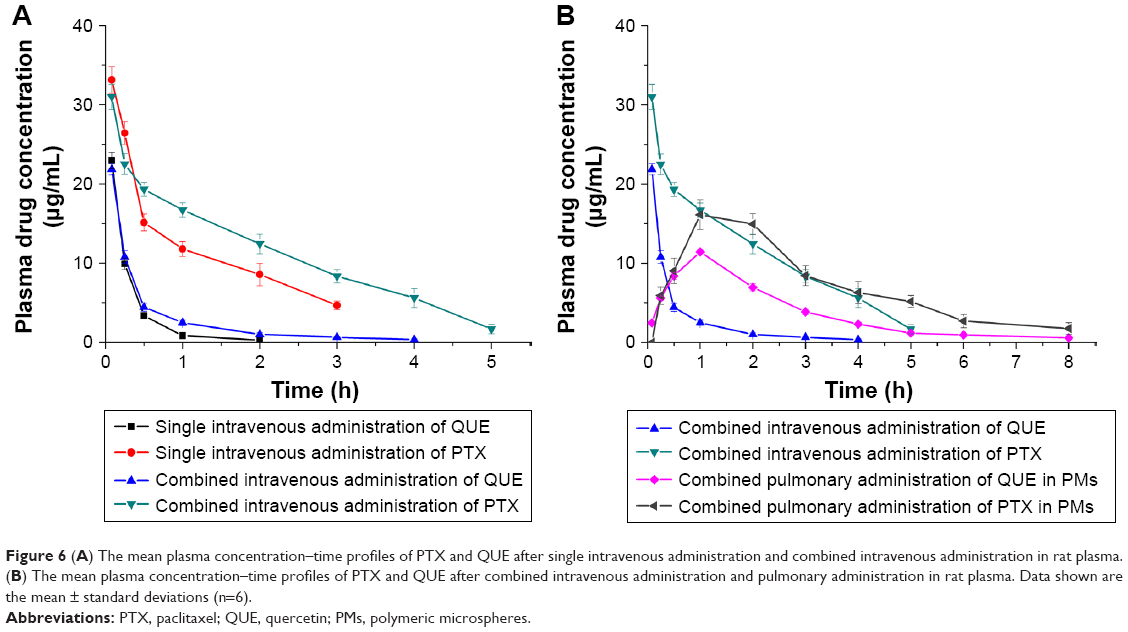 | Figure 6 (A) The mean plasma concentration–time profiles of PTX and QUE after single intravenous administration and combined intravenous administration in rat plasma. (B) The mean plasma concentration–time profiles of PTX and QUE after combined intravenous administration and pulmonary administration in rat plasma. Data shown are the mean ± standard deviations (n=6). |
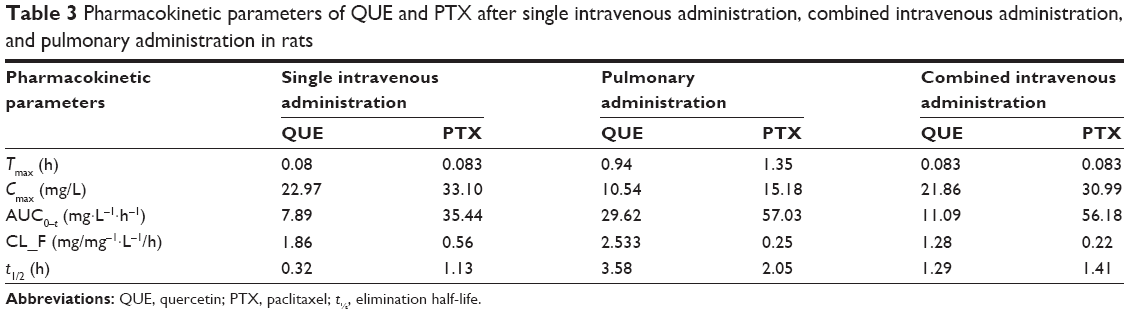 | Table 3 Pharmacokinetic parameters of QUE and PTX after single intravenous administration, combined intravenous administration, and pulmonary administration in rats |
PTX alone can be cleared rapidly with a half-life of 1.13 h in plasma. The t1/2 and area under the curve (AUC0–t) of combined intravenous administration were higher than those of single intravenous administration. The Tmax, Cmax, and CL values changed minimally throughout the two modes of intravenous administration. PTX from combined intravenous administration showed a tendency to be more slowly cleared from blood than PTX from single intravenous administration. Pharmacokinetic results suggest the pharmacokinetic interactions between QUE and PTX, and that QUE affects the pharmacokinetic parameters of PTX. QUE could be combined with the P-gp of cell, which participates in the cell elimination of PTX. The Tmax, t1/2, and AUC0–t of pulmonary administration were significantly higher than those of combined or single intravenous administration (P<0.05), whereas the CL and Cmax were lower than those of other groups. Pulmonary administration with PMs significantly affected the pharmacokinetics of PTX in rats. After pulmonary administration with PMs, the postponed Tmax demonstrated that the absorption of PTX slowed down. The decreased Cmax indicated that the amount of PTX exposed in plasma reduced and released steadily. The pharmacokinetics of PMs improved by controlling the in vitro release of PTX and QUE. Results showed that combined intravenous administration and pulmonary administration could improve the PTX absorption rate, amount, and pharmacokinetics. The bioavailability of PTX was significantly enhanced by the pulmonary administration of PMs.
In vivo tissue distribution in rats
The tissue distribution results of different administration modes are shown in Figure 7. The PTX and QUE concentrations in the lung were markedly increased (P<0.01). After pulmonary administration, the tissue distribution of PTX and QUE in the lung was significantly increased at the predetermined time points compared with other tissues. At 6 h after pulmonary administration, PTX concentration in the lung remained high (206.27 μg/g), whereas a relatively low distribution in the heart (2.61 μg/g), liver (8.82 μg/g), spleen (6.94 μg/g), and kidney (5.01 μg/g) was found at the same time. QUE concentration in various tissues was similar to that of PTX at 6 h after pulmonary administration. Tissue biodistribution in rats indicates that PMs would mostly be deposited in the lung, thereby enhancing the lung PTX and QUE concentrations and decreasing their concentration in other tissues, reducing the clearance rate of drugs in vivo and improving therapeutic effects.
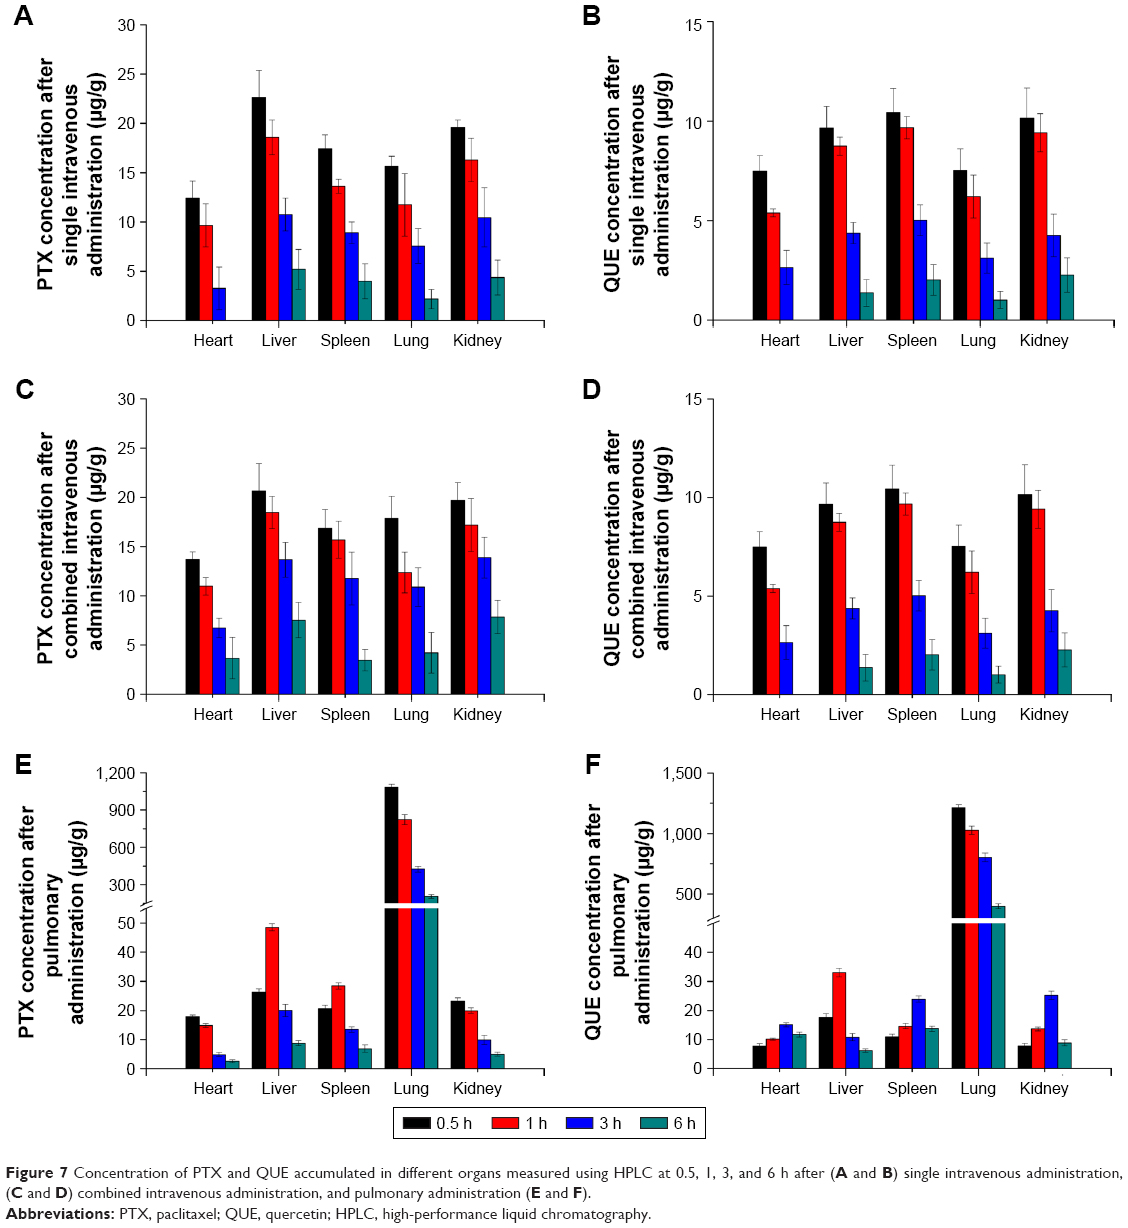 | Figure 7 Concentration of PTX and QUE accumulated in different organs measured using HPLC at 0.5, 1, 3, and 6 h after (A and B) single intravenous administration, (C and D) combined intravenous administration, and pulmonary administration (E and F). |
As shown in Figure 7A, the PTX concentration after a single intravenous administration decreased rapidly in the heart, liver, lungs, spleen, and kidneys after 6 h. No significant differences were observed between the single intravenous administration and combined intravenous administration in the amount of PTX in the organs analyzed in the first 3 h. Analysis of the biodistribution of PTX and QUE in the major organs indicated that the majority of these drugs are distributed to the liver at 0.5 h after single intravenous administration or combined intravenous administration. PTX concentration in the liver, lung, and kidney was significantly increased (P<0.01) at 6 h in the presence of QUE; besides, PTX concentration in the heart was detected at 6 h in the presence of QUE, indicating that QUE could achieve the improved retention time of PTX in vivo, as well as improved therapeutic efficacy and potency.
After the pulmonary administration of PMs (Figure 7E and F), the distribution of PTX and QUE in the lung was significantly increased at the predetermined time points compared with other tissues. At 6 h after pulmonary administration, the PTX concentration in the lung remained high, whereas a relatively low distribution in the heart, liver, spleen, and kidney was found. Meanwhile, relative to single PTX, the PTX concentration increased significantly in various organs. The high PTX concentration observed in the lung represents the biodistribution of PMs because the PTX and QUE were integrated in the lung. As the PMs started to dissolve, PTX and QUE were slowly released from the depolymerizing PMs. These results demonstrate that PMs can significantly improve the retention time of PTX in vivo. Increased drug retention by PMs relative to single or combined intravenous administration was also demonstrated at the same time points. The results clearly show that compared with sole PTX, the PMs were eliminated more slowly from blood. The biodistribution study in rats indicated that PMs would mostly be deposited in the lung and slowly released drugs, possibly enhancing the lung PTX concentration and thus extending the release time of PTX.
Conclusion
In this study, dispersible nanopolymeric microspheres suitable for inhalation applications were successfully prepared using an ionic cross-linking method combined with a spray-drying method using synthesized amphiphilic CTS (OA-CTS). These PMs were then loaded with hydrophobic PTX and QUE. The synthesized carrier materials (OA-CTS) offered good stability and sizes. The PTX-OA-CNPs, QUE-OA-CNPs, and PMs exhibited excellent properties of complete particle morphology and homogeneity. PMs are polymers formed by a large number of NPs and possessed good inhalable particle diameter (1–5 μm), uniformity, and redispersibility. PMs displayed good slow-release characteristics at pH 4.5 and 7.4. Moreover, the combination of PTX and QUE exhibited a marked increase in PTX retention in vivo. PMs significantly promoted the pulmonary absorption of PTX and prolonged blood circulation compared with single and combined intravenous administration of PTX and QUE, and also showed sustained-release effects. PTX concentration in the lung after pulmonary PM administration remained significantly high within 6 h. Lung accumulation of the PTX was enhanced numerous times, because of the sustained release of PMs. Overall, PMs can serve as a promising pulmonary delivery system for combined pharmacotherapy using hydrophobic anticancer drugs.
Abbreviations
ACD, acid citrate dextrose; CL, clearance; Cmax, peak concentration; CR, cumulative release; CTS, chitosan; DL, drug loading; DLS, dynamic light scattering; DS, substitution degree; DSC, differential scanning calorimetry; EDC, 1-(3-dimethylaminopropyl)-3-ethylcarbodiimide hydrochloride; EE, entrapment efficiency; FT-IR, Fourier transform infrared spectroscopy; Hb, hemoglobin; HPLC, high-performance liquid chromatography; NHS, N-hydroxysuccinimide; NPs, nanoparticles; NSCLC, non-small-cell lung cancer; OA, oleic acid; OA-CNPs, OA-CTS NPs; OA-CTS, OA-conjugated CTS; PBS, phosphate buffer saline; PDI, polydispersity index; P-gp, P-glycoprotein; PMs, polymeric microspheres; PTX, paclitaxel; PTX-OA-CNPs, OA-CNPs loaded with PTX; QUE, quercetin; QUE-OA-CNPs, OA-CNPs loaded with QUE; SA, salicylic acid; SD, standard deviation; SEM, scanning electron microscopy; t½, elimination half-life; TEM, transmission electron microscopy; TPP, sodium tripolyphosphate; XRD, X-ray powder diffraction.
Acknowledgments
The authors are grateful for the generous financial support from National Natural Science Foundation of China (Nos 81774125 and 81573717), National Key Technology R&D Program of the Ministry of Science and Technology (No 2013GA740103), Department of Science and Technology of Weifang City (2014WS045), visiting scholar project of Weifang Medical University, and project of Collaborative Innovation Center for Target Drug Delivery System of Weifang Medical University.
Disclosure
The authors report no conflicts of interest in this work.
References
Schiller JH, Harrington D, Belani CP, et al; Eastern Cooperative Oncology Group. Comparison of four chemotherapy regimens for advanced non-small-cell lung cancer. N Engl J Med. 2002;346(2):92–98. | ||
Nascimento AV, Bousbaa H, Ferreira D, Sarmento B. Non-small cell lung carcinoma: an overview on targeted therapy. Curr Drug Targets. 2015;16(13):1448–1463. | ||
Garbuzenko OB, Saad M, Pozharov VP, Reuhl KR, Mainelis G, Minko T. Inhibition of lung tumor growth by complex pulmonary delivery of drugs with oligonucleotides as suppressors of cellular resistance. Proc Natl Acad Sci U S A. 2010;107(23):10737–10742. | ||
Rowinsky EK, Onetto N, Canetta RM, Arbuck SG. Taxol: the first of the taxanes, an important new class of antitumor agents. Semin Oncol. 1992;19(6):646–662. | ||
Václavíková R, Horský S, Simek P, Gut I. Paclitaxel metabolism in rat and human liver microsomes is inhibited by phenolic antioxidants. Naunyn Schmiedebergs Arch Pharmacol. 2003;368(3):200–209. | ||
Zhong Y, Goltsche K, Cheng L, et al. Hyaluronic acid-shelled acid-activatable paclitaxel prodrug micelles effectively target and treat CD44-overexpressing human breast tumor xenografts in vivo. Biomaterials. 2016;84:250–261. | ||
Wang X, Chen Y, Dahmani FZ, Yin L, Zhou J, Yao J. Amphiphilic carboxymethyl chitosan-quercetin conjugate with P-gp inhibitory properties for oral delivery of paclitaxel. Biomaterials. 2014;35(26):7654–7665. | ||
Wang SQ, Liu ST, Zhao BX, et al. Afatinib reverses multidrug resistance in ovarian cancer via dually inhibiting ATP binding cassette subfamily B member 1. Oncotarget. 2015;6(28):26142–26160. | ||
Ramasamy T, Kim J, Choi HG, Yong CS, Kim JO. Novel dual drug-loaded block ionomer complex micelles for enhancing the efficacy of chemotherapy treatments. J Biomed Nanotechnol. 2014;10(7):1304–1312. | ||
Yuan Z, Wang H, Hu Z, et al. Quercetin inhibits proliferation and drug resistance in KB/VCR oral cancer cells and enhances its sensitivity to vincristine. Nutr Cancer. 2015;67(1):126–136. | ||
Yang D, Wang T, Su Z, Xue L, Mo R, Zhang C. Reversing cancer multidrug resistance in xenograft models via orchestrating multiple actions of functional mesoporous silica nanoparticles. ACS Appl Mater Interfaces. 2016;8(34):22431–22441. | ||
Shen J, Zhang W, Wu J, Zhu Y. The synergistic reversal effect of multidrug resistance by quercetin and hyperthermia in doxorubicin-resistant human myelogenous leukemia cells. Int J Hyperthermia. 2008;24(2):151–159. | ||
El-Gogary RI, Rubio N, Wang JT, et al. Polyethylene glycol conjugated polymeric nanocapsules for targeted delivery of quercetin to folate-expressing cancer cells in vitro and in vivo. ACS Nano. 2014;8(2):1384–1401. | ||
Lv L, Liu C, Chen C, et al. Quercetin and doxorubicin co-encapsulated biotin receptor-targeting nanoparticles for minimizing drug resistance in breast cancer. Oncotarget. 2016;7(22):32184–32199. | ||
Tan WF, Lin LP, Li MH, et al. Quercetin, a dietary-derived flavonoid, possesses antiangiogenic potential. Eur J Pharmacol. 2003;459(2–3):255–262. | ||
Chen JY, Hu RY, Chou HC. Quercetin-induced cardioprotection against doxorubicin cytotoxicity. J Biomed Sci. 2013;20:95. | ||
Bu T, Mi Y, Zeng W, Zhang C. Protective effect of quercetin on cadmium-induced oxidative toxicity on germ cells in male mice. Anat Rec (Hoboken). 2011;294(3):520–526. | ||
Cooray HC, Janvilisri T, van Veen HW, Hladky SB, Barrand MA. Interaction of the breast cancer resistance protein with plant polyphenols. Biochem Biophys Res Commun. 2004;317(1):269–275. | ||
Kumar GN, Walle UK, Walle T. Cytochrome P450 3A-mediated human liver microsomal taxol 6 alpha-hydroxylation. J Pharmacol Exp Ther. 1994;268(3):1160–1165. | ||
Limtrakul P, Khantamat O, Pintha K. Inhibition of P-glycoprotein function and expression by kaempferol and quercetin. J Chemother. 2005;17(1):86–95. | ||
Choi JS, Jo BW. Enhanced paclitaxel bioavailability after oral administration of pegylated paclitaxel prodrug for oral delivery in rats. Int J Pharm. 2004;280(1–2):221–227. | ||
Lockhart JN, Stevens DM, Beezer DB, Kravitz A, Harth E. Dual drug delivery of tamoxifen and quercetin: regulated metabolism for anticancer treatment with nanosponges. J Control Release. 2015;220(Pt B):751–757. | ||
Lee SH, Lee EJ, Min KH, et al. Quercetin enhances chemosensitivity to gemcitabine in lung cancer cells by inhibiting heat shock protein 70 expression. Clin Lung Cancer. 2015;16(6):e235–e243. | ||
Saha C, Kaushik A, Das A, Pal S, Majumder D. Anthracycline drugs on modified surface of quercetin-loaded polymer nanoparticles: a dual drug delivery model for cancer treatment. PLoS One. 2016;11(5):e0155710. | ||
Cote B, Carlson LJ, Rao DA, Alani AWG. Combinatorial resveratrol and quercetin polymeric micelles mitigate doxorubicin induced cardiotoxicity in vitro and in vivo. J Control Release. 2015;213:128–133. | ||
Saremi S, Atyabi F, Akhlaghi SP, Ostad SN, Dinarvand R. Thiolated chitosan nanoparticles for enhancing oral absorption of docetaxel: preparation, in vitro and ex vivo evaluation. Int J Nanomedicine. 2011;6:119–128. | ||
Saravanakumar G, Min KH, Min DS, et al. Hydrotropic oligomer-conjugated glycol chitosan as a carrier of paclitaxel: synthesis, characterization, and in vivo biodistribution. J Control Release. 2009;140(3):210–217. | ||
Li H, Zhao X, Ma Y, Zhai G, Li L, Lou H. Enhancement of gastrointestinal absorption of quercetin by solid lipid nanoparticles. J Control Release. 2009;133(3):238–244. | ||
Suksiriworapong J, Phoca K, Ngamsom S, Sripha K, Moongkarndi P, Junyaprasert VB. Comparison of poly(ε-caprolactone) chain lengths of poly(ε-caprolactone)-co-d-α-tocopheryl-poly(ethylene glycol) 1000 succinate nanoparticles for enhancement of quercetin delivery to SKBR3 breast cancer cells. Eur J Pharm Biopharm. 2016;101:15–24. | ||
Koo H, Min KH, Lee SC, et al. Enhanced drug-loading and therapeutic efficacy of hydrotropic oligomer-conjugated glycol chitosan nanoparticles for tumor-targeted paclitaxel delivery. J Control Release. 2013;172(3):823–831. | ||
Wang BL, Gao X, Men K, et al. Treating acute cystitis with biodegradable micelle-encapsulated quercetin. Int J Nanomedicine. 2012;7:2239–2247. | ||
Lucke A, Tessmar J, Schnell E, Schmeer G, Göpferich A. Biodegradable poly(D,L-lactic acid)-poly(ethylene glycol)-monomethyl ether diblock copolymers: structures and surface properties relevant to their use as biomaterials. Biomaterials. 2000;21(23):2361–2370. | ||
Pooja D, Babu Bikkina DJ, Kulhari H, et al. Fabrication, characterization and bioevaluation of silibinin loaded chitosan nanoparticles. Int J Biol Macromol. 2014;69:267–273. | ||
Layek B, Haldar MK, Sharma G, Lipp L, Mallik S, Singh J. Hexanoic acid and polyethylene glycol double grafted amphiphilic chitosan for enhanced gene delivery: influence of hydrophobic and hydrophilic substitution degree. Mol Pharm. 2014;11(3):982–994. | ||
Dellera E, Bonferoni MC, Sandri G, et al. Development of chitosan oleate ionic micelles loaded with silver sulfadiazine to be associated with platelet lysate for application in wound healing. Eur J Pharm Biopharm. 2014;88(3):643–650. | ||
Zhang J, Chen XG, Sun GZ, Huang L, Cheng XJ. Effect of molecular weight on the oleoyl-chitosan nanoparticles as carriers for doxorubicin. Colloids Surf B Biointerfaces. 2010;77(2):125–130. | ||
Lee CM, Jang D, Kim J, et al. Oleyl-chitosan nanoparticles based on a dual probe for optical/MR imaging in vivo. Bioconjug Chem. 2011;22(2):186–192. | ||
Zhang WF, Chen XG, Li PW, He QZ, Zhou HY. Preparation and characterization of theophylline loaded chitosan/beta-cyclodextrin microspheres. J Mater Sci Mater Med. 2008;19(1):305–310. | ||
Pilcer G, Amighi K. Formulation strategy and use of excipients in pulmonary drug delivery. Int J Pharm. 2010;392(1–2):1–19. | ||
El-Sherbiny IM, Smyth HD. Controlled release pulmonary administration of curcumin using swellable biocompatible microparticles. Mol Pharm. 2012;9(2):269–280. | ||
Vadakkan MV, Binil Raj SS, Kartha CC, Vinod Kumar GS. Cationic, amphiphilic dextran nanomicellar clusters as an excipient for dry powder inhaler formulation. Acta Biomater. 2015;23:172–188. | ||
Le Tien C, Lacroix M, Ispas-Szabo P, Mateescu MA. N-acylated chitosan: hydrophobic matrices for controlled drug release. J Control Release. 2003;93(1):1–13. | ||
Fiegel J, Fu J, Hanes J. Poly(ether-anhydride) dry powder aerosols for sustained drug delivery in the lungs. J Control Release. 2004;96(3):411–423. | ||
Alfagih I, Kunda N, Alanazi F, et al. Pulmonary delivery of proteins using nanocomposite microcarriers. J Pharm Sci. 2015;104(12):4386–4398. | ||
Maya S, Kumar LG, Sarmento B, et al. Cetuximab conjugated O-carboxymethyl chitosan nanoparticles for targeting EGFR overexpressing cancer cells. Carbohydr Polym. 2013;93(2):661–669. | ||
Anitha A, Chennazhi KP, Nair SV, Jayakumar R. 5-Flourouracil loaded N,O-carboxymethyl chitosan nanoparticles as an anticancer nanomedicine for breast cancer. J Biomed Nanotechnol. 2012;8(1):29–42. | ||
Feng ZQ, Sun CG, Zheng ZJ, Hu ZB, Mu DZ, Zhang WF. Optimization of spray-drying conditions and pharmacodynamics study of theophylline/chitosan/β-cyclodextrin microspheres. Drying Technol. 2015;33(1):55–65. | ||
Sharma K, Somavarapu S, Colombani A, Govind N, Taylor KM. Nebulised siRNA encapsulated crosslinked chitosan nanoparticles for pulmonary delivery. Int J Pharm. 2013;455(1–2):241–247. | ||
Jaiswal MK, Banerjee R, Pradhan P, Bahadur D. Thermal behavior of magnetically modalized poly(N-isopropylacrylamide)-chitosan based nanohydrogel. Colloids Surf B Biointerfaces. 2010;81(1):185–194. | ||
Lee HY, Jeong YI, Choi KC. Hair dye-incorporated poly-γ-glutamic acid/glycol chitosan nanoparticles based on ion-complex formation. Int J Nanomedicine. 2011;6:2879–2888. | ||
Prabaharan M, Reis RL, Mano JF. Carboxymethyl chitosan-graft-phosphatidylethanolamine: amphiphilic matrices for controlled drug delivery. React Funct Polym. 2007;67(1):43–52. | ||
Tummala S, Gowthamarajan K, Satish Kumar MN, Wadhwani A. Oxaliplatin immuno hybrid nanoparticles for active targeting: an approach for enhanced apoptotic activity and drug delivery to colorectal tumors. Drug Deliv. 2016;23(5):1773–1787. |
 © 2017 The Author(s). This work is published and licensed by Dove Medical Press Limited. The
full terms of this license are available at https://www.dovepress.com/terms
and incorporate the Creative Commons Attribution
- Non Commercial (unported, 3.0) License.
By accessing the work you hereby accept the Terms. Non-commercial uses of the work are permitted
without any further permission from Dove Medical Press Limited, provided the work is properly
attributed. For permission for commercial use of this work, please see paragraphs 4.2 and 5 of our Terms.
© 2017 The Author(s). This work is published and licensed by Dove Medical Press Limited. The
full terms of this license are available at https://www.dovepress.com/terms
and incorporate the Creative Commons Attribution
- Non Commercial (unported, 3.0) License.
By accessing the work you hereby accept the Terms. Non-commercial uses of the work are permitted
without any further permission from Dove Medical Press Limited, provided the work is properly
attributed. For permission for commercial use of this work, please see paragraphs 4.2 and 5 of our Terms.