Back to Archived Journals » Open Access Journal of Sports Medicine » Volume 6
Pacing accuracy during an incremental step test in adolescent swimmers
Authors Scruton A, Baker J, Roberts J, Basevitch I, Merzbach V ![]() , Gordon D
, Gordon D
Received 18 March 2015
Accepted for publication 4 June 2015
Published 3 August 2015 Volume 2015:6 Pages 249—257
DOI https://doi.org/10.2147/OAJSM.S84906
Checked for plagiarism Yes
Review by Single anonymous peer review
Peer reviewer comments 3
Editor who approved publication: Professor Freddie H Fu
Adrian Scruton, James Baker, Justin Roberts, Itay Basevitch, Viviane Merzbach, Dan Gordon
Sport and Exercise Sciences Research Group, Anglia Ruskin University, Cambridge, UK
Abstract: To assess pacing accuracy in a group of adolescent swimmers during an incremental step test. Fifteen well-trained swimmers (age 15±1.5 years; height 170.2±8.8 cm; mass 60.2±6.6 kg), completed two 7×200 m tests, separated by ~72 hours. They swam to a predetermined incrementally increasing pace per step and were instructed to swim at even pace. Upon completion of each step, rating of perceived exertion, heart rate and blood lactate were recorded. Significant differences observed for both trials between actual and predicted swim time (P<0.05). Significant differences also observed between the first and second 100 m of each step in trial 1 for step 1 (P=0.001, effect size [ES] =0.54), step 2 (P=0.0001, ES =0.57), step 4 (P=0.0001, ES =0.53), step 5 (P=0.005, ES =0.65), step 6 (P=0.0001, ES =0.50), and step 7 (P=0.0001, ES =0.70). Similar responses witnessed for trial 2 (P<0.05). Findings suggest that the finite anaerobic capacity was engaged sooner than would normally be anticipated, as a function of an inability to regulate pace. This is proposed to be a consequence of the volume of exposure to the biological and psychological sensations and cognitive developmental status. Given the apparent error in pacing judgment exhibited in this population group, caution should be applied when adopting such tests to monitor training responses with adolescent athletes, and alternate means of modulating pace be investigated.
Keywords: effort regulation, children, exercise testing, perception
Introduction
The ability to regulate pace (during swimming) is dependent upon the ability of the individual to make prospective judgments (cognitive) regarding the metabolic demands of the exercise challenge against their actual metabolic capacity.1 Pacing strategies during exercise have been attributed to optimizing the balance between the artifacts of fatigue and the regulation of substrate metabolism. Thus, modulations in pace, which are a function of biologically and cognitively orchestrated afferent signals, and the consequent homeostatically orientated efferent responses are manifest in order to prevent a complete depletion of the finite anaerobic capacity.2,3 This cognitive judgment is set within the context of a continuum of information from the ability to anticipate the metabolic demands and to select an appropriate strategy through the accumulation of prior experience for completion of such a task that has a known end point.1,4,5
The significance of prior experience to the pacing paradigm was recently exemplified in works that demonstrated enhanced pace modulation and effort control in individuals, who were more experienced and well-trained than less-experienced counterparts.6 Indeed, the discriminating factor between the two groups with reference to experience was the volume of training that had been accumulated which was associated with greater exposure to the sensations of pain and fatigue and the ability to make prospective judgments.
Recent works1,7 have demonstrated that pacing strategies in children are associated with the stage of cognitive development. Specifically, younger schoolchildren (5–6 years) exhibited a negative-based pacing strategy which was associated with a less developed cognitive template suggesting an inability to anticipate the exercise challenge. While in older children (12–14 years), a U-shaped pacing strategy was evident, symptomatic of faster speeds at the beginning and end of the challenge, which is associated with a more conservative approach to effort regulation. This U-shaped response was exemplified in a recent study of adolescent competitive swimmers, with a mean age of 16.9±2.1 years who demonstrated stable pacing strategies during both simulated and actual competition conditions.8 Thus, uncontrolled pacing is refractory to performance and associated with increased physical effort and physiological strain resulting in either a decrement in exercise intensity or a failure to compensate for lost time.9–11
The blood lactate (BLa) response to exercise is a commonly used criterion of both endurance capacity and the physiological responses to endurance-based training. It is the primary variable of importance, to both athletes and coaches, as the lactate turn-point (LtP) represents the sudden and sustained elevation of the BLa response to exercise, and hence indicates the aerobic capacity of the athlete.12 While this point has been shown to be a highly indicative predictor of endurance performance,13,14 it also responds in a positive manner to training by a rightward and downward shift of the profile in relation to exercise intensity. The use and interpretation of BLa profiles for propulsive sports, such as cycling, running, and rowing, are well documented and are typically characterized by the use of controlled environments and calibrated ergometers that can be used to either control the intensity of effort (running), adjust to the applied effort (cycling), or provide instant information on effort (rowing).
Swimming, however, confronts the coach and physiologist with a unique set of challenges, not least that the effort applied by the swimmer is highly dependent on their ability to maintain a constant pace. Hence, the typical approach adopted when assessing the aerobic capacity in swimmers is to use an incremental step test of 7×200 m, with each increment requiring the swimmer to maintain an even-paced and controlled effort, based on predetermined times, factored against their personal best for 200 m.15,16 Therefore, an uncontrolled pacing strategy, during an incremental step test in the swimming pool, would manifest unreliable BLa scores, resulting in a misinterpretation of the BLa response to exercise and hence the LtP. An a priori hypothesis is thus established based on the predication that pacing is adopted in order to module substrate utilization across an exercise challenge and to ensure that the finite anaerobic capacity does not become fully depleted.2,17 Furthermore, it was speculated that as optimal pacing strategies are a function of accumulated prior experience and cognitive development, that in a group of adolescent swimmers who have had limited exposure to such a test and have not amassed prior experiences that they would display an inability to optimize pace. Therefore, the purpose of this study was to examine whether adolescent swimmers were able to regulate pace and effort control during an incremental step test for determination of BLa and heart rate (HR) responses and to ascertain if these responses were replicable across duplicate trials.
Methods
Participants
Following local institutional ethical approval (Anglia Ruskin University, Cambridge, UK) and having provided written and informed assent with parental consent n=15 adolescent National Age Group, swimmers volunteered and agreed to participate (age 15±1.5 years; height 170.2±8.8 cm; mass 60.2±6.6 kg). If any participant indicated a contraindication to exercise such as asthma, recent infection, or hypertension, they were excluded from the study. The range of weekly distances covered by this group in the swimming pool varied between 26,000 and 33,000 m, and at the time of participation, all of the swimmers were in the second macro-cycle (large period of training) of the preparatory phase of their annual training plan. The participants were recruited from a range of swim teams and were part of a county (regional) training group. At the time of undertaking the tests, the personal best times for 200 m were 140.7±9.5 seconds. Importantly, prior to this study, none of the participants had completed a step test such as that adopted, but were all regularly exposed to repeated efforts over 200 m.
Study design
The 7×200 m incremental step test was completed in a 25 m swimming pool with all participants completing the two trials, referred to as trial 1 (TR-1) and trial 2 (TR-2) at the same time of day, so as to minimize diurnal variation, with each visit separated by at least 72 hours, but no longer than 96 hours.
Incremental step test
Prior to the start of each testing session, a capillary blood sample was collected from the earlobe with the participant sat quietly on the pool deck for the determination of a pre-trial resting BLa (mM) score. All participants completed a prescribed warm-up of 1,000 m, which consisted of some steady whole body work, sets of arms and legs only work, and some acceleration and speed drills. The participants each completed an incremental step test of 7×200 m according to the methods established by Pyne et al.16 These swims are graded in effort from easy (step 1) to maximal effort (step 7) and were completed on a 5-minute duty-cycle. The pace required for each step was established against the participants’ current personal best time for 200 m freestyle. Five seconds were then added to the personal best time to take into account the push start off the wall, and this newly calculated time was the predicted time for step 7 (maximal effort). To calculate the pace required for step 1, 30 seconds were added to the target time for step 7. In order to determine the target times for the remaining efforts, each was to be completed at a pace that was 5 seconds faster than the preceding trial. Therefore, as the participant was required to swim faster for each successive trial, so recovery duration increased by 5 seconds.
For each increment, the participants swam in pairs with the onset of their respective effort staggered by 90 seconds. Prior to the start of each increment, the swimmer was informed of the target pace time, and to assist them during the respective step, their 100 m split time was orally conveyed to them. They were also instructed to try and complete each effort using an even-paced strategy. Upon completion of each swim, both HRs (b·min−1) (Polar 810S, Polar Electro Oy, Kempele, Finland) using 5 seconds averaging and rating of perceived exertion (RPE) (6–20 scales) were recorded, and the swimmer exited the swimming pool to allow for the collection of an earlobe capillary blood sample (5 μL) (Lactate Pro, Arkray, Kyoto, Japan) for the determination of BLa concentration. During the recovery block between efforts, the swimmers were encouraged to keep warm and hydrated.
For each participant, the BLa concentration (mM) was plotted against swim speed (m · s−1) which was taken as the average per 100 m during each of the 200 m trials. The LtP (LT2) was then determined through a visual inspection of the curve by two independent physiologists looking for a sudden and continual rise in the BLa concentration in relation to exercise intensity. Additionally, the speed corresponding to the 4 mM BLa concentration was also ascertained according to the methods of Pyne et al.16
Statistical analysis
All data are expressed as mean ± SD. An analysis was made of the difference between actual swim speed and the predicted swim pace for each step of the 7×200 m incremental step test for both TR-1 and TR-2 using paired t-tests. For the comparison between TR-1 and TR-2, analysis was made of the individual step responses both between trials and also in comparison with the predicted swim speeds. Using Levene’s test for homogeneity of variance, the data were shown to be both normally distributed and homogenous, as this was the case, a series of repeated measures t-tests were applied. As the RPE data are nonparametric, a repeated measures Wilcoxon signed-rank test was used. To assess the association between the BLa responses and swim speeds, Pearson correlation coefficients were introduced. Additionally, the magnitude of treatment was determined through the effect size (ES) according to Cohen’s d, where an effect ≤0.2 is deemed small, between 0.3 and 0.8 is deemed medium, and ≥0.9 is deemed large. For all statistical analyses, the alpha level was set at P<0.05 and was completed using SPSS version 19 (IBM Corporation, Armonk, NY, USA).
Results
Effort regulation during TR-1 and TR-2
For each swimmer, a comparison was made between their predicted swim time and their recorded swim for each step of the test. Table 1 shows the differences between predicted and recorded swim times across the seven steps of the incremental tests. For TR-1, significant differences were observed between actual swim speed and predicted swim speed for step 1 (P=0.03, ES =0.45), step 2 (P=0.001, ES =0.31), step 3 (P=0.007, ES =0.22), and step 7 (P=0.012, ES =0.40). Additionally, small ES response observed for step 5 (ES =0.22). These data suggest that the participants were swimming too fast during the earlier trials, in relation to the predicted times and too slow in the later trials as highlighted graphically in Figure 1. Additionally, significant inverse correlations were observed between the BLa concentration (mM) and actual swim speed for step 3 (r=−0.74), step 6 (r=−0.56), and step 7 (r=−0.44). Significant differences shown in Table 2 were observed when considering the swim speed for the first and second 100 m of each stage of the test, step 1 (P=0.001, ES =0.54), step 2 (P=0.0001, ES =0.57), step 4 (P=0.0001, ES =0.53), step 5 (P=0.005, ES =0.65), step 6 (P=0.0001, ES =0.50), and step 7 (P=0.0001, ES =0.70), whereas step 3 showed only a small magnitude of effect. The RPE showed a uniform progressive increase with the mean responses of 10±1, 11±2, 12±1, 13±1, 15±1, 17±1, and 19±1 for steps 1–7, respectively.
 | Table 1 Comparison of predicted swim time in relation to recorded swim time |
 | Figure 1 Changes in the recorded swim times (▲) in relation to predicted swim times (■) over the seven steps of the incremental step test for TR-1. |
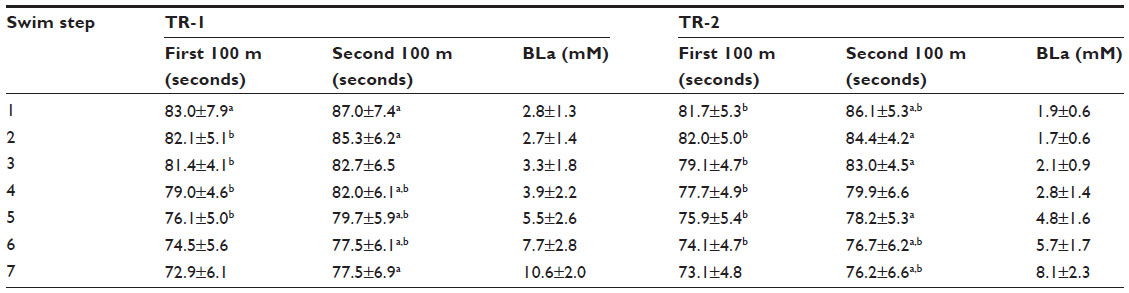 | Table 2 Comparison of swim times and blood lactate (BLa) (mean ± SD) for the first and second 100 m of each 200 m trial of the incremental step test for TR-1 and TR-2 |
As with TR-1, significant differences were observed between the predicted and recorded swim times for TR-2 for step 1 (P=0.001, ES =0.85), step 2 (P=0.006, ES =0.48), step 3 (P=0.007, ES =0.42), step 4 (P=0.007, ES =0.32), step 5 (P=0.023, ES =0.17), and step 7 (P=0.020, ES =0.33) as shown in Figure 2. Furthermore, as shown in Table 2, significant differences were observed when comparing the swim speeds of the first and second 100 m of each stage for step 1 (P=0.001, ES =0.90), step 2 (P=0.006, ES =0.51), step 3 (P=0.0001, ES =0.85), step 5 (P=0.002, ES =0.43), step 6 (P=0.003, ES =0.48), and step 7 (P=0.003, ES =0.53). The RPE showed a similar response to that of TR-1 rising from 12±2 for step 1 through to 20±0 for step 7. Nonsignificant differences were observed across steps 1–7 between TR-1 and TR-2 for RPE (P>0.05). Additionally, when comparing the swim times between TR-1 and TR-2 over steps 1–7, significant differences were observed only for two of the steps: step 4 (P=0.0001, ES =0.36) and step 5 (P=0.03, ES =0.20).
 | Figure 2 Changes in the recorded swim times (▲) in relation to predicted swim times (■) over the seven steps of the incremental step test for TR-2. |
The mean-predicted pace for the first and second 100 m of each step was 87.9±4.9, 85.4±4.7, 82.8±4.7, 80.4±4.7, 77.8±4.7, 75.4±4.7, and 72.8±4.7 seconds for steps 1–7, respectively. Significant differences were observed in TR-1 between the first 100 m time and the actual time for step 1 (P=0.003, ES =0.69), step 2 (P=0.005, ES =0.59), step 3 (P=0.003, ES =0.25), step 4 (P=0.004, ES =0.23), step 5 (P=0.001, ES =0.31), whereas steps 6 and 7 showed nonsignificant differences (P>0.05). For the second 100 m of each 200 m step, nonsignificant differences were observed for steps 1, 2, and 3 (P>0.05) with significant difference observed for step 4 (P=0.01, ES =0.35), step 5 (P=0.001, ES =0.40), step 6 (P=0.003, ES =0.44), and step 7 (P=0.001, ES =0.82). For TR-2, similar responses were observed with significant differences evident between the target time for the first 100 m and the recorded for step 1 (P=0.0001, ES =1.25), step 2 (P=0.001, ES =0.69), step 3 (P=0.0001, ES =0.83), step 4 (P=0.001, ES =0.57), step 5 (P=0.002, ES =0.40), and step 6 (P=0.004, ES =0.28) with nonsignificant difference observed for step 7 (P>0.05). Significant differences were highlighted between the target time and the actual recorded for the second 100 m of each step for TR-2 for steps 1 (P=0.04, ES =0.40), step 6 (P=0.003, ES =0.24), and step 7 (P=0.006, ES =0.56), with nonsignificant differences observed for steps 2–5 (P>0.05).
In order to assess the variability of pace judgment/accuracy within any one step, we addressed the relationship between pace maintenance as expressed by SD ± average split time for the 200 m effort against the Δ predicted-recorded time (seconds) which reflects the accuracy of pace within a step. Significant inverse correlations were observed during TR-1 for step 4 (r=−0.56) and step 7 (r=−0.57) and during TR-2 for step 3 (r=−0.59), step 4 (r=−0.86), step 5 (r=−0.56), step 6 (r=−0.59), and step 7 (r=−0.86).
Blood lactate responses
The resting BLa and HR scores recorded prior to commencing the warm-up were 1.8±0.4 mM and 67.8±7.8 b·min−1, respectively for TR-1 and 1.4±0.8 mM and 68.8±6.4 b·min−1 for TR-2, with the BLa responses to the incremental step tests presented in Table 2 and Figures 3 and 4. For each swimmer, the BLa at LtP was determined along with the associated HR and swim speed. The resultant scores were 4.6±0.98 mM, 179.0±9.1 b · min−1 and 1.29±0.11 m · s−1 for TR-1 and 4.3±0.91 mM, 179.4±6.8 b · min−1 and 1.31±0.10 m · s−1 for TR-2, between trial means were not significantly different (P>0.05). Additionally and in accordance with the methods of Pyne et al,16 the speed at 4 mM BLa was determined for both TR-1 (78.0±5.2 seconds) and TR-2 (77.0±4.4 seconds), which were shown to be nonsignificantly different (P>0.05).
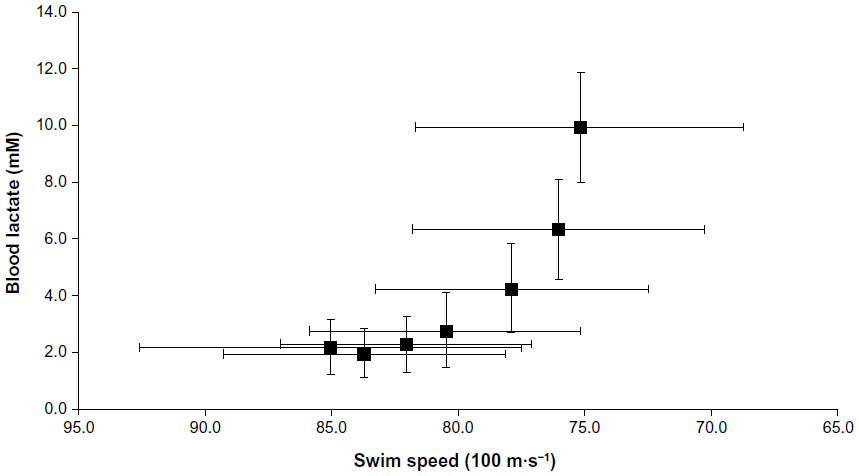 | Figure 3 Blood lactate responses for the whole group during the incremental step test for TR-1. |
 | Figure 4 Blood lactate responses for the whole group during the incremental step test for TR-2. |
Discussion
The findings support the previously stated hypothesis that pacing strategies are adopted so as to modulate substrate utilization across an exercise challenge and to ensure that the finite anaerobic capacity does not become fully depleted2,17 highlighting significant discrepancies in pace judgment in both TR-1 and TR-2, with the participants swimming too fast in the early stages and to slow in the later stages when expressed in comparison with the predicted target times.
Effort regulation during exercise is a function of the exercise endpoint (duration) and prior experience of the athlete. Thus, at the onset of exercise, the intensity is established against the perceptual template which is a function of prior experience and the afferent feedback.18 As such, pacing during an incremental step test such as that adopted in this study is dependent upon knowledge of the final endpoint for the exercise challenge which is a manifestation of the accumulated knowledge and experiences encountered throughout the totality of the exercise challenge, but also the end point for each step. Importantly, this group of participants were defined as “step test naïve” not having completed such a trial before, but were regularly exposed to repeated 200 m efforts interspersed with recovery periods as part of their training program. Indeed, it has recently been suggested that both initial and ongoing modulations in pace are functions of goal-directed decision-making7 which are dependent upon anticipation, planning, logical reasoning, and inhibition.19 Thus, in these adolescent swimmers, it is contended that although the goal of the two testing sessions was clarified, and feedback was provided after each step that the lack of both a previous perceptual template and prior experience especially for TR-1 rendered them impotent in relation to planning their pace regulation in a logical manner.
The data for both TR-1 and TR-2 show a similar response, of the participants swimming too fast against their prescribed pace for trials 1–4 and too slow against the prescribed pace for trials 5–7. In all instances, the data indicate that the participants exhibited uneven regulation of pace when comparing the outcome of the first and second 100 m of each step. For both trials, the participants would in the earlier steps swim faster than the prescribed pace for the first 100 m and then at the apportioned pace for the second 200 m. However, in the later trials 5–7, the participants would be close to the designated pace for the first 100 m and then significantly slower for the second 100 m. The pacing paradigm proposes that effort is regulated so as to prevent what has recently been described as a catastrophic collapse.20 Thus, the objective for pace modulation is to ensure that the finite anaerobic capacity never becomes fully depleted.2,21
Therefore, for step 1 with a mean difference in response time for TR-1 and TR-2 against the predicted time of 6.8±5.4 seconds, it is contended that the participants would have engaged the anaerobic energy pathways to a greater extent than the protocol would have anticipated. The implication of this would be a greater decrease in the finite reserves of the high energy phosphates (ATP-PCr) and substrate-level glycolysis and a concurrent increase in the intracellular metabolites H+, ADP, Pi, and K+.22 Hence, in the later stages of the test, the participants exhibited slower times owing to the decline in the finite anaerobic capacity and accumulation of the fatigue-related metabolites.
When the outcomes of TR-1 and TR-2 were examined, there were no significant differences between total swim time for each step and thus for the difference between swim time and predicted time. This is somewhat surprising given that the pacing paradigm is based on the accumulation of prior experiences (in this instance TR-1) and the associated exposure to the sensations of pain and fatigue, current physiological and psychological state (substrate availability, metabolic by-products, motivation, etc), and the perceptually regulated responses to the perceived exertion. However, this lack of pacing development was evident in recent work which explored manifestation of a pacing strategy in children aged 12–13 years,1 where it was shown that no learning effect was evident when comparing performance and distance covered during a running-based test. Indeed, it has been suggested that if there were a learning effect for pace present, it would be evident during the first 25%–50% of an event.21,23 However, in this study, significant differences were evident in TR-2 for steps 1–4, respectively (~50% of total test time) when comparing actual swim time with predicted time of 4.6±8.2, 2.5±2.9, 1.5±1.5, and −0.63±2.4 seconds, indicating that as with the work of Chinnasamy et al1 that the initial exposure to such an exercise challenge (TR-1) was perhaps not sufficient in these adolescent participants to engender a perceptually regulated pacing strategy.
The implications of these findings are far reaching. Certainly, the current findings concur with those of Chinnasamy et al1 regarding the inability of children and young adolescents to regulate pace, even after they have been exposed to the challenge previously. An extension of these findings was recently presented6 showing that pace was a function of experience when comparing recreational with collegiate runners, as highlighted by the smaller deviations in pace when compared with a series of prescribed speeds over 400 m efforts. Indeed, it was highlighted that in the recreational runners who had little experience of running at prescribed pace, that despite being presented with the same condition on three occasions there was little change in the deviation from pace. These findings taken with those of the current study and others1,7 suggesting that establishment of the pacing template is a function of both stage of intellectual development coupled with repeated exposure to the sensations of pain and fatigue associated with the exercise challenge.
The inability of the participants to modulate effort consistently both within and between each step of the incremental test would decrease the reliability of identifying the lactate–speed relationship16 through the raised variance between predicted and actual responses. As such a test and the performance/training derivatives are considered of importance within swimming and that pacing would appear to be compromised by both experience and intellectual development, alternate means of regulating pace should be sought. Various methods of modulating effort control during exercise have been investigated, such as the use of audible signals,24 very similar to the format adopted for the Multistage Fitness Test used for the indirect assessment of VO2max in runners and field games player’s and underwater pacing lights.25 Such approaches should be considered modus operandi for coaches and sports physiologists when working with children and adolescent swimmers, especially when there is no prior experience of having completed such a graded-exercise test. Such approaches would serve to both enhance the reliability of the data on a test–retest basis and further strengthen the validity of such a test in assessing exercise capacity in this specialist group.
Limitations and implications for future research
The findings from this study are though limited to this age group and level of swimming experience, both in relation to training volume and the number of times that the swimmer is exposed to such an incremental step test. However, the fact the data reflects a reduced pacing response between the two trials is of interest, and future work should monitor the response over a longer period time with a reflection on the accumulation of training volume and experience. Additionally, the sample size is relatively low, and a larger sample size across the age spectrum thus reflecting the stages of cognitive development would allow for a more insightful interpretation of when pacing strategies start to manifest.
Conclusion
This study demonstrated that a group of well-trained adolescent swimmers who were naïve to the sensations associated with completing the 7×200 m incremental step test were not able to regulate effort. Specifically, findings revealed that participants worked too hard, swam faster than the predicted pace during the initial stages, and swam too slow as a consequence of possibly engaging the finite anaerobic capacity sooner than would be expected during the test. Additionally, when repeating the test, the participants exhibited the same response of significant deviations in pace across the range of swim speeds. These data would suggest that the ability to regulate pace is a function of both the experience of the individual (volume of exposure to the associated biological and psychological sensations) and cognitive developmental status, and alternate means should be sought to ensure that the participants can modulate pace accordingly. Finally, thus, data suggest that the use of such a test in young adolescent swimmers who have not accrued a volume of training experience should not be exposed to such a test which requires pace judgment and effort regulation and alternate means of monitoring training responses be sought.
Acknowledgment
The findings of this research study were presented at the European College of Sports Science Conference (2015).
Disclosure
The authors report no conflicts of interest in this work.
References
Chinnasamy C, St Clair Gibson A, Micklewright D. Effect of spatial and temporal cues on athletic pacing in schoolchildren. Med Sci Sport Exerc. 2013;45:395–402. | |
Foster C, De Koning JJ, Hettinga F, Lampen J. Effect of competitive distance on energy expenditure during simulated competition. Int J Sport Med. 2004;25:198–204. | |
Stone MR, Thomas K, Wilkinson M, Jones AM, St Clair Gibson A, Thompson KG. Effects of deception on exercise performance: implications for determinants of fatigue in humans. Med Sci Sport Exerc. 2012;44:534–541. | |
Hampson DB, St Clair Gibson A, Lambert MI, Noakes TD. The influence of sensory cues on the perception of exertion during exercise and central regulation of exercise performance. Sport Med. 2001;31:935–952. | |
Tucker R, Noakes TD. The anticipatory regulation of performance: the physiological basis for pacing strategies and the development of a perception-based model for exercise performance. Br J Sport Med. 2009;43:392–400. | |
Green MJ, Sapp AL, Pritchett RC, Bishop PA. Pacing accuracy in collegiate and recreational runners. Eur J Appl Physiol. 2010;108:567–572. | |
Micklewright D, Angus C, Suddaby J, St Clair Gibson A, Sandercock G, Chinnasamy C. Pacing strategy in schoolchildren differs with age and cognitive development. Med Sci Sport Exerc. 2012;44:362–369. | |
Skorski S, Faude O, Rausch K, Meyer T. Reproducibility of pacing profiles in competitive swimmers. Int J Sport Med. 2012;34:152–157. | |
Foster C, Schrager M, Snyder AC, Thompson NN. Effect of pacing strategy on cycle time trial performance. Med Sci Sport Exerc. 1993;25:383–388. | |
Foster C, Schrager M, Snyder AC, Thompson NN. Pacing strategy and athletic performance. Sport Med. 1994;17:77–85. | |
Hettinga FJ, De Koning JJ, Broerson FT, Van Geffen P, Foster C. Pacing strategy and the occurrence of fatigue in 4000-m cycling time trials. Med Sci Sport Exerc. 2006;38:1484–1491. | |
Davis JA. Anaerobic threshold: review of the concept and directions for future research. Med Sci Sport Exerc. 1985;17:6–12. | |
Fry L, Londeree B, Lafontaine T, Volek MR. Physiological parameters related to distance running performance in female athletes. Med Sci Sport Exerc. 1989;21:319. | |
Zoladz JA, Sargeant AJ, Emmerich J, Stoklosa J, Zychowski A. Changes in acid-base status of marathon runners during an incremental field test: relationship to mean competitive marathon velocity. Eur J Appl Physiol. 1993;67:71–76. | |
Lakomy HKA, Peyrebrune MC. Aerobic Fitness Assessment: 7× 200-m Step Test. Loughborough: British Swimming; 2003 | |
Pyne D, Maw G, Goldsmith W. Protocols for the physiological assessment of swimmers. In: Gore C, editor. Physiological Tests for Elite Athletes. Champaign (IL): Human Kinetics; 2000:372–382. | |
Gordon D, Caddy O, Merzbach V, et al. Prior knowledge of trial number influences the incidence of plateau at VO2max. J Sport Sci Med. 2015;14:47–53. | |
Mauger A. Factors affecting the regulation of pacing: current perspectives. Open Access J Sport Med. 2014;5:209–214. | |
Piaget J. Intellectual evolution from adolescence to adulthood. Hum Dev. 1972;15:1–12. | |
de Koning JJ, Foster C, Bakkum, et al. Regulation of pacing during athletic competition. PLoS ONE. 2011;6:e15863. doi:10.137/journal.pone0015863. | |
Foster C, Hendrickson KJ, Peyer K. Pattern of developing the performance template. Br J Sport Med. 2009;43:765–769. | |
Essen B, Hagenfeldt L, Kaijser L. Utilisation of blood borne and intramuscular substrates during continuous and intermittent exercise in man. J Physiol. 1976;265:489–505. | |
Corbett J, Barwood MJ, Parkhouse K. Effect of task familiarisation on distribution of energy during a 2000-m cycling time trial. Br J Sport Med. 2009;43:770–774. | |
Lavoie JM, Leger LA, Leone M, Provencher PJ. A maximal multistage swim test to determine the functional and maximal aerobic power of competitive swimmers. J Swim Res. 1985;1:17–22. | |
Sano S, Bongbele J, Chatard JC, Lavoie JM. Evaluation of maximal aerobic velocity and prediction of performance in backstroke. In: MacLaren DP, Reilly T, Lees A, editors. Biomechanics and Medicine in Swimming: Swimming Science VI. London: E and FN Spon; 1990:285–288. |
 © 2015 The Author(s). This work is published and licensed by Dove Medical Press Limited. The
full terms of this license are available at https://www.dovepress.com/terms
and incorporate the Creative Commons Attribution
- Non Commercial (unported, 3.0) License.
By accessing the work you hereby accept the Terms. Non-commercial uses of the work are permitted
without any further permission from Dove Medical Press Limited, provided the work is properly
attributed. For permission for commercial use of this work, please see paragraphs 4.2 and 5 of our Terms.
© 2015 The Author(s). This work is published and licensed by Dove Medical Press Limited. The
full terms of this license are available at https://www.dovepress.com/terms
and incorporate the Creative Commons Attribution
- Non Commercial (unported, 3.0) License.
By accessing the work you hereby accept the Terms. Non-commercial uses of the work are permitted
without any further permission from Dove Medical Press Limited, provided the work is properly
attributed. For permission for commercial use of this work, please see paragraphs 4.2 and 5 of our Terms.