Back to Journals » Clinical Interventions in Aging » Volume 15
Osteosarcopenic Obesity Associated with Poor Physical Performance in the Elderly Chinese Community
Authors Ma Y, Zhang W, Han P, Kohzuki M, Guo Q ![]()
Received 24 April 2020
Accepted for publication 27 June 2020
Published 11 August 2020 Volume 2020:15 Pages 1343—1352
DOI https://doi.org/10.2147/CIA.S257739
Checked for plagiarism Yes
Review by Single anonymous peer review
Peer reviewer comments 2
Editor who approved publication: Dr Zhi-Ying Wu
Yixuan Ma,1 Wen Zhang,1,2 Peipei Han,3 Masahiro Kohzuki,1 Qi Guo3
1Department of Internal Medicine and Rehabilitation Science, Tohoku University Graduate School of Medicine, Tohoku University, Sendai, Japan; 2Department of Rehabilitation and Sports Medicine, Tianjin Medical University, Tianjin, People’s Republic of China; 3Department of Rehabilitation Medicine, Shanghai University of Medicine and Health Sciences, Shanghai, People’s Republic of China
Correspondence: Masahiro Kohzuki
Department of Internal Medicine and Rehabilitation Science, Tohoku University Graduate School of Medicine, Tohoku University, 1– 1 Seiryou-Cho, Aoba-Ku, Sendai 980– 8574, Japan
Email [email protected]
Qi Guo
Department of Rehabilitation Medicine, Shanghai University of Medicine and Health Sciences, No. 279 Zhouzhu Road, Pudong New Area, Shanghai 201318, People’s Republic of China
Tel/ Fax +86-22-8333-6977
Email [email protected]
Objective: The aims of this study were to investigate the association between osteosarcopenic obesity (OSO) and physical performance in Chinese elderly communities.
Methods: Our study population is comprised of residents of the Township Central Hospital in the suburban of Tianjin, China. Participants (n=303; percent body fat (PBF): ≥ 25% for men and ≥ 32% for women) were assessed using the direct segmental multi-frequency bioelectrical impedance analysis (BIA) for body composition. Sarcopenia was defined as the lower 20th percentile of appendicular skeletal muscle mass/height2 (ASMI). A quantitative ultrasound scan of each participants’ calcaneus with a T score≤− 1.0 was used to identify the prevalence of osteopenia/osteoporosis (OP). We divided people into four groups: obesity only (O), osteopenic obesity (OO), sarcopenic obesity (SO), and osteosarcopenic obesity (OSO). We assessed the physical performance by grip strength, 4-m walk test (WS) and timed up and go test (TUGT).
Results: A total of 303 participants had completed data (89 men, 214 women; mean age of 68.8± 6.0 years). The prevalence of OSO was 10.2% (men: 15.70%, women: 7.9%). After multiple adjustments, WS was significantly declined in OSO group when compared with the O group in men (mean value 95% CI was 0.84 (0.69, 0.99)) and women (mean value 95% CI was 0.93 (0.84, 1.02)). TUGT was significantly poorer in men (mean value 95% CI was 13.3 (10.6, 15.9)) and women (mean value 95% CI was 12.4 (11.2, 13.7)) with OSO when compared with the O group. Furthermore, the OSO group in women also had a significantly poorer TUGT compared with the OO group. The result of grip strength decreased significantly in women SO and OSO groups when compared with the O group (mean value 95% CI was 16.4 (14.5, 18.2) and 16.1 (13.9, 18.3)). But the results of grip strength in men showed no significant differences in any of the group.
Conclusion: In Chinese community-dwelling elderly, slower WS and lower balance function were associated with OSO in men and women. Lower grip strength was associated with SO and OSO in women.
Keywords: elder, osteosarcopenic obesity, physical performance
Introduction
Population ageing has become an ever-developing tendency. By 2050, the population of 60-year-old and above will make up 21.4% of the world population.1 Tackling the health problems of the age has become a major challenge. Recently, the concept of osteosarcopenic obesity (OSO) which characterized by the coexisting of osteopenia/osteoporosis (OP), sarcopenia, and obesity during the ageing population has been given special attention to process.2 Individuals with these conditions may experience a decline of physical performance in balance, walking speed, and diminished muscle strength,3–6 etc., which may lead to a high risk of falls, frailty or even mortality.7 However, despite the growing importance of OSO, studies evaluating the prevalence of OSO are still limited due to different diagnostic methods.8
Previous studies have shown that OP is the major cause of grip strength deterioration.9 It has also been proved that sarcopenia can lead to gait and daily activity difficulties,10 and that obesity can cause many chronic diseases and can predict slower walking speed11,12 in the elderly. Furthermore, a limited number of studies have proved that older people who have both sarcopenia and OP are more likely to have poor balance,13 and that sarcopenia combined with obesity can harm mobility in the elderly.14 It is important to note that all three conditions (sarcopenia, osteopenia/OP, obesity) are based on similar pathophysiological mechanism.15 Metabolic disorders caused by obesity may be associated with a reduction in myogenesis. Furthermore, the deteriorate of skeletal muscle protein synthesis and excessive inflammation caused by obesity can lead to impairment of skeletal muscle function and size, especially the muscle contract ability in the elderly.16–18 Some studies showed that OSO may be associated independently with poor Short Physical Performance Battery (SBBP)19 and decreased each leg stance time,20 but there is no research referring to balance measured by time up and go test (TUGT).21 According to what is mentioned above, it could be hypothesized that OSO is associated with substandard physical performance,22 where rare correlative studies have been conducted.2 To the extent of our knowledge, the prevalence of OSO is also increasing in older men. However, the current association of OSO and physical performance studies only focus on older women.19,20,23
Therefore, this study aims to investigate the relationship between OSO and physical performance (grip strength, 4-m walk test (WS), TUGT) in community-dwelling older men and women. The study is meaningful because after 2012, more than 70% of China’s elderly people lived in suburban counties.24
Methods
Study Participants
The total number of the elderly is 559 (≥60 yr.). All participants joined the National Free Physical Examination Program from January to March 2019 in the Hangu area of Tianjin, China. The exclusion criteria are as follows: (1) Medical records or history showing that they are suffering from diseases which affect bone or calcium metabolism; (2) Injury on foot, which cannot be tested for bone density or is unable to complete body composition measurements; (3) Communicative deficiency with interviewers or unwillingness to give informed consent. Finally, data collected from a total number of 303 older people who are obese (male: ≥25% female: ≥32%, percent body fat (PBF)) are evaluated.25 Figure 1 shows the classification of the participants in each group.
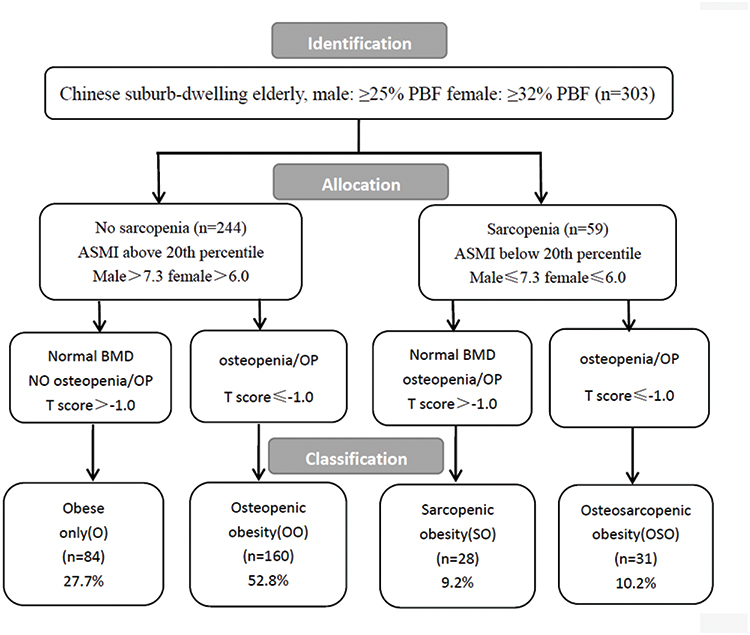 |
Figure 1 Flowchart showing the steps in identification, allocation, and the classification of participants in to each of the categories: obese only (O), osteopenic obese (OO), sarcopenic obese (SO), and osteosarcopenic obese (OSO) in a population of obese older people. |
Baseline Variables
We used the same methods as our previous study9 in interviewing participants. According to the difference in levels of hormones and physical ability, we categorized participants according to gender.26,27 Demographic variables and behavioral characteristics including age, gender, education level, smoking and drinking habits, as well as history of falls. A history of illness was obtained by participants’ responses (eg, hypertension). We also measured the BMI, waist–hip ratio (WHR) and physical activity according to the short form of the International Physical Activity Questionnaire (IPAQ).
Osteosarcopenic Obesity
For the diagnosis of OSO, the following three factors should be considered: (1) low muscle mass; (2) high PBF%; (3) osteopenia/OP.4
Body Composition
Body composition analysis adapts direct segmental multifrequency bioelectrical impedance analysis (BIA) (In-Body720; Biospace Co, Ltd, Seoul, Korea). This system uses different electrical frequencies (1, 5, 50, 250, 500, and 1000 kHz). Subjects were asked to place their five fingers on the surface of the electrode, with their heels and forefeet covering the round electrode. During the measurement, the subject should try to avoid shaking and touching other parts of the body. The measurements were recorded by well-trained staff and completed within 30s. This assessment was performed between 10am and 5pm. Participants were asked to be fasting and avoid drinking large amounts of water one hour before assessment. The BIA provided absolute values for appendicular skeletal muscle mass (ASM), skeletal muscle mass (SMM), total lean mass (TLM), fat-free mass (FFM), visceral fat area (VFA), PBF, and total body water (TBW).
Muscle Mass
The lower 20th percentile of appendicular skeletal muscle mass/height2 (ASMI) is one of the most commonly used criteria to define sarcopenia,28 which in the present sample corresponded to SMI, men≤7.3 kg/m2 and women≤6.0 kg/m2.
Body Fat
According to the standard cut-off point recommended by the American Council on Exercise (ACE), obesity is defined as follows: PBF ≥25% for men and ≥32% for women.25
Osteopenia/Osteoporosis
The BMD was measured at calcaneus by the quantitative ultrasound (QUS; OsteoPro UBD2002A, BMTECH; World Wide Co. Ltd., Seoul, Korea), using T-scores based on WHO criteria. These are obtained from automated equipment. T score ≤ −1 defined as osteopenia and OP.29
Performance-Based Assessment
The performance-based assessment includes grip strength, WS, and TUGT. The details are described in our previous study.30 Grip strength (kg) was measured using a handheld dynamometer (GRIP-D; Takei Ltd, Niigata, Japan). Participants were asked to try their maximum efforts with their dominant hands twice, and the average score obtained in the two trials was used as the final score. Gait function (speed) was assessed with the WS and dynamic balance was measured by TUGT. To measure WS, two photocells (a total distance of 4-meters) were placed at the beginning and the end to record the time. Participants were asked to walk at their usual speed after in the test and the average speed of two walks was recorded. The TUGT measured a total time of a series of actions for an individual, rise from a chair, walk 3 meters at their usual speed and turning around, walk back to the chair, and sit down again and lean back in a chair.
Statistical Analysis
The baseline characteristics with continuous variables were expressed as mean ± SD and categorical variables as an absolute number and percentage (%) of the total. Differences between variables were examined by ANOVA with Bonferroni correction (continuous variables) or by the chi-square test (categorical variables). Analysis of covariance (ANCOVA) was used to assess the relationship among obesity only (O), osteopenic obesity (OO), sarcopenic obesity (SO), osteosarcopenic obesity (OSO) groups and physical performance (grip strength, WS, TUGT). For model 1, age, and BMI were adjusted; for model 2 added adjustments for IPAQ, smoking and drinking status, educational≥9yr, history of falls and the number of diseases. The final multivariate logistic analysis was performed with the forced entry of all factors considered to be potential covariates. Means and 95% CI were calculated. All tests were two-tailed and P<0.05 was defined as statistically significant. All statistical analyses were performed using the Statistical Analysis System 9.3 edition for Windows (SAS Institute Inc., Gary, NC, USA).
Ethics
This research is approved by the Ethics Committee at Tianjin Medical University and the methods were carried out in accordance with the principles of the Declaration of Helsinki.
Results
Subjects Characteristics
The analytic sample is comprised by 303 obese participants (89 men, 214 women; mean age of 68.8±6.0 yrs). The incidence of O is 28.1% for men and 27.6% for women; in OO is 42.7% for men and 57.0% for women; in SO is 13.5% for men and 7.5% for women; in OSO is 15.7% for men and 7.9% for women. Data for body composition variables are presented in Table 1. Although we only included obese (PBF ≥ 25% for men and ≥32% for women) older adults in this study, it is worth mentioning that the OSO group had the lowest BMI (25.0 kg/m2) but their PBF% (34.0%) was the highest, which was significantly higher than either the OO or O group in older men. We also found that men with SO had a significantly lower BMI (25.0±2.5kg/m2) and higher PBF% (31.8%) compared with the O group. For older men, participants ASM (SO=19.2±2.0kg, OSO=18.4±2.0kg), SMM (SO=24.2±2.0kg, OSO=23.3±1.1kg), TLM (SO=42.5±3.4kg, OSO=41.0±1.7kg) and FFM (SO=45.0±3.7kg, OSO=43.4±1.8kg) were significantly decreased in both OSO and SO groups compared with OO and O groups (P<0.05). In women, we found that ASM (SO=12.9±1.4kg, OSO=13.1±0.6kg) and SMM (SO=17.2±1.5kg, OSO=17.8±0.4kg) were significantly decreased in both OSO and SO groups compared to OO and O groups (P<0.05). Also, the OO group had a significantly decreased SMM (21.8±2.2kg) compared with the O group. Women with OSO had a significantly decreased TLM (32.3±0.8kg) and FFM (34.3±0.9kg) compared with OO and O groups. These results confirmed the classification with and without sarcopenia is acceptable. We also found that OSO and SO group had a lower TBW level (P<0.05) compared with the O group in older men. In Table 2, although we observed that OO, SO were associated with reduced physical activity and that the OSO group had the lowest IPAQ scores in both men and women (men: O=4937.5±3876.8Mets×minutes/wk, OO=4330.0±2298.2Mets×minutes/wk, SO=4406.4±2390.6Mets×minutes/wk, OSO=2686.0±1941.2Mets×minutes/wk; women: O=5026.2±3763.9Mets×minutes/wk, OO=4698.9±3620.6Mets×minutes/wk, SO=4066.3±2386.2Mets×minutes/wk, OSO=2708.4±1910.6Mets×minutes/wk), but we did not find any statistical differences between any of the groups.
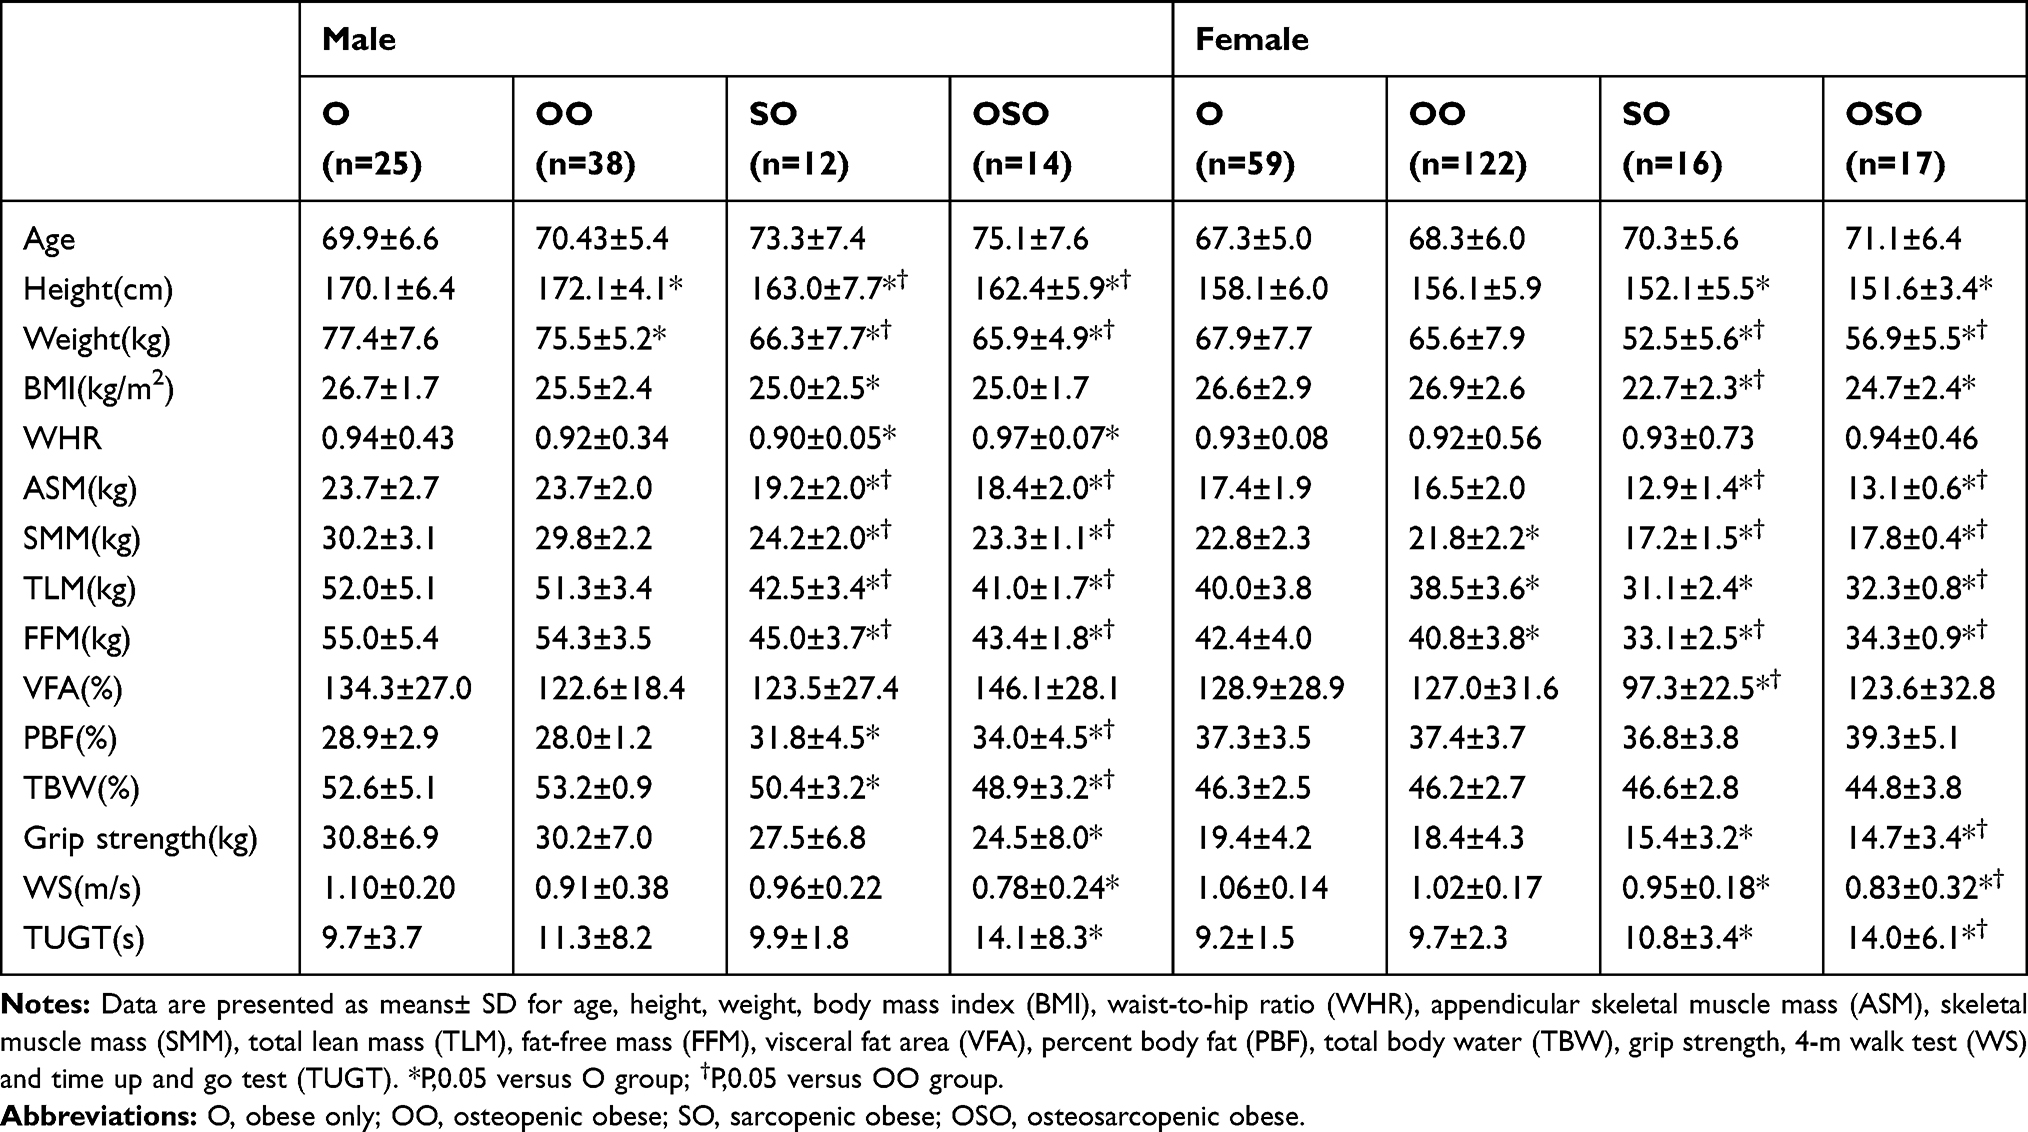 |
Table 1 Body Composition Variables and Physical Performance of Study Population by Gender |
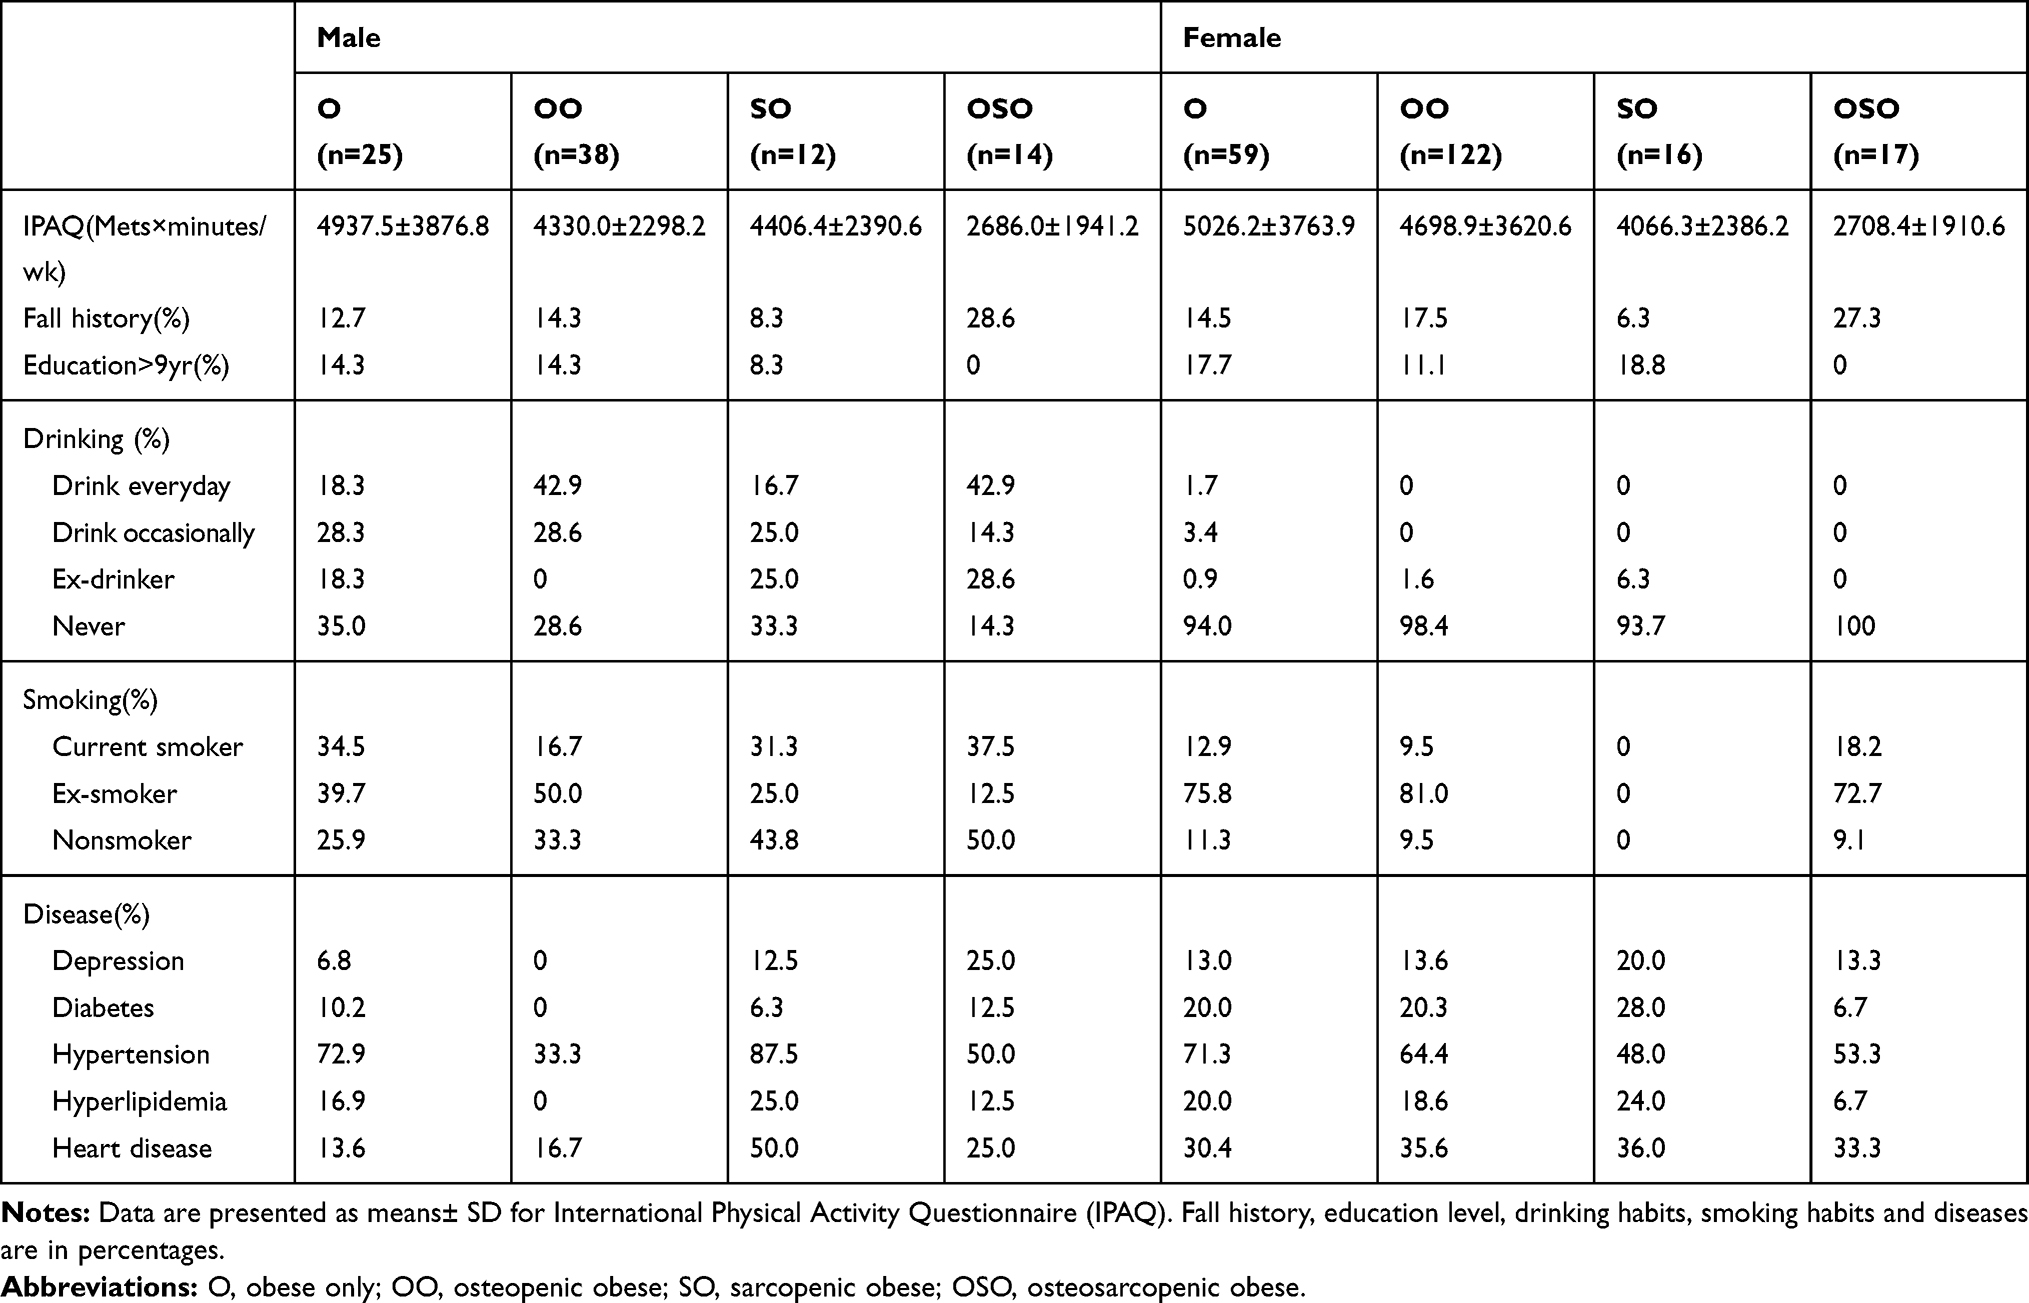 |
Table 2 Lifestyle Factors and Diseases of Study Population by Gender |
Physical Performance
Table 1 shows men with OSO had the worst grip strength (24.5±8.0kg), WS (0.78±0.24m/s) and TUGT (14.1±8.3s) compared with the O group. In women, the OSO group had the worst grip strength (14.7±3.4kg), WS (0.83±0.32m/s) and TUGT (14.0±6.1s) compared with O and OO groups. The SO group also have relatively poorer grip strength (15.4±3.2kg), WS (0.95±0.18m/s) and TUGT (10.8±3.4s) compared with the O group.
We further verified in Table 3. Firstly, we observed in men, after adjusted age, BMI in model 1, and final multivariate models, there is no significant association between OSO and grip strength in all groups. However, we observed that only the OSO group had a statistically significantly slower WS and longer time of TUGT compared with the O group in men. In the final multivariate models, the means (95% CI) for WS were 1.08 (1.02, 1.13) for O group, and 0.84 (0.69, 0.99) for OSO group and the means (95% CI) for TUGT were 9.08 (8.09, 10. 1) for O group and 13.3 (10.6, 15.9) for OSO group. In women, as is shown in Table 1, the value of BMI per group is significantly different. There are lower BMI in OSO and SO groups, which indicated that the higher BMI may contribute to better physical performance in those who suffered from OSO and SO. However, after adjusting model 1, significant relationships remained between SO and O, OSO and O groups. This indicated that the association between physical performance and OSO, SO were independent of BMI. We observed that women in SO and SOS groups have a significantly lower grip strength compared with those in O group, the means (95% CI) in multivariate models were 16.4 (14.5, 18.2) for SO, 16.1 (13.9, 18.3) for OSO, and 19.4 (18.6, 20.2) for O. In WS, the women participants were the same as that of men, only OSO group had a significantly slower WS compared with the O group, the means (95% CI) were 0.93 (0.84, 1.02) for OSO and 1.07 (1.04, 1.11) for O. An interesting result appears in TUGT, when adjusting for model 1, the OSO group had a significantly worse TUGT compared with O, OO and SO groups, after the multivariate model, the differences with the SO group disappeared. The means (95% CI) was 12.4 (11.2, 13.7) for OSO, 9.69 (9.08, 10.3) for OO, and 9.17 (8.73, 9.61) for O group.
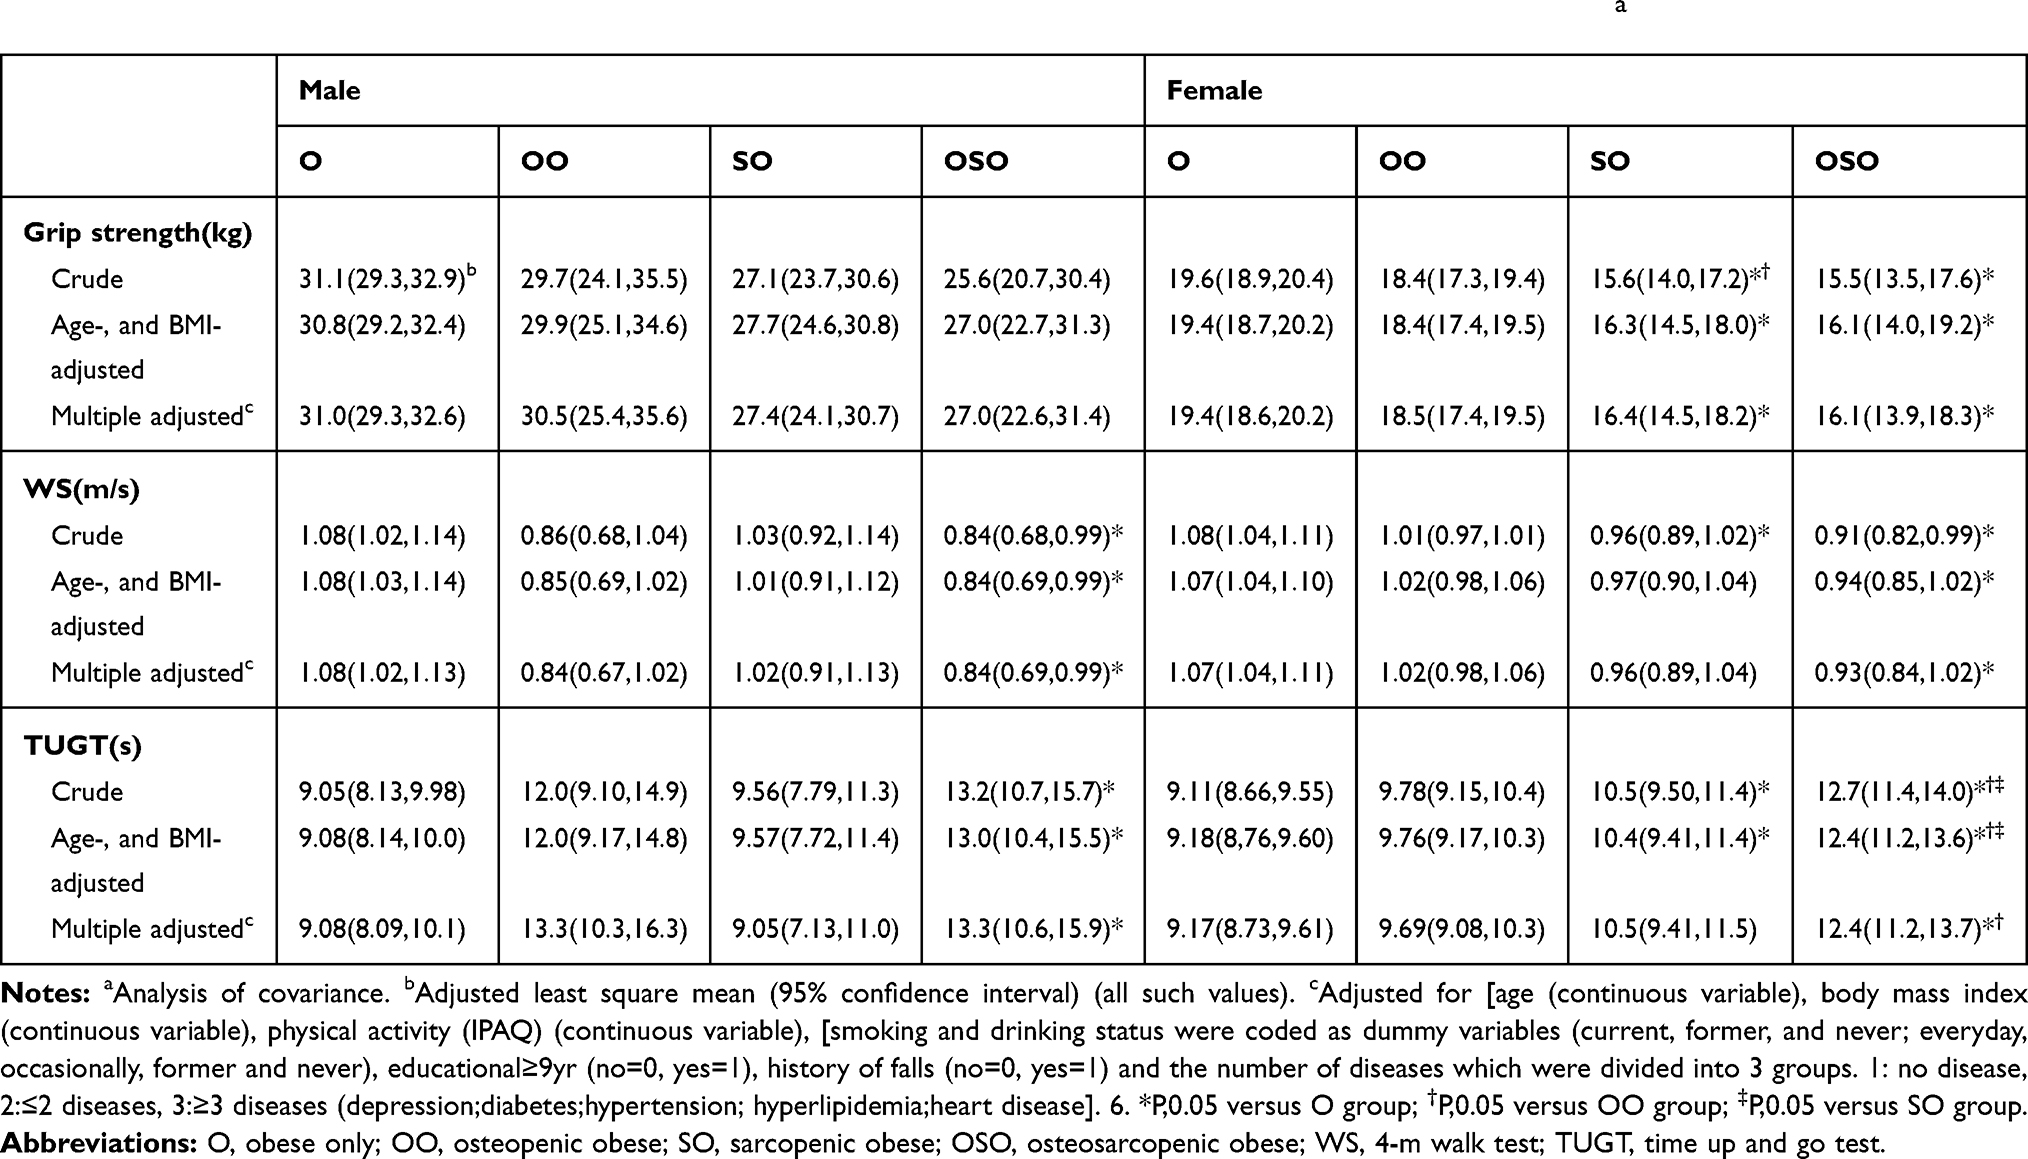 |
Table 3 Adjusted Relationships of Grip Strength, WS, and TUGT Among OO, so, OB and OSO Groupsa |
Discussion
This study aimed to determine the relationship between OSO and physical performance in community-dwelling elderly. To overcome the limitation of BMI definition of obesity in elderly individuals,31 we used the PBF% to classify obesity.
PBF% has been proved to be a better measure of obesity, which is characterized by an increase of fat mass.32 Also, a new concept of osteosarcopenic adiposity (OSA) has been implemented, it is suggested that OSO definition is not just overt overweight/obesity (BMI), special attention should also be paid to infiltrating fat in bone and redistributing fat in visceral area.33 For example, the reduction of muscle satellite cells caused by myosteatosis and the infiltration of bone marrow adipocytes.34,35 The incidence of OSO in this study is 10.2%, which is a little higher than a previous study in China (7.3%).8 Moreover, statistics also show that men comprised a higher proportion in SO (13.5%), whereas women comprised a higher proportion in OO (57.0%). An interesting finding in this study showed, different from women, men with OSO had a significantly higher PBF% and a lower muscle mass compared with O and OO groups, but their BMI values are not increasing in OSO group.33,36 In other words, OSO appears to be more associated with high-fat/low-muscle mass body composition types in men. This finding is also supported by a previous study, they found that senior males with OSO showed unfavorable body composition compared with their peers with SO, OO or O. The reason for this phenomenon probably caused by the low levels of testosterone impacted on FFM and SMM reductions and increased fat mass.37 Another interesting finding is based on obesity data, the prevalence of osteopenia/OP (63.0%) is significantly higher than sarcopenia (19.5%), which confirms that the pro-inflammatory state caused by excessive adiposity can deteriorate the bone mass.38
OSO and Physical Performance
This research establishes an independent association of OSO with physical performance in both older men and women. It is found that OSO is correlated with poor physical performance. The female participants in OSO and SO groups had significantly lower grip strength compared with those with O. Both men and women had a significantly slower WS in the OSO group compared with those in O group. Men had a significantly worse balance (TUGT) in the OSO group compared with those in O group. Furthermore, women had a significantly worse balance in the OSO group compared with those in O, OO and SO groups. Compared with single disease, the combined 3 diseases are more related to poor physical performance.15 The underlying mechanism might be related to the adipose infiltration in skeletal muscle in OSO patients, which caused the decrease of insulin secretion and testosterone levels, resulting in skeletal muscle weakness and lower extremity mobility disability.39 Furthermore, the joint pain caused by obesity and OP could lead to a sedentary behavior that worsens muscle weakness.40 This vicious circle among older people with OSO will lead to worse physical performance.15
OSO and Grip Strength
Grip strength is an important predictor of functional capacity in the elderly. It is positively correlated with ASM, and negatively correlated with the prevalence of OP and increased body fat.9,12 This cross-sectional study showed that grip strength was significantly lower in OSO and SO groups compared with the O group in women, but not in men. This result is consistent with a previous study indicating that postmenopausal women with OSO were associated with the lowest handgrip scores compared with those in O group.20 Sarcopenic obesity disease might be associated with a higher reducing muscle and a higher level of metabolic disorders than sarcopenia or obesity alone. In addition, it is noteworthy that only in crude model, the OO group had a significantly lower grip strength compared with the SO group in women, it may suggest that sarcopenia appears to be more associated with reduced grip strength than OP in older women.
However, no relationship between OSO and grip strength in men can be found in the study. Given the limited research between OSO and grip strength in older men, the reason of the differences between men and women in grip strength results might dues to the lack of estrogen in postmenopausal women, which will cause SMM decline.41 Nonetheless, the result is different from a study conducted on men. In a cross-sectional study from Greece,42 older men with OSO had a greater decline in muscle mass than older women with OSO. The reason might be that the male subjects in the Greek study have lower PBF%, which leads to faster rate of muscle loss. The Framingham Heart Study (p. 121) explained why that happened. The longitudinal decline in FFM was consequent to a withdrawal of anabolic stimuli in men but reflecting an increase in catabolic stimuli represented by interleukin-6 (IL-6) in women.
We have found lower grip strength was associated with SO and OSO in women but not men, but further studies will be needed to explore the mechanism of this relationship.
OSO and WS
Our study showed that both older men and women with OSO were significantly related to slower WS when compared with the participant in O group, consisting with other studies. According to those studies, SO will increase the risk of decline in walking speed over 65 years,14 and older women with OSO had the worst 6-meter gait speed compared with the O group.20 In this study, we found that women with OSO had a significant slowest WS after adjusting model 1 and the multivariate model when compared with the O group. Our results agree with a previous study, which reported that the smaller muscle mass and greater fat infiltration caused by OSO will have a negative impact on lower extremity performance.43 However, we did not find any significant differences among other groups except for SO compared with O group in crude, but after adjusted model 1 and multiple factors, this relationship did not exist anymore. It may indicate that some other chronic condition-related, for example, unhealthy lipid levels,8 which can lead to bone and muscle cells affected by fat infiltration and impairing the walking function. Furthermore, no difference in the OO group confirmed that the combination of the three diseases (OSO) will be more associated with a high risk of decreased walking ability.
We also found men with OSO were significantly related to a slower WS when compared with men in O group. The result showed that women (0.93m/s) in the OSO group walked even faster than men (0.84m/s). Although a study44 has shown that gender does not play an important role in gait speed, a study from China indicates that the OSO prevalence was more common in the multiple fracture groups for men compared with women.45 Fracture has a negative correlation with normal and maximum 6m-walking speed.46 Moreover, the prevalence of sarcopenia was higher in men than women in this study. The decreased muscle was associated with fragile bones and thinner cortices47 and may affect walking ability. Therefore, older adults with OSO have a significant risk of mobility deterioration, which is reflected in WS.
OSO and TUGT
Our study found that women with OSO showed a poorer balance function (TUGT) compared to women in O, OO and SO groups. Also, the SO group showed significant difference compared with O group in both crude and Model 1. In men, we only found the OSO group showed the worst balance function compared with the O group (P<0.05). It also indicates that older people who had OSO suffered from fall risk and bad balance in previous studies.4,19
TUGT is likely to be related to several important dynamic stability skills.13 Better physical performance is required to complete this test for older people with OSO. However, it is difficult to do routine activities associated with a low level of physical activity for them. (We also found differences in IPAQ scores between male and female between OSO and O groups (2686Mets×minutes/wk vs 4937Mets×minutes/wk for men and 2708Mets×minutes/wk vs 5026Mets×minutes/wk in women)).15 An interesting result showed in our study, compared to grip strength and WS, only TUGT had significant differences between OSO and O, OSO and OO, OSO and SO in women. This result is consistent with our previous study that patients who suffered from OP and poor dynamic balance (TUGT) had a significantly higher incidence of sarcopenia.13
Besides, an American study also found compared with grip strength and brisk walking speed, only the leg stance time in the OSO group is significantly lower than that of the OO group.20 Those results indicate that OSO has the greatest impact on balance. These initial findings in OSO older people suggest that poorer balance function are important. But it is rarely studied at present.2
Strength and Limitations
This study has several strengths. This is the first cross-sectional study to identify the relationship of OSO and physical performance in China. Our subjects included both men and women and evaluated the dynamic balance (TUGT) in the first time. This study also has some limitations. Firstly, the analysis subset was community-dwelling elderly in Tianjin, China, which may not be representative of the general elderly. Secondly, there is no standard definitions for OSO, and the cut-off points are not well established.2 Thirdly, the QUS is not a good standard for diagnosis of osteopenia and OP, but it has a good correlation with dual-energy X-ray absorptiometry (DXA). Due to the low cost, simple performance, and no radiation of QUS, it is a portable alternative to DXA.48
Conclusion
Our study found that slower walking ability (WS) and poorer balance were associated with OSO in men and women, and lower muscle strength (grip strength) was associated with SO and OSO in women. Given the prevalence of OSO in older adults, our findings may contribute to the screening and prevention of OSO in a clinical setting. Further studies are required to determine the criteria of the condition and to establish a larger sample size to complete a more informed longitudinal study including the association of physical performance.
Disclosure
The authors report no conflicts of interest for this work.
References
1. Nations U. World Population Prospects The 2017 Revision,” in Demographic Profiles. Vol. II. New York, NY, USA: United Nations; 2017.
2. Kelly OJ, Gilman JC, Boschiero D, Ilich JZ. Osteosarcopenic obesity: current knowledge, revised identification criteria and treatment principles. Nutrients. 2019;11(4):747. doi:10.3390/nu11040747
3. Strugnell C, Dunstan DW, Magliano DJ, et al. Influence of age and gender on fat mass, fat-free mass and skeletal muscle mass among Australian adults: the Australian diabetes, obesity and lifestyle study (AusDiab). J Nutr Health Aging. 2014;18(5):540–546. doi:10.1007/s12603-014-0464-x
4. Ilich JZ, Kelly OJ, Inglis JE, et al. Interrelationship among muscle, fat, and bone: connecting the dots on cellular, hormonal, and whole body levels. Ageing Res Rev. 2014;15:51–60. doi:10.1016/j.arr.2014.02.007
5. Reginster J-Y, Beaudart C, Buckinx F, Bruyere O. Osteoporosis and sarcopenia: two diseases or one? Curr Opin Clin Nutr Metab Care. 2016;19(1):31–36. doi:10.1097/MCO.0000000000000230
6. Shin H, Panton LB, Dutton GR, Ilich JZ. Relationship of physical performance with body composition and bone mineral density in individuals over 60 years of age: a systematic review. J Aging Res. 2011;2011:191896. doi:10.4061/2011/191896
7. Cesari M, Landi F, Vellas B, Bernabei R, Marzetti E. Sarcopenia and physical frailty: two sides of the same coin. Front Aging Neurosci. 2014;6:192. doi:10.3389/fnagi.2014.00192
8. Mo D, Hsieh P, Yu H, et al. Osteosarcopenic obesity and its relationship with dyslipidemia in women from different ethnic groups of China. Arch Osteoporos. 2018;13(1):65. doi:10.1007/s11657-018-0481-1
9. Ma Y, Fu L, Jia L, et al. Muscle strength rather than muscle mass is associated with osteoporosis in older Chinese adults. J Formos Med Assoc. 2018;117(2):101–108. doi:10.1016/j.jfma.2017.03.004
10. Estrada M, Kleppinger A, Judge JO, Walsh SJ, Kuchel GA. Functional impact of relative versus absolute sarcopenia in healthy older women. J Am Geriatr Soc. 2007;55(11):1712–1719. doi:10.1111/j.1532-5415.2007.01436.x
11. Cunha PM, Ribeiro AS, Tomeleri CM, et al. The effects of resistance training volume on osteosarcopenic obesity in older women. J Sports Sci. 2018;36(14):1564–1571. doi:10.1080/02640414.2017.1403413
12. Shin H, Liu PY, Panton LB, Ilich JZ. Physical performance in relation to body composition and bone mineral density in healthy, overweight, and obese postmenopausal women. J Geriatr Phys Ther. 2014;37(1):7–16. doi:10.1519/JPT.0b013e31828af203
13. Yu X, Hou L, Guo J, et al. Combined effect of osteoporosis and poor dynamic balance on the incidence of sarcopenia in elderly chinese community suburban-dwelling individuals. J Nutr Health Aging. 2020;24(1):71–77. doi:10.1007/s12603-019-1295-6
14. Stenholm S, Alley D, Bandinelli S, et al. The effect of obesity combined with low muscle strength on decline in mobility in older persons: results from the InCHIANTI study. Int J Obes (Lond). 2009;33(6):635–644. doi:10.1038/ijo.2009.62
15. Ormsbee MJ, Prado CM, Ilich JZ, et al. Osteosarcopenic obesity: the role of bone, muscle, and fat on health. J Cachexia Sarcopenia Muscle. 2014;5(3):183–192. doi:10.1007/s13539-014-0146-x
16. Issa RI, Griffin TM. Pathobiology of obesity and osteoarthritis: integrating biomechanics and inflammation. Pathobiol Aging Age Relat Dis. 2012;2.
17. Tallis J, James RS, Seebacher F. The effects of obesity on skeletal muscle contractile function. J Exp Biol. 2018;221.
18. Tomlinson DJ, Erskine RM, Morse CI, Winwood K, Onambele-Pearson G. The impact of obesity on skeletal muscle strength and structure through adolescence to old age. Biogerontology. 2016;17(3):467–483. doi:10.1007/s10522-015-9626-4
19. Szlejf C, Parra-Rodriguez L, Rosas-Carrasco O. Osteosarcopenic obesity: prevalence and relation with frailty and physical performance in middle-aged and older women. J Am Med Dir Assoc. 2017;18(8):733 e731–733 e735. doi:10.1016/j.jamda.2017.02.023
20. Ilich JZ, Inglis JE, Kelly OJ, McGee DL. Osteosarcopenic obesity is associated with reduced handgrip strength, walking abilities, and balance in postmenopausal women. Osteoporos Int. 2015;26(11):2587–2595. doi:10.1007/s00198-015-3186-y
21. Barry E, Galvin R, Keogh C, Horgan F, Fahey T. Is the timed up and go test a useful predictor of risk of falls in community dwelling older adults: a systematic review and meta- analysis. BMC Geriatr. 2014;14(1):14. doi:10.1186/1471-2318-14-14
22. Marzetti E, Calvani R, Tosato M, et al. Sarcopenia: an overview. Aging Clin Exp Res. 2017;29(1):11–17. doi:10.1007/s40520-016-0704-5
23. Kim YM, Kim S, Won YJ, Kim SH. Clinical manifestations and factors associated with osteosarcopenic obesity syndrome: a cross-sectional study in koreans with obesity. Calcif Tissue Int. 2019;105(1):77–88. doi:10.1007/s00223-019-00551-y
24. China NBoSo. Statistical Communiqué on the 2012 National Economy and Social Development of People’s Republic of China. China Statistics; 2013.
25. Choi B, Steiss D, Garcia-Rivas J, et al. Comparison of body mass index with waist circumference and skinfold-based percent body fat in firefighters: adiposity classification and associations with cardiovascular disease risk factors. Int Arch Occup Environ Health. 2016;89(3):435–448. doi:10.1007/s00420-015-1082-6
26. Simpson ER. Sources of estrogen and their importance. J Steroid Biochem Mol Biol. 2003;86(3–5):225–230. doi:10.1016/S0960-0760(03)00360-1
27. Tsunoda K, Soma Y, Kitano N, et al. Age and gender differences in correlations of leisure-time, household, and work-related physical activity with physical performance in older Japanese adults. Geriatr Gerontol Int. 2013;13(4):919–927. doi:10.1111/ggi.12032
28. Domiciano DS, Figueiredo CP, Lopes JB, et al. Discriminating sarcopenia in community-dwelling older women with high frequency of overweight/obesity: the Sao Paulo ageing & health study (SPAH). Osteoporos Int. 2013;24(2):595–603. doi:10.1007/s00198-012-2002-1
29. Kanis JA. Assessment of fracture risk and its application to screening for postmenopausal osteoporosis: synopsis of a WHO report. Osteoporos Int. 1994;4(6):368–381. doi:10.1007/BF01622200
30. Fu LY, Jia LY, Zhang W, et al. The association between sleep duration and physical performance in Chinese community dwelling elderly. PLoS One. 2017;12.
31. JafariNasabian P, Inglis JE, Kelly OJ, Ilich JZ. Osteosarcopenic obesity in women: impact, prevalence, and management challenges. Int J Womens Health. 2017;9:33–42. doi:10.2147/IJWH.S106107
32. Kelly TL, Wilson KE, Heymsfield SB, Vella A. Dual energy x-ray absorptiometry body composition reference values from NHANES. PLoS One. 2009;4(9):e7038. doi:10.1371/journal.pone.0007038
33. Ilich JZ, Gilman JC, Cvijetic S, Boschiero D. Chronic stress contributes to osteosarcopenic adiposity via inflammation and immune modulation: the case for more precise nutritional investigation. Nutrients. 2020;12.
34. Hamrick MW, McGee-Lawrence ME, Frechette DM. Fatty infiltration of skeletal muscle: mechanisms and comparisons with bone marrow adiposity. Front Endocrinol (Lausanne). 2016;7:69. doi:10.3389/fendo.2016.00069
35. Alway SE, Myers MJ, Mohamed JS. Regulation of satellite cell function in sarcopenia. Front Aging Neurosci. 2014;6:246. doi:10.3389/fnagi.2014.00246
36. Zhang P, Peterson M, Su GL, Wang SC. Visceral adiposity is negatively associated with bone density and muscle attenuation. Am J Clin Nutr. 2015;101(2):337–343. doi:10.3945/ajcn.113.081778
37. Bhasin S, Woodhouse L, Casaburi R, et al. Older men are as responsive as young men to the anabolic effects of graded doses of testosterone on the skeletal muscle. J Clin Endocrinol Metab. 2005;90(2):678–688. doi:10.1210/jc.2004-1184
38. Deshpande S, James AW, Blough J, et al. Reconciling the effects of inflammatory cytokines on mesenchymal cell osteogenic differentiation. J Surg Res. 2013;185(1):278–285. doi:10.1016/j.jss.2013.06.063
39. Waters DL, Qualls CR, Dorin RI, Veldhuis JD, Baumgartner RN. Altered growth hormone, cortisol, and leptin secretion in healthy elderly persons with sarcopenia and mixed body composition phenotypes. J Gerontol a Biol Sci Med Sci. 2008;63(5):536–541. doi:10.1093/gerona/63.5.536
40. Logan S, Thu WPP, Lay WK, et al. Chronic joint pain and handgrip strength correlates with osteoporosis in mid-life women: a Singaporean cohort. Osteoporos Int. 2017;28(9):2633–2643. doi:10.1007/s00198-017-4095-z
41. Iolascon G, de Sire A, Calafiore D, et al. Hypovitaminosis D is associated with a reduction in upper and lower limb muscle strength and physical performance in post-menopausal women: a retrospective study. Aging Clin Exp Res. 2015;27(S1):S23–S30. doi:10.1007/s40520-015-0405-5
42. Keramidaki K, Tsagari A, Hiona M, Risvas G. Osteosarcopenic obesity, the coexistence of osteoporosis, sarcopenia and obesity and consequences in the quality of life in older adults >/=65 years-old in Greece. J Frailty Sarcopenia Falls. 2019;4:91–101. doi:10.22540/JFSF-04-091
43. Visser M, Kritchevsky SB, Goodpaster BH, et al. Leg muscle mass and composition in relation to lower extremity performance in men and women aged 70 to 79: the health, aging and body composition study. J Am Geriatr Soc. 2002;50(5):897–904. doi:10.1046/j.1532-5415.2002.50217.x
44. Ko SU, Tolea MI, Hausdorff JM, Ferrucci L. Sex-specific differences in gait patterns of healthy older adults: results from the Baltimore longitudinal study of aging. J Biomech. 2011;44(10):1974–1979. doi:10.1016/j.jbiomech.2011.05.005
45. Hong W, Cheng Q, Zhu X, et al. Prevalence of sarcopenia and its relationship with sites of fragility fractures in elderly Chinese men and women. PLoS One. 2015;10(9):e0138102. doi:10.1371/journal.pone.0138102
46. Maruya K, Fujita H, Arai T, et al. Sarcopenia and lower limb pain are additively related to motor function and a history of falls and fracture in community-dwelling elderly people. Osteoporos Sarcopenia. 2019;5(1):23–26. doi:10.1016/j.afos.2019.03.002
47. Szulc P, Beck TJ, Marchand F, Delmas PD. Low skeletal muscle mass is associated with poor structural parameters of bone and impaired balance in elderly men - the MINOS study. J Bone Miner Res. 2005;20(5):721–729. doi:10.1359/JBMR.041230
48. Nayak S, Olkin I, Liu H, et al. Meta-analysis: accuracy of quantitative ultrasound for identifying patients with osteoporosis. Ann Intern Med. 2006;144(11):832–841. doi:10.7326/0003-4819-144-11-200606060-00009
 © 2020 The Author(s). This work is published and licensed by Dove Medical Press Limited. The
full terms of this license are available at https://www.dovepress.com/terms
and incorporate the Creative Commons Attribution
- Non Commercial (unported, 3.0) License.
By accessing the work you hereby accept the Terms. Non-commercial uses of the work are permitted
without any further permission from Dove Medical Press Limited, provided the work is properly
attributed. For permission for commercial use of this work, please see paragraphs 4.2 and 5 of our Terms.
© 2020 The Author(s). This work is published and licensed by Dove Medical Press Limited. The
full terms of this license are available at https://www.dovepress.com/terms
and incorporate the Creative Commons Attribution
- Non Commercial (unported, 3.0) License.
By accessing the work you hereby accept the Terms. Non-commercial uses of the work are permitted
without any further permission from Dove Medical Press Limited, provided the work is properly
attributed. For permission for commercial use of this work, please see paragraphs 4.2 and 5 of our Terms.