Back to Journals » International Journal of Nanomedicine » Volume 12
Osseointegration of layer-by-layer polyelectrolyte multilayers loaded with IGF1 and coated on titanium implant under osteoporotic condition
Authors Xing H, Wang X ![]() , Xiao SS, Zhang G, Li M, Wang P, Shi Q, Qiao P, E L, Liu H
, Xiao SS, Zhang G, Li M, Wang P, Shi Q, Qiao P, E L, Liu H
Received 1 August 2017
Accepted for publication 13 September 2017
Published 19 October 2017 Volume 2017:12 Pages 7709—7720
DOI https://doi.org/10.2147/IJN.S148001
Checked for plagiarism Yes
Review by Single anonymous peer review
Peer reviewer comments 2
Editor who approved publication: Prof. Dr. Dongwoo Khang
This paper has been retracted.
Helin Xing, 1,* Xing Wang, 2,* Saisong Xiao, 3,* Guilan Zhang, 1 Meng Li, 1 Peihuan Wang, 1 Quan Shi, 1 Pengyan Qiao, 1 Lingling E, 1 Hongchen Liu 1
1Institute of Stomatology, Chinese PLA General Hospital, Beijing, 2Hospital of Stomatology, Shanxi Medical University, Taiyuan, 3Department of Anesthesia, Dongzhimen Hospital, Beijing University of Chinese Medicine, Beijing, China
*These authors contributed equally to this work
Purpose: Titanium implant is a widely used method for dental prosthesis restoration. Nevertheless, in patients with systemic diseases, including osteoporosis, diabetes, and cancer, the success rate of the implant is greatly reduced. This study investigates a new implant material loaded with insulin-like growth factor 1 (IGF1), which could potentially improve the implant success rate, accelerate the occurrence of osseointegration, and provide a new strategy for implant treatment in osteoporotic patients.
Materials and methods: Biofunctionalized polyelectrolyte multilayers (PEMs) with polyethylenimine as the excitation layer and gelatin/chitosan loaded with IGF1 were prepared on the surface of titanium implant by layer-by-layer self-assembly technique. The physical and chemical properties of the biofunctionalized PEMs, the biological characteristics of bone marrow mesenchymal stem cells (BMMSCs), and bone implant contact correlation test indexes were detected and analyzed in vitro and in vivo using osteoporosis rat model.
Results: PEMs coatings loaded with IGF1 (TNS-PEM-IGF1-100) implant promoted the early stage of BMMSCs adhesion. Under the action of body fluids, the active coating showed sustained release of growth factors, which in turn promoted the proliferation and differentiation of BMMSCs and the extracellular matrix. At 8 weeks from implant surgery, the new bone around the implants was examined using micro-CT and acid fuchsin/methylene blue staining. The new bone formation increased with time in each group, while the TNS-PEM-IGF1-100 group showed the highest thickness and continuity.
Conclusion: TNS-PEM-IGF1-100 new implants can promote osseointegration in osteoporotic conditions both in vivo and in vitro and provide a new strategy for implant repair in osteoporotic patients.
Keywords: osseointegration, layer by layer, polyelectrolyte multilayers, IGF1, titanium implant, osteoporosis
Introduction
In recent years, titanium implant has become one of the major methods of dental prosthesis restoration.1 Bone implant contact (BIC) is essential for long-term successful implant osseointegration and, therefore, bone quality and quantity around the implant are particularly important.2 Osteoporosis is a bone metabolism-related disease characterized by bone loss and bone microstructural destruction, which in turn leads to increased bone fragility and fracture.3 Furthermore, osteoporosis is the main factor that restricts the successful repair of implant in elderly patients. Therefore, exploring stronger BIC ability is essential to meet the needs of patients with osteoporosis.
Insulin-like growth factor 1 (IGF1), a member of the family of ILGFs, is present in almost all mammal tissues. IGF1 can promote cell differentiation and proliferation and metabolism of insulin, carbohydrates, and proteins in mammals, which are essential for bone metabolism and growth process.4,5 Osteoblasts are rich in IGF1 and are involved in the regulation of bone metabolism. Conti et al have found that vertebral bone mineral density is lower in postmenopausal elderly women, while the blood level of IGF1 significantly reduces with aging, which suggests that IGF1 plays an important role in maintaining bone strength.6 Lower levels of IGF1 increase the risk of fractures in osteoporotic women; thus IGF1 may be a promising drug for the treatment of osteoporosis.
At present, active substances and their relative functions in the biochemistry of implant surface modification are the focus of implant research.7–9 Layer-by-layer (LBL) self-assembly technology is an effective surface modification method. The technology mainly relies on electrostatic attraction, and the surface of the base material is assembled by using positive and negative charge, and finally the polyelectrolyte multilayers (PEMs) structure is formed in nanometer to micron stage.10,11 Compared with other physicochemical methods, this method directly utilizes the active molecules that promote the functional expression of bone marrow mesenchymal stem cells (BMMSCs) to influence tissue reaction and promote new bone formation. Therefore, this method is more direct compared to traditional physical and chemical approaches and is expected to provide results faster compared to the inorganic surface of the BIC rate.
In this study, we constructed a new biofunctionalized PEM with IGF1, ie, TNS-PEM-IGF1-100, using an LBL self-assembly approach. TNS-PEM-IGF1-100 promoted the adhesion of BMMSCs at the early stage. Under the action of body fluid, the active coating showed sustained release of growth factors and promoted the proliferation and differentiation of BMMSCs, as well as extracellular matrix (ECM). Finally, the biofunctionalized PEMs were successfully absorbed by the body, thus achieving a better BIC. Furthermore, TNS-PEM-IGF1-100 showed high implant success rate and significantly accelerated osseointegration; it promoted osseointegration under osteoporosis and provided a new strategy for implant treatment in osteoporotic patients.
Materials and methods
Specimen preparation
Surface-modified specimen
Titanium disks (15 mm in diameter and 1 mm thick) and titanium implants (1.5 mm in diameter and 5 mm height) of grade 2 commercially pure titanium were prepared by machining (Fullerton Technology Co. Ltd., Beijing, China). After ultrasonic cleaning, disks were immersed in 10 M NaOH and placed in an oil bath maintained at 30°C for 24 h. The solution in each flask was replaced with ion exchange water (200 mL); this procedure was repeated until the solution reached a conductivity of 5 μS/cm. The specimens were then dried at room temperature and were named titania nanosheet (TNS).
Materials for PEMs
Polyethylenimine (PEI) branched, gelatine (Gel), and chitosan (Chi) were purchased from Sigma-Aldrich, Co., St Louis, MO, USA. All materials were used without further purification. Solutions of 5 mg/mL PEI, 5 mg/mL Gel, and 5 mg/mL Chi were used for the preparation of PEMs. These reagents were prepared by direct dissolution of the polyelectrolytes in 0.15 M NaCl (for PEI), 0.15 M NaCl/phosphate-buffered saline (PBS) (for Chi), and 2% HAc/0.15 M NaCl (for Gel); all reagents were purchased from Sigma-Aldrich. Consequently, all solutions were filtered using Acrodisc® Syringe Filters (0.2 μm Supor Membrane) from Thermo-Fisher Scientific, Waltham, MA, USA. Recombinant Rat IGF-I (R&D Systems Inc., Minneapolis, MN, USA) was mixed in 0.15 M NaCl/PBS (for Chi) of 50 ng/mL or 100 ng/mL.
LBL polyelectrolyte multilayer films loading with IGF1
Fabrication of PEM coatings on TNS disks and implants was performed using an LBL technique.12 Briefly, the implant surface was pretreated with PEI solution for 20 min and subsequently washed twice with deionized water for 2 min. Consequently, a precursor layer with a stable positive charge was generated to initiate the LBL self-assembly process. PEMs were deposited by alternate dipping of TNS disks and implants into Gel and Chi solutions for 10 min, starting with Gel, and subsequently by washing twice with deionized water for 2 min. These procedures were repeated four times. Finally, the specimens were dried with compressed air. The specimens without IGF1 and those with 50 ng/mL and 100 ng/mL of IGF1 were named TNS-PEM, TNS-PEM-IGF1-50, and TNS-PEM-IGF1-100, respectively.
Surface characterization
Contact angle
The surface of the specimens was examined by scanning electron microscopy (SEM; S-4800; Hitachi, Tokyo, Japan). Contact angle measurements were examined using video contact angle measurement system model (K100; Kruss, Germany) at room temperature. Ultra-pure water was used in contact angle measurements.
IGF1 release
The specimens TNS-PEM-IGF1-50 and TNS-PEM-IGF1-100 were incubated in 1 mL of 10 mM PBS medium (pH 7.4) using 24-well plates under a constant vibration of 30 rpm at 37°C. At each time interval, liquid was pipetted out and replaced with equal volume of fresh buffer. The concentrations of IGF1 in the collected liquid were determined using Rat IGF-1 ELISA Kit (Thermo-Fisher Scientific).
Rat ovariectomy (OVX) model
Animal experiments were conducted in accordance with the Guidelines for Animal Experimentation of Chinese PLA General Hospital and in accordance with the international standards on animal welfare. Female Sprague Dawley rats weighing 200–230 g were obtained from Vital River Laboratories, Beijing, China. All the animals were housed in an environment at a temperature of 22°C±1°C, relative humidity of 50%±1%, and a light/dark cycle of 12/12 h; the animals were placed on standard diet. After 7 days of adaptation to the environment, the experimental group underwent bilateral ovariectomy (OVX), while the SHAM group had the same mass of fat tissue removed. Three months later, the osteoporotic model was established. To confirm the successful establishment of osteoporosis model, four rats of either OVX or SHAM group were sacrificed 3 months post-OVX and -SHAM surgeries to obtain the femurs for micro-CT scanning (Inveon CT; Siemens). The quantitative parameters of volume ratio (bone volume per total volume [BV/TV]) were obtained.
All animal studies (including the rat euthanasia procedure) were done in compliance with the regulations and guidelines of Chinese PLA General Hospital institutional animal care and according to the AAALAC and the IACUC guidelines.
Cell isolation and culture
The rat BMMSCs were obtained from the femurs of OVX rats. BMMSCs were maintained in high glucose Dulbecco’s Modified Eagle’s Medium (Cyagen), with 10% fetal bovine serum (FBS; Cyagen) supplemented with 1% penicillin/streptomycin. The cells were cultured in a humidified atmosphere with 5% CO2 at 37°C. The medium was replaced every consecutive 3 days. After reaching 80% confluence, BMMSCs were trypsinized using 0.5 g/L trypsin and 0.53 mmol/L EDTA (Nacalai Tesque) and seeded on the specimens at a density of 2×10⁴ cells/cm2. The medium was removed and replaced with osteogenic induction medium consisting of α-minimum essential medium (MEM), 15% FBS, 10 nM dexamethasone, 10 mM β-glycerophosphate, and 50 μg/mL ascorbic acid.
BMMSC identification
Flow cytometric analysis
BMMSCs at passage 3 were trypsinized, washed, and resuspended in PBS (Gibco) at a concentration of 2×10⁴ cells/cm2. The cells were subsequently immunolabeled with rat antibodies specific for CD29, CD90, CD34, CD45, and HLA-DR (Thermo-Fisher Scientific). Rat isotype antibodies were used as controls. The cells were then washed again with PBS and fixed in 2% paraformaldehyde and consequently analyzed using flow cytometry (BD Biosciences, San Jose, CA, USA).
Multilineage differentiation
BMMSCs at passage 3 were cultured on six-well culture plates at a density of 2×10⁴ cells/cm2 in induction medium. For osteogenic differentiation, the osteogenic induction medium consisted of α-MEM, 15% FBS, 10 nM dexamethasone, 10 mM β-glycerophosphate, and 50 μg/mL ascorbic acid. The medium was changed every 3 days. At day 21, cells were stained with alizarin red.
For adipogenic differentiation, the induction medium consisted of 200 μM indomethacin, 1 μM dexamethasone, 0.5 mM 3-isobutyl-1 methylxanthine, and 100 nM insulin. The medium was changed every 3 days. At day 21, cells were fixed and stained with fresh Oil Red O solution.
Immunofluorescence
Rat BMMSCs were seeded on the specimens at a density of 2×10⁴ cells/cm2. Twelve hours post-incubation, the attached cells were washed with PBS and fixed in 4% glutaraldehyde for 15 min, followed by incubation with 5 μg/mL anti-F-actin antibody [NH3] (Abcam, Cambridge, MA, USA) for 1 h. The cells were then washed with PBS for three times and stained with 4′,6-diamidino-2-phenylindole (2 μg/mL; Sigma-Aldrich). Finally, the samples were mounted with glycerinum and observed by confocal laser scanning microscopy (TCS SP5; Leica Microsystems, Wetzlar, Germany).
Cell proliferation assay
Cell proliferation was measured using CellTiter-Blue® Cell Viability Assay (Promega, Madison, WI, USA) according to the manufacturer’s instructions. Rat BMMSCs were seeded on the specimens at a density of 2×10⁴ cells/cm2 and allowed to attach for 1, 4, and 7 days. At each prescribed time point, nonadherent cells were removed by rinsing with PBS, and then 50 μL of CellTiter-Blue reagent and 250 μL of PBS were added to each well. After 1 h of incubation at 37°C, the solution was removed from the 24-well tissue culture plates (Falcon) and 100 μL of the solution from 24-well tissue culture plates was added to a new 96-well tissue culture plate (Falcon). The fluorescence obtained using the 96-well microplate reader (SpectraMax M5; Molecular Devices LLC, Sunnyvale, CA, USA) was recorded at 560/590 nm. The difference of the two optical densities was defined as the proliferation value.
Osteogenesis-related gene expression
Expression of osteogenesis-related genes was evaluated using quantitative real-time PCR assay. Rat BMMSCs were seeded with 2×10⁴ cells/cm2 and cultured for 3, 7, and 14 days. Total RNA was subsequently extracted using TRIzol (Thermo-Fisher Scientific) and first-strand complementary DNA (cDNA) was synthesized using a cDNA synthesis kit (Promega). Quantitative real-time PCR was then performed using rat alkaline phosphatase (ALP), type 1 collagen (COL-1), Runx2 (runt-related transcription factor 2), osteocalcin (OCN) primers, and Fast SYBR Green MasterMix in a StepOnePlus™ Real-Time PCR System (Applied Biosystems, Carlsbad, CA, USA). The primer sets are shown in Table 1. The expressions of the genes were normalized to the mRNA levels of the internal control β-actin. Data were analyzed using comparison Ct (2−ΔΔCt) method. The specificity of single-target amplification by each primer pair was confirmed by melting curve analysis.
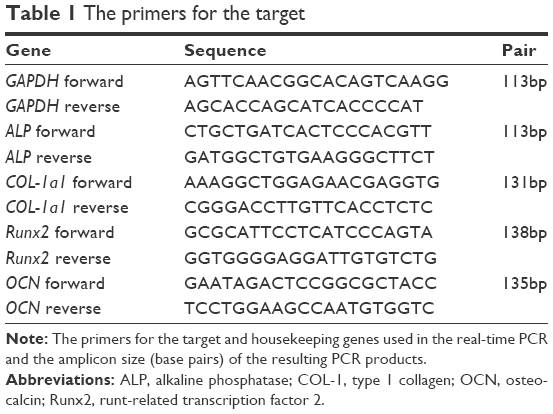 | Table 1 The primers for the target |
ALP staining and activity
Rat BMMSCs were seeded on the specimens at a density of 2×10⁴ cells/cm2. After being cultured for 7 and 14 days, the cells were washed and fixed, and ALP staining was performed with BCIP/NBT ALP color development substrate (Promega) for 15 min. For every 5 mL of ALP buffer (100 mM Tris–HCl [pH 9.0], 150 mM NaCl, 1 mM MgCl2), 33 μL of NBT and 16.5 μL of BCIP were added; NBT was added before BCIP. The ALP activity of rat BMMSCs was examined at 7 and 14 days post-incubation using Alkaline Phosphatase Assay kit (colorimetric) (Abcam, Cambridge, MA, USA).
ECM mineralization
ECM mineralization by rat BMMSCs was evaluated by alizarin red staining. After being cultured for 21 days, the cells were washed three times with PBS, fixed in cold 70% ethanol for 20 min, and washed with ultra-pure water for 3 min. The cell cultures were stained with alizarin red for 10 min at room temperature. Cell monolayers were washed with distilled water until no more color appeared, and images were acquired. After culturing for 14 and 21 days, calcium deposited in the ECM was measured by Calcium Detection Assay kit (colorimetric) (Abcam).
In vivo study
Implant surgery in OVX rat femurs
The OVX rats’ distal femur metaphysis was chosen as the implantation site. Every rat received two implants of the same group. Briefly, the rats were anesthetized by intraperitoneal injection of 1% pelltobarbitalum natricum (4 mg/kg) and fixed in the supine position. An incision of about 15 mm long was made in the medial knee and the muscle tissue was separated to expose the femur bone surface. The Astra Tech implant system (Dentsply Implants Manufacturing GmbH, Mannheim, Germany) was employed. Finally, the implants were pressed into the medullary cavity until they reached the site below the growth plate and then the muscle tissue and skin were sutured separately. Antibiotics were administrated for three consecutive days postsurgery.
Histological analysis and histomorphometry
To evaluate the bone response around the implants, histological and histomorphometric analyses were conducted. Eight weeks after the surgical procedure, rats were sacrificed and the specimens were collected. The specimens were then surgically removed, fixed, dehydrated, and embedded undecalcified in methyl methacrylate and stained with methylene blue/acid fuchsin. Histological evaluation was carried out using a light microscope (DM6000B; Leica Microsystems).
Micro-CT imaging was performed to assess the new bone formation around the implants. Eight weeks after implantation, the animals were sacrificed to retrieve the femurs with implants (four samples per group). Region of interest was defined as a ring with 200 μm radius starting from the implant surface in the coronal plane. The two- (2D) and three-dimensional (3D) views of the implant with the surrounding new bone were reconstructed. The amount of bone formed was determined in each section as a percentage of BV/TV, trabecular thickness (Tb.Th.), trabecular number (Tb.N.), and trabecular separation (Tb.Sp.).
Statistical analysis
The data were analyzed using SPSS 19.0 software (SPSS, Chicago, IL, USA). All data were expressed as mean ± standard deviation. One-way ANOVA and two-tailed Student’s t-tests were used to determine the level of significance. P<0.05 was considered to be significantly different.
Results
Surface properties of specimens
The surface view of the control and experimental group specimens (TNS, TNS-PEM, TNS-PEM-IGF1-50, TNS-PEM-IGF1-100) are shown in Figure 1. TNS were prepared via alkali treatment described previously.13 Porous network structures were formed by the alkali treatment. Furthermore, self-organization into a porous network structure was analyzed using high-magnification SEM images. TNS arrays were initially coated with PEMs to make the surfaces smoother. There was no apparent difference in the surface morphologies between IGF1-loaded TNS-PEM and TNS-PEM (Figure 1A); nevertheless, trace IGF1 present on TNS-PEM was observed using IGF1 release test (Figure 1D). Moreover, the IGF1 exhibited an initial burst release (within 7 days) followed by a constant release within 21 days.
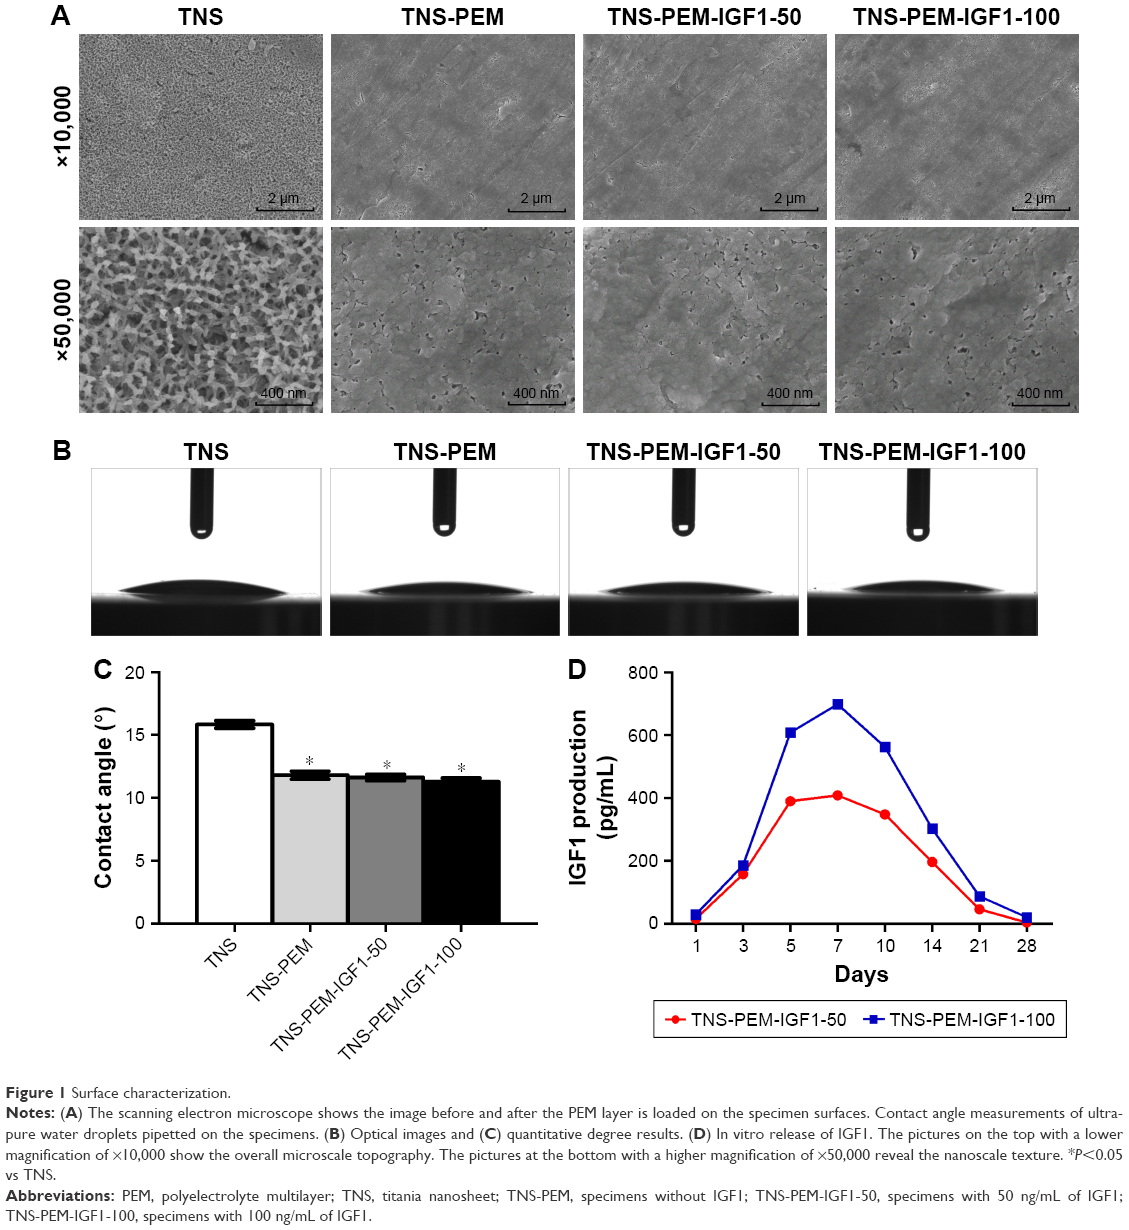 | Figure 1 Surface characterization. |
The contact angles of the control and experimental group specimens (TNS, TNS-PEM, TNS-PEM-IGF1-50, and TNS-PEM-IGF1-100) are shown in Figure 1B. Briefly, all specimens exhibited super hydrophilicity. In addition, better hydrophilicity was observed in the PEM-coated group compared to TNS group (Figure 1C).
Rat OVX model set
Three months after the OVX and SHAM surgeries, four rats of either OVX or SHAM group were sacrificed. Consequently, a 2D and 3D micro-CT (Figure 2A) were performed. Briefly, quantitative parameters of volume ratio (BV/TV) (Figure 2B) indicated that osteoporosis model was successfully established.
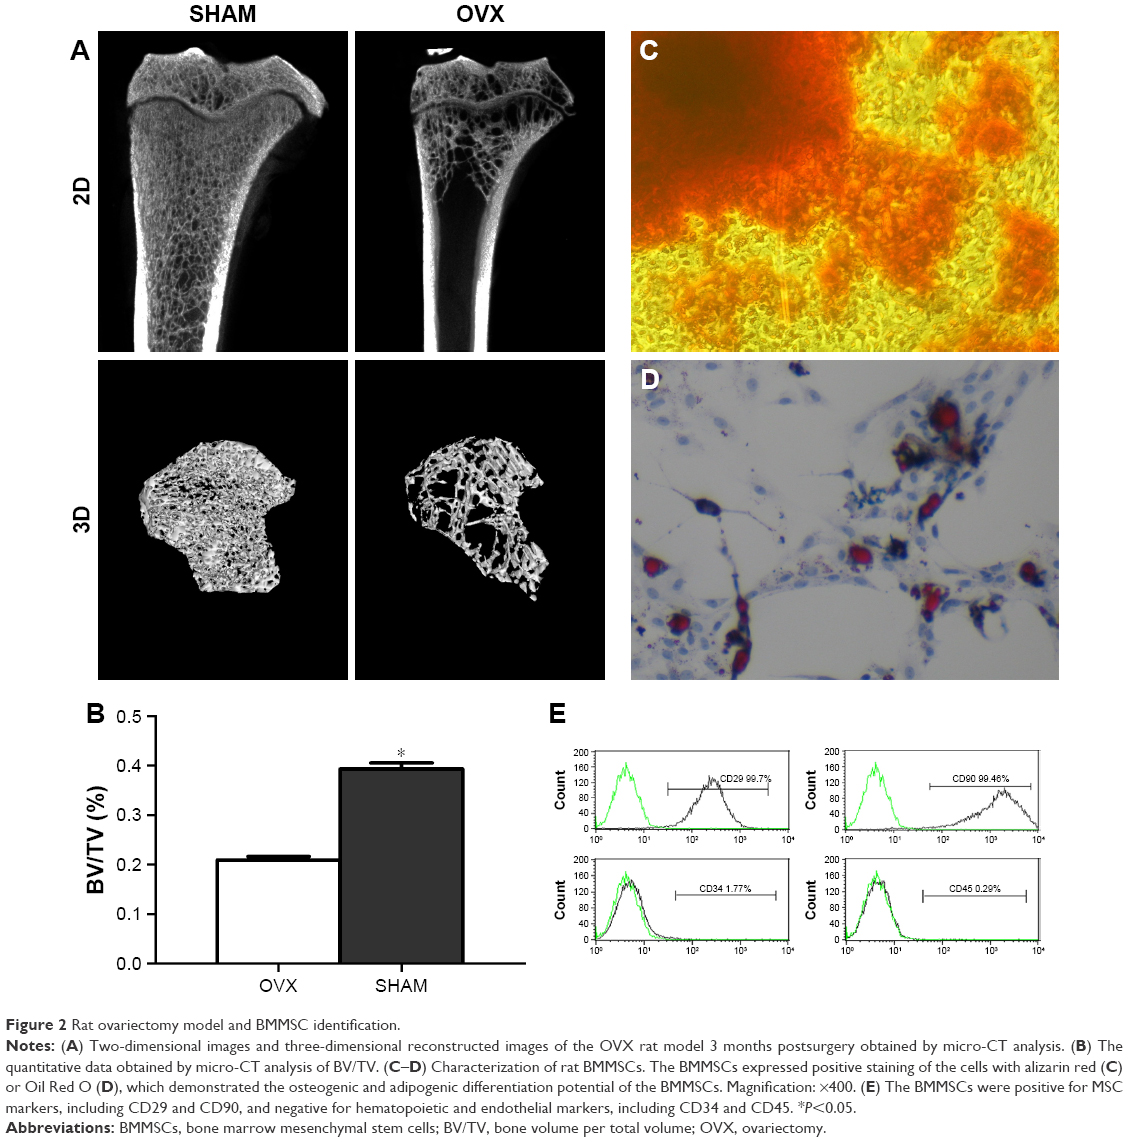 | Figure 2 Rat ovariectomy model and BMMSC identification. |
BMMSC identification
BMMSCs were characterized based on cell surface markers using flow cytometry. To evaluate the in vitro differentiation potential of the BMMSCs, the cells were induced to differentiate in osteogenic and adipogenic lineages under specific culture conditions, as revealed by alizarin red (Figure 2C) and Oil Red O (Figure 2D) staining. Furthermore, flow cytometry indicated that the cultured cells were homogenously positive for CD29 and CD90 and negative for hematopoietic and endothelial cell surface markers, including CD34 and CD45 (Figure 2E).
Immunofluorescence
To investigate the cell behaviors on PEM-coated and IGF1-loaded TNS, we firstly observed the morphologies of BNMSCs via immunofluorescence. Adherent cells to bare TNS displayed round or narrow spreading morphologies compared to other groups. By contrast, BMMSCs that adhered to TNS-PEM-IGF1-50 and TNS-PEM-IGF1-100 demonstrated well-spreading morphologies (Figure 3).
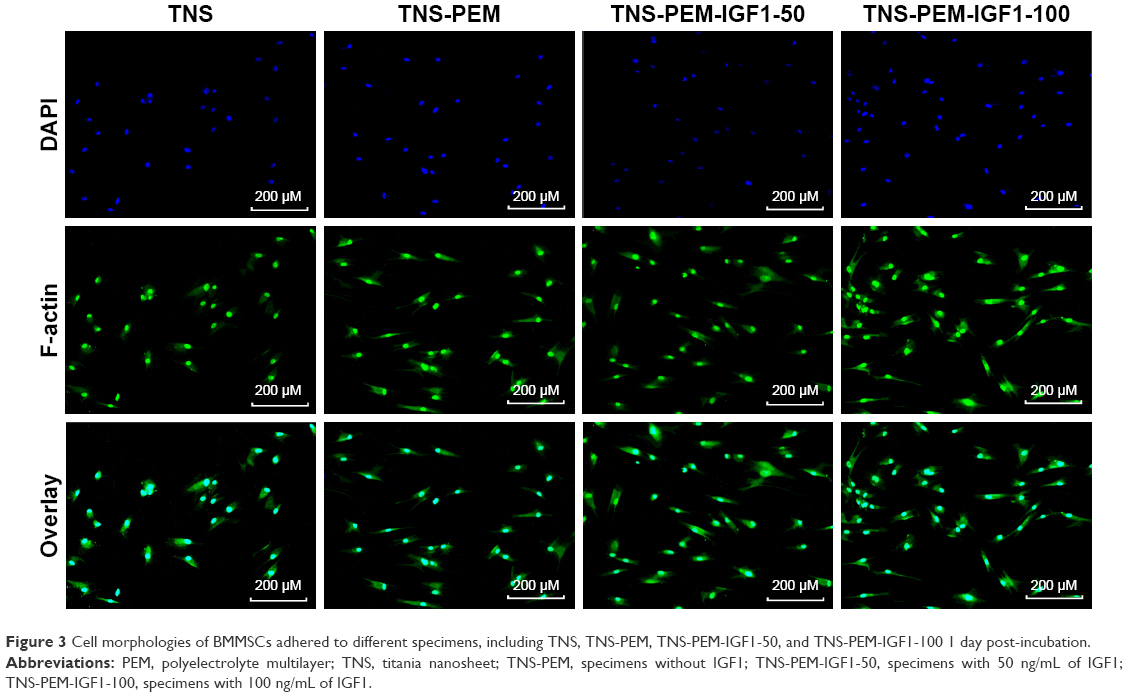 | Figure 3 Cell morphologies of BMMSCs adhered to different specimens, including TNS, TNS-PEM, TNS-PEM-IGF1-50, and TNS-PEM-IGF1-100 1 day post-incubation. |
Cell proliferation
Cell proliferation results during the first 7 days of incubation are shown in Figure 4A. There were significant differences between PEM-coated and control specimens at 1, 4, and 7 days post-incubation (P<0.05). In addition, the highest proliferation at each time point was at TNS-PEM-IGF1-100.
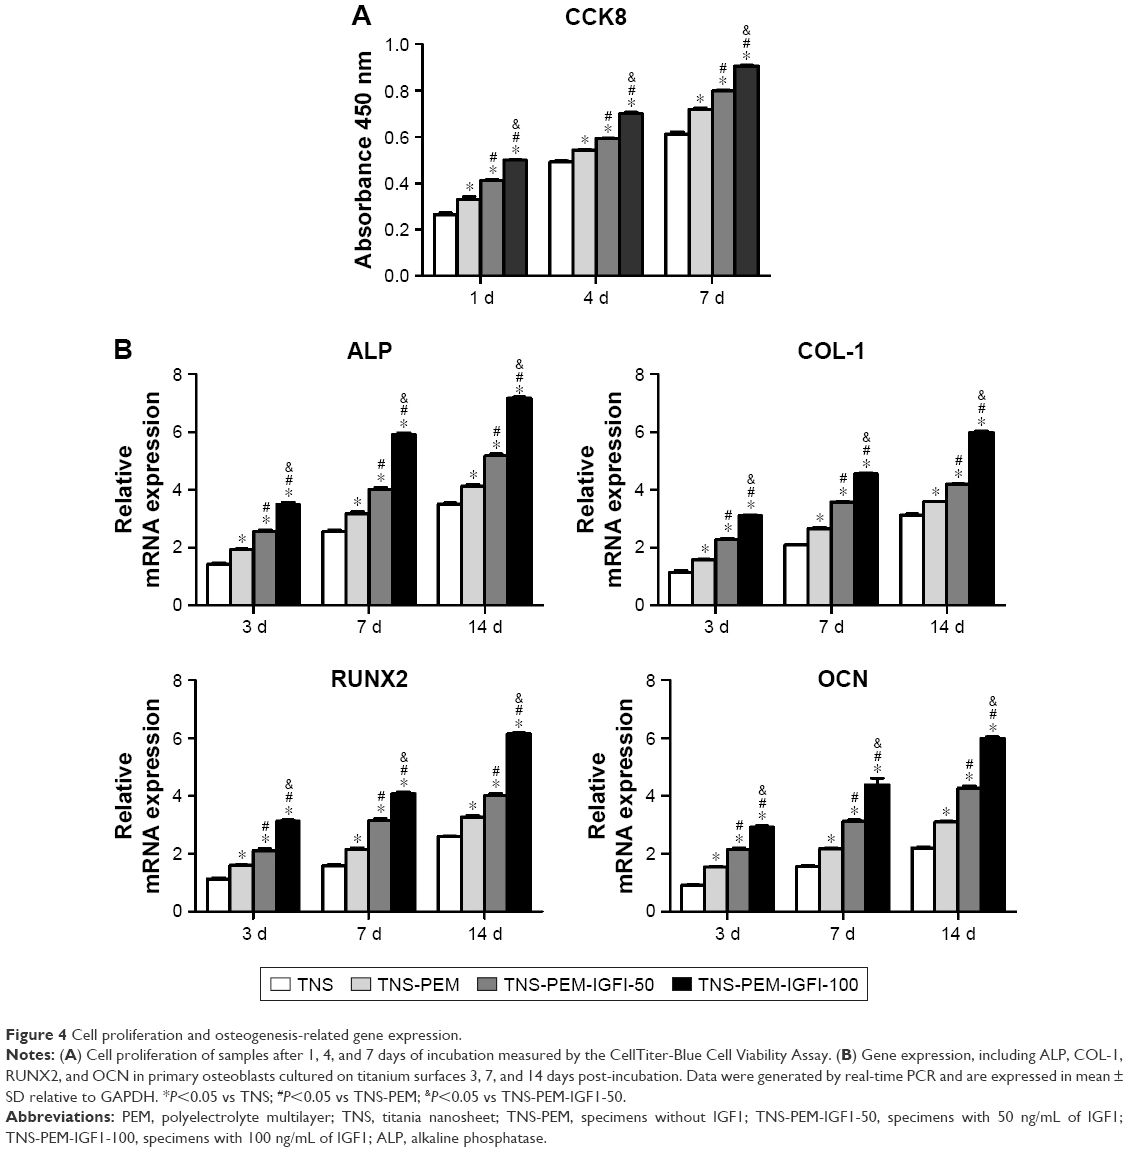 | Figure 4 Cell proliferation and osteogenesis-related gene expression. |
Osteogenesis-related gene expression
The expression levels of osteogenesis-related genes including ALP, COL-1, RUNX2, and OCN were assessed by quantitative RT-PCR (Figure 4B). The similar topographies explored in this study induced different gene expression levels at 3, 7, and 14 days. Generally, PEM-coated samples induced higher mRNA levels than the controls. The TNS-PEM-IGF1-100 induced the highest mRNA levels for all the osteogenesis-related genes.
ALP staining and intracellular ALP activity
As shown in Figure 5A, ALP production in BMMSCs on all the specimens occurred as early as 7 days after incubation and increased with time. There were significant differences in ALP production among different specimens at each time point. Furthermore, intracellular ALP activity after 7 and 14 days of culture was in accordance with the ALP staining results (Figure 5B), showing obvious differences in the ALP activity among different specimens.
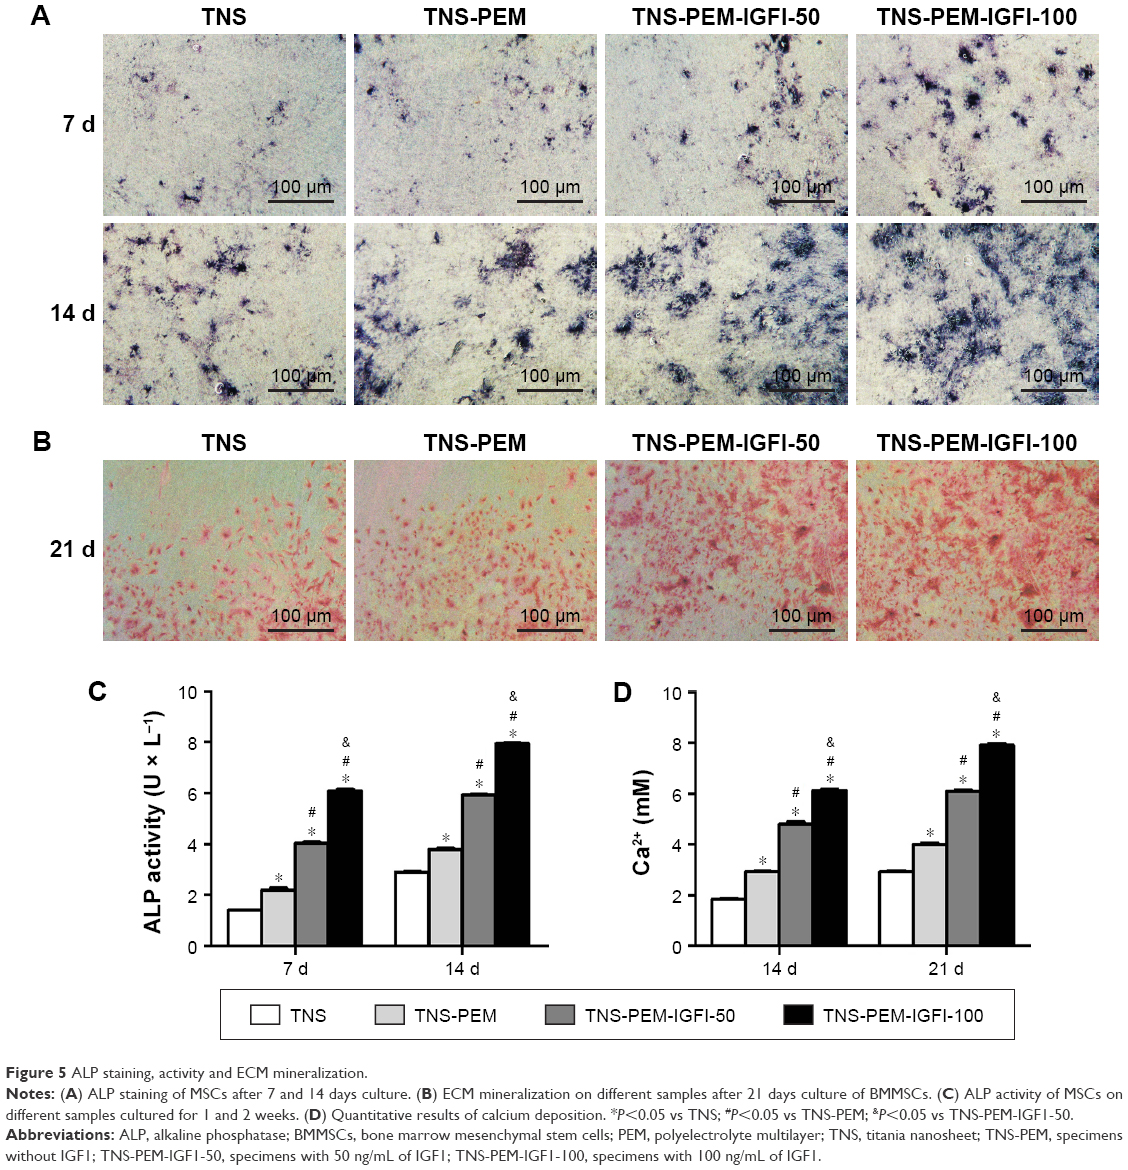 | Figure 5 ALP staining, activity and ECM mineralization. |
ECM mineralization
ECM mineralization was assessed by alizarin red staining (Figure 5C). In the TNS group, small mineralization dots were observed. However, TNS-PEM, TNS-PEM-IGF1-50, and TNS-PEM-IGF1-100 groups induced abundant mineralization nodules that were larger compared to the control group. In addition, the mineralization dots differed in appearance according to the concentration of IGF1 (Figure 5C). Furthermore, calcium deposition demonstrated that the ECM mineralization levels in surfaces coated with PEM were significantly higher compared to the control group (Figure 5D).
In vivo study
The new bone formation around the Ti implants was assessed by methylene blue/acid fuchsin staining and micro-CT scanning, 8 weeks after implant insertion in OVX rats (Figure 6). Bone types, ie, new bone (dark red staining), mineralized bone (red staining), and osteoid bone (blue staining), were effectively distinguished using methylene blue/acid fuchsin. Slight bone formation was observed surrounding the implants in the control group, while newly formed bone was found at the surface of the TNS-PEM-IGF1-100 implants, indicating better osseointegration (Figure 6A). The 2D graphs and the 3D images showed details of the bone response around the implant (Figure 6B and C). The new bone formation around PEM-coated groups was far better compared to TNS group; the best results were obtained with TNS-PEM-IGF1-100; also continuous and thick layer of new bone was observed around TNS-PEM-IGF1-100. The quantitative analysis revealed that TNS-PEM-IGF1-100 can enormously increase BV/TV, TB.Th, and TB.N and decrease TB.Sp (Figure 6D).
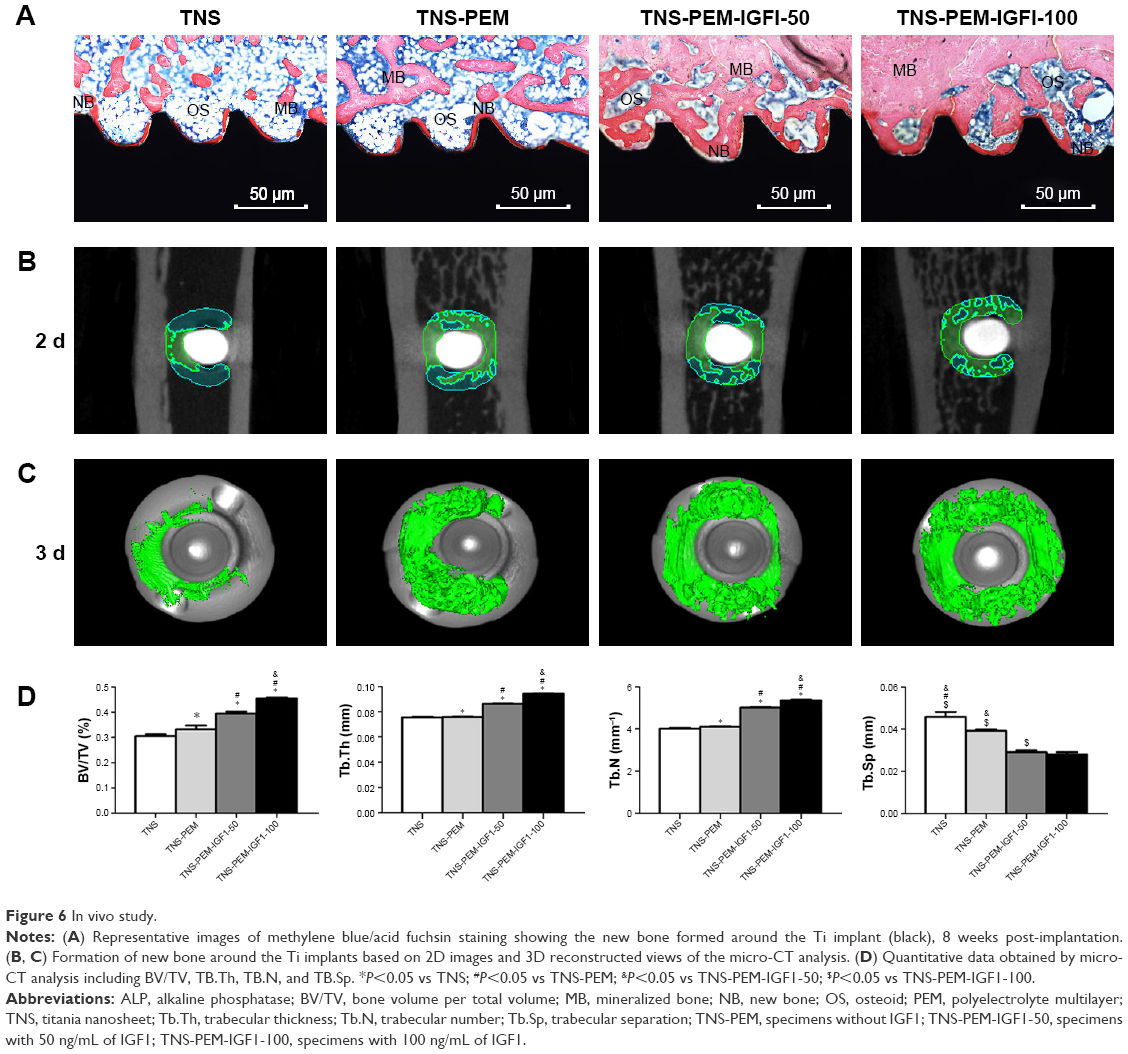 | Figure 6 In vivo study. |
Discussion
Bone implant materials, represented by titanium and titanium alloy, are widely used in dentistry, craniomaxillofacial surgery, and osteoarthritis because of their good biocompatibility.14,15 However, in patients with trauma, infection, or systemic diseases such as osteoporosis, diabetes, and cancer, the success rates of the implant are greatly reduced.16 To meet the needs of patients with bone disorders or bone defects, numerous researchers are relying on surface modification technology.7–9,17 In this study, biofunctionalized PEMs with PEI18 as the excitation layer and gelatin/chitosan loaded with IGF1 were prepared on the surface of titanium implant by LBL self-assembly approach. Furthermore, the physical and chemical properties of the biofunctionalized PEMs and the biological characteristics of cells and BIC correlation test indexes were detected and analyzed in an osteoporotic rat model, in order to improve the success rate of implant treatment in osteoporotic patients.
Research has showed that IGF1 axis hormone regulation is an important link that independently affected the formation and proliferation of bone matrix. Goad et al have shown that subcutaneous injection of IGF1 in mice can promote bone formation in vivo.31,32 The results of this study showed that IGF1 can significantly increase the adhesion, proliferation, and differentiation of rat BMMSCs in a concentration-dependent manner. Experimental group treated with IGF1 100 ng/mL was superior compared to those treated with IGF1 50 ng/mL. It is also interesting to test whether the functionalized structure could promote bone formation in other disease contexts.
The osteogenic differentiation process mainly includes three stages: cell proliferation, ECM maturation, and ECM mineralization.22 Compared with the TNS group, the cell proliferation activity of the TNS-PEM group significantly improved. After IGF1 loading, cell proliferation levels increased. Gittens et al23 have analyzed the relationship between material surface hydrophilicity and cell proliferation and have found that compared with the hydrophobic surface, the hydrophilic surface is more conducive to the early adhesion and cell proliferation and that it can promote osteogenic differentiation and bone formation. ALP is an important indicator of osteogenic activity, usually in the early stage of osteogenesis differentiation upregulation.24 Collagen secretion is a key factor in connective tissue formation. Osteoblasts can produce type I and type III collagen. COL-1, an early marker of osteoblasts, is one among main bone ECM components. It is essential in maintaining tissue structure as the basis of mineral deposition.25,26 OCN is a late indicator of bone differentiation, usually in matrix maturation and mineralization stage.27,28 Runx2 is a key transcription factor in osteoblast differentiation pathways. The Runx2 gene encodes an osteoblast-specific transcription factor that regulates osteoblast differentiation and bone formation.9 ALP is an enzyme that is derived from osteoblasts. As a product of osteogenic differentiation, ALP expression level marks osteoblast and bone formation activity.24,29 The final stage of osteogenic differentiation is the mineralization of ECM, and the mineralized nodule is an important functional marker of mature bone cells.30 Our study here suggests that the functionalized structure could promote all of these processes.
In this study, using alkali treatment, hydroxyl-rich porous nanostructured structures were constructed on the surface of pure titanium. The biofunctionalized PEMs with PEI as the excitation layer and gelatin/chitosan loaded with IGF1 was prepared on the surface of titanium implant by LBL self-assembly technique. According to the isoelectric point of IGF1, they were mixed into chitosan at concentrations of 50 ng/mL and 100 ng/mL, and layers were successfully self-assembled layer by layer to form two PEMs with different concentrations of IGF1. Existing research have shown that hydrophilicity of the material can also affect the adhesion, proliferation, and differentiation of cells on the surface of the material.19,20 In this study, we revealed that the hydrophilicity of the surface was increased by LBL treatment and it indirectly reacted with the gelatin/chitosan/IGF1 loaded on the TNS surface. To this end, whether the effects of loaded IGF1 could be partially attributed to the hydrophilicity remains to be elucidated.
Conclusion
In this study, biofunctionalized PEMs with PEI as the excitation layer and gelatin/chitosan loaded with IGF1 were prepared on the surface of titanium implant using LBL self-assembly technique. According to the isoelectric point of IGF1, they were mixed into chitosan at a concentration of 50 ng/mL and 100 ng/mL, and layer-by-layer self-assembled technology was used to form two PEMs with different concentrations of IGF1 (TNS-PEM-IGF1-50, TNS-PEM-IGF1-100). A biological coating was loaded on the surface of the treated implant and a functional implant was obtained. The surface microstructure and surface properties of the implant were analyzed. The BMMSCs of osteoporotic model rats were used for in vitro experiments to evaluate the adhesion, proliferation, and osteogenic differentiation of the cells on the implant surface. Finally, the implant was implanted into osteoporotic rats and the early osteoblastic ability of the implants under osteoporosis was explored. The new type implant promotes bone consolidation both in vitro and in vivo under osteoporotic conditions and provides new strategies for implant repair in osteoporotic patients.
Acknowledgments
This study was approved by the committee of experimentation of Chinese PLA General Hospital. This work was supported by the Beijing National Natural Science Foundation (No 7164297), Shanxi Applied Basic Research Program Science – Youth Technology Research Fund (No 201701D221160), General Financial Grant from the China Postdoctoral Science Foundation (No 2015M582807), Special Financial Grant from the China Postdoctoral Science Foundation (No 2016T90986), and Young Teachers Program of Beijing University of Chinese Medicine (2017-JYB-JS-80). We are also very grateful to the staff and faculty of Institute of Stomatology, Chinese PLA General Hospital.
Disclosure
The authors report no conflicts of interest in this work.
References
Learmonth ID, Young C, Rorabeck C. The operation of the century: total hip replacement. Lancet. 2007;370(9597):1508–1519. | ||
Agarwal R, Garcia AJ. Biomaterial strategies for engineering implants for enhanced osseointegration and bone repair. Adv Drug Deliv Rev. 2015;94:53–62. | ||
Fini M, Giavaresi G, Torricelli P, Borsari V, Giardino R, Nicolini A, Carpi A. Osteoporosis and biomaterial osteointegration. Biomed Pharmacother. 2004;58(9):487–493. | ||
Blom S, Holmstrup P, Dabelsteen E. The effect of insulin-like growth factor-I and human growth hormone on periodontal ligament fibroblast morphology, growth pattern DNA synthesis, and receptor binding. J Periodontol. 1992;63(12):960–968. | ||
Xue P, Wu X, Zhou L, et al. IGF1 promotes osteogenic differentiation of mesenchymal stem cells derived from rat bone marrow by increasing TAZ expression. Biochem Biophys Res Commun. 2013;433(2):226–231. | ||
Conti FG, Strilker LJ, Elliot SJ, Andreani D, Strilker GE. Synthesis and release of insulinlike growth factor I by mesangial cells in culture. Am J Physiol. 1988;255(6 Pt 2):F1214–F1219. | ||
Buser D, Broggini N, Wieland M, et al. Enhanced bone apposition to a chemically modified SLA titanium surface. J Dent Res. 2004;83(7):529–533. | ||
Guo J, Padilla RJ, Ambrose W, De Kok IJ, Cooper LF. The effect of hydrofluoric acid treatment of TiO2 grit blasted titanium implants on adherent osteoblast gene expression in vitro and in vivo. Biomaterials. 2007;28(36):5418–5425. | ||
Zhao L, Liu L, Wu Z, Zhang Y, Chu PK. Effects of micropitted/nanotubular titania topographies on bone mesenchymal stem cell osteogenic differentiation. Biomaterials. 2012;33(9):2629–2641. | ||
Decher G. Fuzzy nanoassemblies: toward layered polymeric multicomposites. Science. 1997;277(5330):1232–1237. | ||
Tang Z, Wang Y, Podsiadlo P, Kotov NA. Biomedical applications of layer-by-layer assembly: from biomimetics to tissue engineering. Adv Mater. 2006;18(24):3203–3224. | ||
Cai K, Rechtenbach A, Hao J, Bossert J, Jandt KD. Polysaccharide-protein surface modification of titanium via a layer-by-layer technique: characterization and cell behaviour aspects. Biomaterials. 2005;26(30):5960–5971. | ||
Xing H, Komasa S, Taguchi Y, Sekino T, Okazaki J. Osteogenic activity of titanium surfaces with nanonetwork structures. Int J Nanomedicine. 2014;9:1741–1755. | ||
Rosa MB, Albrektsson T, Francischone CE, Schwartz Filho HO, Wennerberg A. The influence of surface treatment on the implant roughness pattern. J Appl Oral Sci. 2012;20(5):550–555. | ||
Smeets R, Stadlinger B, Schwarz F, et al. Impact of dental implant surface modifications on osseointegration. Biomed Res Int. 2016;2016:6285620. | ||
Mellado-Valero A, Ferrer-Garcia JC, Calvo-Catala J, Labaig-Rueda C. Implant treatment in patients with osteoporosis. Med Oral Patol Oral Cir Bucal. 2010;15(1):e52–e57. | ||
Mendonca G, Mendonca DB, Aragao FJ, Cooper LF. Advancing dental implant surface technology – from micron- to nanotopography. Biomaterials. 2008;29(28):3822–3835. | ||
Miyazaki CM, Mishra R, Kinahan DJ, Ferreira M, Ducree J. Polyethylene imine/graphene oxide layer-by-layer surface functionalization for significantly improved limit of detection and binding kinetics of immunoassays on acrylate surfaces. Colloids Surf B Biointerfaces. 2017;158:167–174. | ||
Rupp F, Gittens RA, Scheideler L, Marmur A, Boyan BD, Schwartz Z, Geis-Gerstorfer J. A review on the wettability of dental implant surfaces I: theoretical and experimental aspects. Acta Biomater. 2014;10(7):2894–2906. | ||
Rupp F, Scheideler L, Olshanska N, de Wild M, Wieland M, Geis-Gerstorfer J. Enhancing surface free energy and hydrophilicity through chemical modification of microstructured titanium implant surfaces. J Biomed Mater Res A. 2006;76(2):323–334. | ||
Liu Y, Ming L, Luo H, Liu W, Zhang Y, Liu H, Jin Y. Integration of a calcined bovine bone and BMSC-sheet 3D scaffold and the promotion of bone regeneration in large defects. Biomaterials. 2013;4(38):9998–10006. | ||
Yamamoto Y, Ohsaki Y, Goto T, Nakasima A, Iijima T. Effects of static magnetic fields on bone formation in rat osteoblast cultures. J Dent Res. 2003;82(12):962–966. | ||
Gittens RA, Scheideler L, Rupp F, Hyzy SL, Geis-Gerstorfer J, Schwartz Z, Boyan BD. A review on the wettability of dental implant surfaces II: biological and clinical aspects. Acta Biomater. 2014;10(7):2907–2918. | ||
Leung KS, Fung KP, Sher AH, Li CK, Lee KM. Plasma one-specific alkaline phosphatase as an indicator of osteoblastic activity. J Bone Joint Surg Br. 1993;75(2):288–292. | ||
Pivodova V, Frankova J, Ulrichova J. Osteoblast and gingival fibroblast markers in dental implant studies. Biomed Pap Med FacUniv Palacky Olomouc Czech Repub. 2011;155(2):109–116. | ||
Kruger TE, Miller AH, Wang J. Collagen scaffolds in bone sialoprotein-mediated bone regeneration. ScientificWorldJournal. 2013;(2013):812718. | ||
Klymov A, Song J, Cai X, Te Riet J, Leeuwenburgh S, Jansen JA, Walboomers XF. Increased acellular and cellular surface mineralization induced by nanogrooves in combination with a calcium-phosphate coating. Acta Biomater. 2016;31:368–377. | ||
Yang W, Xi X, Si Y, Huang S, Wang J, Cai K. Surface engineering of titanium alloy substrates with multilayered biomimetic hierarchical films to regulate the growth behaviors of osteoblasts. Acta Biomater. 2014;10(10):4525–4536. | ||
Chang B, Song W, Han T, et al. Influence of pore size of porous titanium fabricated by vacuum diffusion bonding of titanium meshes on cell penetration and bone ingrowth. Acta Biomater. 2016;33:311–321. | ||
Sailaja GS, Ramesh P, Vellappally S, Anil S, Varma HK. Biomimetic approaches with smart interfaces for bone regeneration. J Biomed Sci. 2016;23(1):77. | ||
Goad DL, Rubin J, Wang H, Tashjian AH Jr, Patterson C. Enhanced expression of vascular endothelial growth factor in human SaOS-2 osteoblast-like cells and murine osteoblasts induced by insulin-like growth factor I. Endocrinology. 1996;137(6):2262–2268. | ||
Yakar S, Rosen CJ, Beamer WG, et al. Circulating levels of IGF-1 directly regulate bone growth and density. J Clin Invest. 2002;110(6):771–781. | ||
Li Y, Li X, Song G, Chen K, Yin G, Hu J. Effects of strontium ranelate on osseointegration of titanium implant in osteoporotic rats. Clin Oral Implants Res. 2012;23(9):1038–1044. |
 © 2017 The Author(s). This work is published and licensed by Dove Medical Press Limited. The
full terms of this license are available at https://www.dovepress.com/terms
and incorporate the Creative Commons Attribution
- Non Commercial (unported, 3.0) License.
By accessing the work you hereby accept the Terms. Non-commercial uses of the work are permitted
without any further permission from Dove Medical Press Limited, provided the work is properly
attributed. For permission for commercial use of this work, please see paragraphs 4.2 and 5 of our Terms.
© 2017 The Author(s). This work is published and licensed by Dove Medical Press Limited. The
full terms of this license are available at https://www.dovepress.com/terms
and incorporate the Creative Commons Attribution
- Non Commercial (unported, 3.0) License.
By accessing the work you hereby accept the Terms. Non-commercial uses of the work are permitted
without any further permission from Dove Medical Press Limited, provided the work is properly
attributed. For permission for commercial use of this work, please see paragraphs 4.2 and 5 of our Terms.