Back to Journals » Clinical Ophthalmology » Volume 9
Optomap ultrawide field imaging identifies additional retinal abnormalities in patients with diabetic retinopathy
Authors Price L, Au S, Chong NV
Received 17 December 2014
Accepted for publication 13 January 2015
Published 24 March 2015 Volume 2015:9 Pages 527—531
DOI https://doi.org/10.2147/OPTH.S79448
Checked for plagiarism Yes
Review by Single anonymous peer review
Peer reviewer comments 3
Editor who approved publication: Dr Scott Fraser
Liam D Price,1 Stephanie Au,2 N Victor Chong1
1Oxford Eye Hospital, University of Oxford, Oxford, UK; 2University of Hong Kong, Hong Kong SAR, People’s Republic of China
Purpose: To compare diabetic retinopathy (DR) severity grading between Optomap ultrawide field scanning laser ophthalmoscope (UWFSLO) 200° images and an Early Treatment Diabetic Retinopathy Study (ETDRS) seven-standard field view.
Methods: Optomap UWFSLO images (total: 266) were retrospectively selected for evidence of DR from a database of eye clinic attendees. The Optomap UWFSLO images were graded for DR severity by two masked assessors. An ETDRS seven-field mask was overlaid on the Optomap UWFSLO images, and the DR grade was assessed for the region inside the mask. Any interassessor discrepancies were adjudicated by a senior retinal specialist. Kappa agreement levels were used for statistical analysis.
Results: Fifty images (19%) (P<0.001) were assigned a higher DR level in the Optomap UWFSLO view compared to the ETDRS seven-field view, which resulted in 40 images (15%) (P<0.001) receiving a higher DR severity grade. DR severity grades in the ETDRS seven-field view compared with the Optomap UWFSLO view were identical in 85% (226) of the images and within one severity level in 100% (266) of the images. Agreement between the two views was substantial: unweighted κ was 0.74±0.04 (95% confidence interval: 0.67–0.81) and weighted κ was 0.80±0.03 (95% confidence interval: 0.74–0.86).
Conclusion: Compared to the ETDRS seven-field view, a significant minority of patients are diagnosed with more severe DR when using the Optomap UWFSLO view. The clinical significance of additional peripheral lesions requires evaluation in future prospective studies using large cohorts.
Keywords: diagnostic imaging, diabetes, retina
Introduction
Diabetic retinopathy (DR) has been extensively characterized by the Early Treatment Diabetic Retinopathy Study Research Group (ETDRS).1–5 The DR severity classifications defined in these studies have been used in subsequent clinical trials assessing treatment efficacy and therefore guide modern clinical management of DR. The ETDRS fundus photography protocol requires pharmacological mydriasis and uses a set of seven individual stereoscopic images, each covering 30° of the posterior retina. The combined seven-field image includes the majority of the central retina but covers only 30% of the entire retinal surface. The ETDRS protocol remains the current gold standard imaging technique for DR classification; the recent switch from film to digital images showed no appreciable difference in sensitivity or specificity.6,7
Within the past few years, imaging using an ultrawide field scanning laser ophthalmoscope (UWFSLO) (Optomap P200; Optos plc, Dunfermline, UK) has offered an alternative to ETDRS seven-field images. The Optomap UWFSLO technology has the advantage of not requiring mydriasis and captures a single 200° image of the retina, approximately 80% of the retinal surface. Lens opacities such as cataracts affect the image quality much less than in ETDRS films.8,9 Several studies have compared nonmydriatic UWFSLO images to ETDRS seven-field films and dilated fundus examination in the grading of DR and have shown strong agreement between the imaging modalities.10–13 The addition of mydriasis into the Optomap UWFSLO protocol has not been shown to improve the diagnostic accuracy compared with nonmydriasis but is associated with a reduction in the rate of ungradable images (4.5%–0%, P=0.002).14
The use of an ellipsoidal mirror means that the 200° images produced by the Optomap UWFSLO are not uniformly focused but instead have a sharper focus in the center and are progressively more distorted toward the periphery. However, there is a substantial amount of peripheral retina outside the ETDRS seven-field view sharp enough to allow DR grading (Figure 1). Silva et al14 compared the grading results of the ETDRS seven-field and mydriatic Optomap UWFSLO images from the same cohort of 206 eyes and noted an increase in DR severity grading in 10% of eyes in the Optomap UWFSLO results.
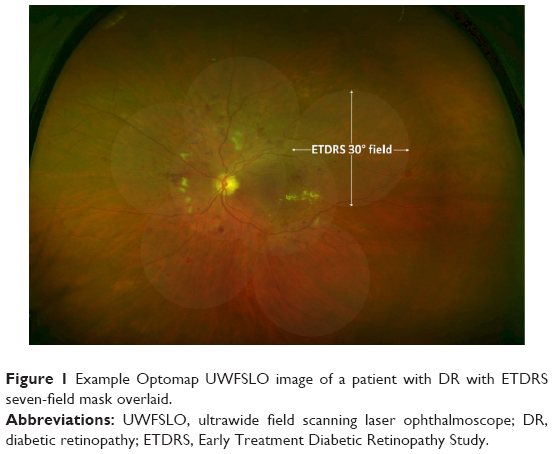 | Figure 1 Example Optomap UWFSLO image of a patient with DR with ETDRS seven-field mask overlaid. |
In this study, we obtained mydriatic Optomap UWFSLO images and compared the DR grading of the full 200° view and a smaller region of the same image representing the retinal coverage of an ETDRS seven-standard field film.
Materials and methods
Patients
Images of consecutive patients who attended the Oxford Eye Hospital were retrospectively examined. The images included in this study were selected if they showed any evidence of DR. Images were excluded if there was evidence of other retinal pathology or laser photocoagulation treatment. The images used in this study were initially selected by a single assessor (SA), and then the set of images was further refined by a senior retinal specialist (VC).
Protocol
Optomap UWFSLO images were obtained by a trained technician before the scheduled clinic appointment. The imaging process involved taking several images, selecting the image that provided the largest retinal area and best image quality. Each image took only 0.25 seconds to capture with the Optomap UWFSLO. The sets of images were anonymized and stored on servers at the hospital.
A mask that represents the ETDRS seven-field region was produced using Adobe Photoshop CS2 (Adobe Systems Incorporated, San Jose, CA, USA). The ETDRS seven-field mask was then positioned over the full Optomap UWFSLO 200° images so that the macula and the optic disk were covered by the central two ETDRS fields, as shown in Figure 1.
The International Clinical Diabetic Retinopathy (ICDR) severity scale was used for grading.15 The scale was developed for use with ETDRS seven-field images, but in this study, it was adapted for use in grading the Optomap UWFSLO images by means of extending the grading quadrants to the periphery of the entire image but retaining the original grading nomenclature for simplicity. Two separate ICDR grades were recorded for each Optomap UWFSLO image: one set of grades derived only from lesions within the ETDRS seven-field mask and one set derived from the entire Optomap UWFSLO image. The images were graded independently by two trained graders, LP and SA. In cases wherein there was a discrepancy between the two graders, the results were masked and the images were subjected to arbitration grading by an experienced retinal specialist, VC. Images were viewed on 17″ liquid-crystal display monitors at 1,440×900 resolution using software allowing for 150% zoom and grayscale manipulation of the images to increase lesion detection.
Statistical analysis
The data were tabulated in an MS Excel 2007 spreadsheet (Microsoft, Redmond, WA, USA). Kappa statistics were calculated and assessed using Landis and Koch levels of agreement: <0.20, slight; 0.21–0.40, fair; 0.41–0.60, moderate; 0.61–0.80, substantial; and 0.81–1.00, almost perfect agreement.13 Kappa values were calculated for agreement between results using both unweighted and weighted (using a linear scheme) calculations. DR grades from Optomap UWFSLO and ETDRS seven-field images were cross-tabulated. Results were not adjusted for any correlation between DR data from eyes within the same patient. All statistical analysis was carried out using SPSS 20 (IBM, Armonk, NY, USA).
Statement of ethics
This study fully conformed to the principles of the Declaration of Helsinki and was approved by the local Ethics Committee. We certify that all applicable institutional and governmental regulations concerning the ethical use of human volunteers were followed during this research.
Results
Two hundred and sixty-six Optomap UWFSLO images were selected from the database of clinic attendees on the basis of any evidence of DR lesions. The images were evaluated for DR severity by two graders, and kappa statistics were calculated to determine the level of agreement between the two sets of grading results. For the full Optomap UWFSLO 200° view, the unweighted κ was 0.50±0.05 (95% confidence interval [CI]: 0.41–0.59) and the weighted κ was 0.59±0.04 (95% CI: 0.5–0.67). For the ETDRS seven-field view, the unweighted κ agreement was 0.52±0.05 (95% CI: 0.43–0.6) and weighted κ was 0.60±0.04 (95% CI: 0.52–0.68). These levels of agreement are comparable to those from other studies that have assessed Optomap UWFSLO DR images.11,14 In the 98 cases wherein there was a grading discrepancy between the two graders for the ETDRS seven-field view alone, the Optomap UWFSLO 200° view alone, or both views, the images were graded by the senior retinal specialist masked to the previous results. These arbitration results were then used in place of the initial grades for purposes of statistical analysis.
The DR severity grade in the ETDRS seven-field view, compared with the Optomap UWFSLO 200° view, matched exactly in 85% (226) of the images and within one severity grade in 100% (266) of the images. Agreement between the two views was substantial: unweighted κ was 0.74±0.04 (95% CI: 0.67–0.81) and weighted κ was 0.80±0.03 (95% CI: 0.74–0.86) (Table 1).
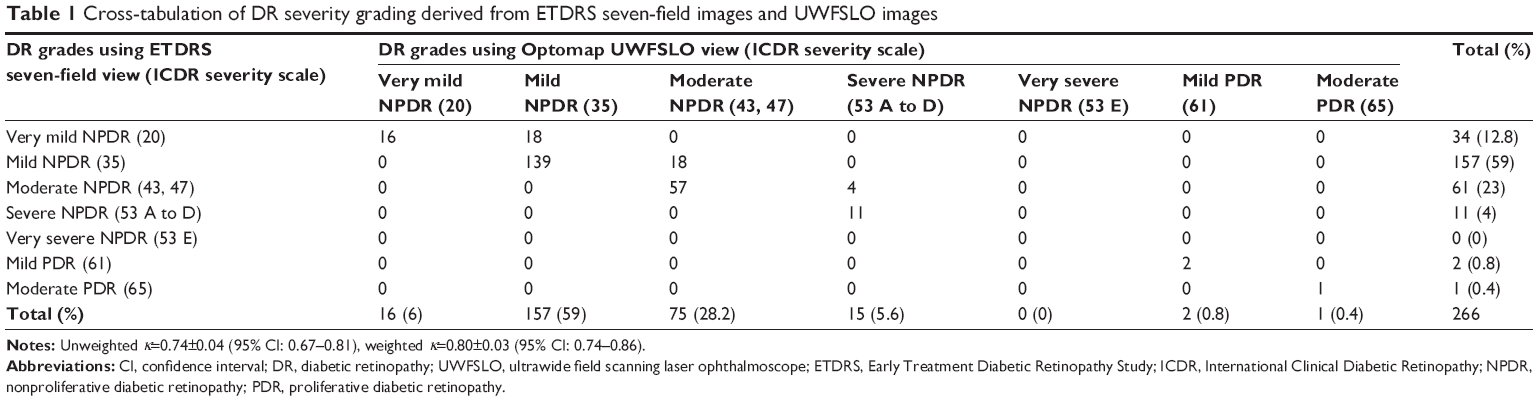 | Table 1 Cross-tabulation of DR severity grading derived from ETDRS seven-field images and UWFSLO images |
The DR grades using the ETDRS seven-field view included 34 (12.8%) very mild nonproliferative DR (NPDR), 157 (59%) mild DR, 61 (23%) moderate DR, eleven (4%) severe NPDR, two (0.8%) mild proliferative DR (PDR), and one (0.4%) moderate PDR. For the Optomap UWFSLO 200° view, there were 16 (6%) very mild NPDR, 157 (59%) mild DR, 75 (28.2%) moderate DR, 15 (5.6%) severe NPDR, two (0.8%) mild PDR, and one (0.4%) moderate PDR grades (Table 1).
Of the 266 images, there was a discrepancy in the ICDR level between the ETDRS seven-field and Optomap UWFSLO 200° views in 50 (19%) of the images (P<0.0001). The DR severity grade was higher in 40 (15%) images (P<0.0001); 18 images were designated as mild NPDR instead of very mild NPDR, 18 images as moderate NPDR instead of mild NPDR, and four images as severe NPDR instead of moderate NPDR.
Discussion
This study has shown that the Optomap UWFSLO field is able to reveal previously undetected DR using the ETDRS seven-field view. This was due to the detection of larger numbers of lesions also present within the ETDRS seven-field view or new lesion types corresponding to more severe DR grades seen outside the ETDRS seven-field view. In 15% of the images from our cohort, these findings were significant enough to result in an increased DR grade. In terms of DR grading level, overall, there was substantial agreement between the Optomap UWFSLO 200° and the ETDRS seven-field views (85% of images with an identical grade and 100% within a single grade).
So far, all trials evaluating Optomap UWFSLO images in DR have used grading systems based on the ETDRS data. This is possible as the grading system relies only on the presence and quadrant-based distribution of characteristic lesions, which can be easily adapted to a larger viewable retinal area. Any assumptions that the resulting DR grades are comparable in terms of prognosis and management considerations should be taken with caution as the clinical significance of peripheral lesions is yet to be described. It is reasonable to infer that the presence of peripheral lesions should correlate well with the ETDRS grading prognosis, as when the seven-field view was evaluated, they were present and hence indirectly accounted for. This theory assumes that DR progression affects the retina relatively uniformly. However, studies have shown that the distribution of lesions is often nonuniform. Early work by Shimizu et al16 observed a midperipheral distribution of vasoocclusive lesions using fluorescein angiography. Silva et al14 using Optomap UWFSLO images, demonstrated that all types of DR lesions are distributed throughout the temporal half of the retina more than the nasal half (P<0.0001). The pathogenesis underlying this uneven retinal distribution of lesions remains unclear, but regional variations in retinal arteriole dilation in response to changes in metabolic demand and blood pressure may be responsible.17
The Optomap UWFSLO 200° images become progressively stretched toward the periphery and therefore the area of retina covered by the ETDRS seven-field mask is marginally larger than the area of retina imaged by the ETDRS seven-field photographs. This phenomenon is a potential source of error when making comparisons, but this effect does not become pronounced until the extreme periphery, and several trials assessing the UWFSLO technology have consistently shown it to have similar sensitivity and specificity in DR grading when compared to ETDRS seven-field film and dilated fundus examination.10–12,18
In our cohort, 15% of eyes screened using Optomap UWFSLO images have a higher DR grading when compared to the ETDRS seven-field view. This result is in agreement with the findings of Silva et al14 (10%), although the patient cohort used in their study was selected to include a set number of each DR severity level and therefore not representative of a typical eye clinic population. It is pertinent to consider whether the presence of peripheral lesions confers a similar prognosis as the presence of more centrally located lesions. Using fluorescein angiography, a link between midperipheral lesions and neovascularization was observed by Shimizu and Muraoka16 and more recently, using ultrawide field imaging, it has been demonstrated that the presence of peripheral ischemia is associated with a three-fold increased chance of concomitant diabetic macular edema.19,20
We hypothesize that there is a small but significant subset of DR patients who exhibit a predominantly or even exclusively (Figure 2) peripheral distribution of retinal lesions. Variability in lesion distribution is probably related to a host of factors, such as DR activity,20 retinal physiology,21 and diabetes type,22 meaning that predicting a patient’s likely lesion distribution is a difficult task. Screening using Optomap UWFSLO images could facilitate earlier identification and treatment of patients with a peripheral distribution of DR lesions. Whether it is appropriate to apply the existing ETDRS grading and management strategies or implement an adapted protocol to account for more rapid disease progression requires further prospective studies on such patients.
 | Figure 2 Optomap UWFSLO image showing a retina with predominantly peripheral lesions outside the ETDRS seven-field view. |
Acknowledgments
We thank Hasneen Karbalai for reviewing the manuscript. This study received no specific funding.
Disclosure
NVC is a consultant for Allergan, Bayer, Heidelberg, Novartis, and Quantel Medical, but none of these consultancy interests are related to this project. Novartis has provided financial support to the department on an unrelated Optomap project in diabetic retinopathy. The other authors report no conflicts of interest in this work.
References
Diabetic Retinopathy Study Research Group. Photocoagulation treatment of proliferative diabetic retinopathy. Clinical application of Diabetic Retinopathy Study (DRS) findings, DRS report number 8. Ophthalmology. 1981;88:583–600. | ||
Early Treatment Diabetic Retinopathy Study Research Group. Photocoagulation for diabetic macular edema. Early treatment diabetic retinopathy study report number 1. Early Treatment Diabetic Retinopathy Study Research Group. Arch Ophthalmol. 1985;103:1796–1806. | ||
Early Treatment Diabetic Retinopathy Study Research Group. Treatment techniques and clinical guidelines for photocoagulation of diabetic macular edema. Early Treatment Diabetic Retinopathy Study Report Number 2. Ophthalmology. 1987;94:761–774. | ||
Early Treatment Diabetic Retinopathy Study Research Group. Early photocoagulation for diabetic retinopathy. ETDRS report number 9. Ophthalmology. 1991;98:766–785. | ||
Early Treatment Diabetic Retinopathy Study Research Group. Fundus photographic risk factors for progression of diabetic retinopathy. ETDRS report number 12. Ophthalmology. 1991;98:823–833. | ||
Gangaputra S, Almukhtar T, Glassman AR, et al; Diabetic Retinopathy Clinical Research Network. Comparison of film and digital fundus photographs in eyes of individuals with diabetes mellitus. Invest Ophthalmol Vis Sci. 2011;52:6168–6173. | ||
Li HK, Danis RP, Hubbard LD, Florez-Arango JF, Esquivel A, Krupinski EA. Comparability of digital photography to the ETDRS film protocol for evaluation of diabetic retinopathy severity. Invest Ophthalmol Vis Sci. 2011;52:4717–4725. | ||
Kirkpatrick JN, Manivannan A, Gupta AK, Hipwell J, Forrester JV, Sharp PF. Fundus imaging in patients with cataract: role for a variable wavelength scanning laser ophthalmoscope. Br J Ophthalmol. 1995;79:892–899. | ||
Scanlon PH, Foy C, Malhotra R, Aldington SJ. The influence of age, duration of diabetes, cataract, and pupil size on image quality in digital photographic retinal screening. Diabetes Care. 2005;28:2448–2453. | ||
Silva PS, Cavallerano JD, Sun JK, Noble J, Aiello LM, Aiello LP. Nonmydriatic ultrawide field retinal imaging compared with dilated standard 7-field 35-mm photography and retinal specialist examination for evaluation of diabetic retinopathy. Am J Ophthalmol. 2012;154:549–559. | ||
Neubauer AS, Kernt M, Haritoglou C, Priglinger SG, Kampik A, Ulbig MW. Nonmydriatic screening for diabetic retinopathy by ultra-widefield scanning laser ophthalmoscopy (Optomap). Graefes Arch Clin Exp Ophthalmol. 2008;246:229–235. | ||
Wilson PJ, Ellis JD, MacEwen CJ, Ellingford A, Talbot J, Leese GP. Screening for diabetic retinopathy: a comparative trial of photography and scanning laser ophthalmoscopy. Ophthalmologica. 2010;224:251–257. | ||
Landis JR, Koch GG. The measurement of observer agreement for categorical data. Biometrics. 1977;33:159–174. | ||
Silva PS, Cavallerano JD, Sun JK, Soliman AZ, Aiello LM, Aiello LP. Peripheral lesions identified by mydriatic ultrawide field imaging: distribution and potential impact on diabetic retinopathy severity. Ophthalmology. 2013;120:2587–2595. | ||
International Clinical Diabetic Retinopathy (ICDR) severity scale. International Council of Ophthalmology; 2002. Available from: www.icoph.org/pdf/Diabetic-Retinopathy-Scale.pdf. Accessed January 4, 2015. | ||
Shimizu K, Muraoka K. Diabetic retinopathy. Is it a maculopathy? A super-wide fluorescein angiographic evaluation. Dev Ophthalmol. 1981;2:235–242. | ||
Skov Jensen P, Jeppesen P, Bek T. Differential diameter responses in macular and peripheral retinal arterioles may contribute to the regional distribution of diabetic retinopathy lesions. Graefes Arch Clin Exp Ophthalmol. 2011;249(3):407–412. | ||
Kernt M, Haritoglou C, Hadi I, et al. Assessment of diabetic retinopathy using nonmydriatic ultra-widefield scanning laser ophthalmoscopy (Optomap) compared with ETDRS 7-field stereo photography. Diabetes Care. 2012;35:2459–2463. | ||
Wessel MM, Nair M, Aaker GD, Ehrlich JR, D’Amico DJ, Kiss S. Peripheral retinal ischaemia, as evaluated by ultra-widefield fluorescein angiography, is associated with diabetic macular oedema. Br J Ophthalmol. 2012;96:694–698. | ||
Oliver SC, Schwartz SD. Peripheral vessel leakage (PVL): a new angiographic finding in diabetic retinopathy identified with ultra wide-field fluorescein angiography. Semin Ophthalmol. 2010;25(1–2):27–33. | ||
Soliman AZ, Silva PS, Aiello LP, Sun JK. Ultra-wide field retinal imaging in detection, classification, and management of diabetic retinopathy. Semin Ophthalmol. 2012;27(5–6):221–227. | ||
Bodansky HJ, Cudworth AG, Whitelocke RAF, Dobree JH. Diabetic retinopathy and its relation to type of diabetes: review of a retinal clinic population. Br J Ophthalmol. 1982;66:496–499. |
 © 2015 The Author(s). This work is published and licensed by Dove Medical Press Limited. The
full terms of this license are available at https://www.dovepress.com/terms
and incorporate the Creative Commons Attribution
- Non Commercial (unported, 3.0) License.
By accessing the work you hereby accept the Terms. Non-commercial uses of the work are permitted
without any further permission from Dove Medical Press Limited, provided the work is properly
attributed. For permission for commercial use of this work, please see paragraphs 4.2 and 5 of our Terms.
© 2015 The Author(s). This work is published and licensed by Dove Medical Press Limited. The
full terms of this license are available at https://www.dovepress.com/terms
and incorporate the Creative Commons Attribution
- Non Commercial (unported, 3.0) License.
By accessing the work you hereby accept the Terms. Non-commercial uses of the work are permitted
without any further permission from Dove Medical Press Limited, provided the work is properly
attributed. For permission for commercial use of this work, please see paragraphs 4.2 and 5 of our Terms.